Analytics for Accelerating Biomedical Innovation
by
Kien Wei Siah
B.Eng., National University of Singapore (2015)
S.M., Massachusetts Institute of Technology (2017)
Submitted to the
Department of Electrical Engineering and Computer Science
in partial fulfillment of the requirements for the degree of
Doctor of Philosophy in Electrical Engineering and Computer Science
at the
MASSACHUSETTS INSTITUTE OF TECHNOLOGY
February 2021
c
○ Massachusetts Institute of Technology 2021. All rights reserved.
Author . . . .
Department of Electrical Engineering and Computer Science
December 17, 2020
Certified by . . . .
Andrew W. Lo
Charles E. and Susan T. Harris Professor, Sloan School of Management
Thesis Supervisor
Accepted by . . . .
Leslie A. Kolodziejski
Professor of Electrical Engineering and Computer Science
Chair, Department Committee on Graduate Students
Analytics for Accelerating Biomedical Innovation
by
Kien Wei Siah
Submitted to the Department of Electrical Engineering and Computer Science on December 17, 2020, in partial fulfillment of the
requirements for the degree of
Doctor of Philosophy in Electrical Engineering and Computer Science
Abstract
Despite the many breakthroughs in biomedical research and the increasing demand for new drugs to treat unmet medical needs, the productivity of research and development in the pharmaceutical industry has been steadily declining for the past two decades and is at its lowest level today. Traditional sources of financing in biopharma are no longer compatible nor aligned with the new realities of biomedical innovation, a process which has become more challenging, complex, expensive, time-consuming, and risky in the past twenty years. This has led to an outflow of capital from the biopharma industry, creating an ever-widening gap in funding between early-stage basic biomedical research and late-stage clinical development, where many promising academic discoveries fail not because of bad science but due to financial reasons. In this thesis, we explore the use of data analytics to facilitate biomedical innovation with a particular emphasis on the mismatch between the risk characteristics of biomedical projects and the risk preferences of biopharma investors.
We begin with a brief introduction of the challenges faced by the biopharma indus-try in Part I. In PartII, we focus on analytics in the context of clinical trials. First, we develop analytics for precision medicine in non-small cell lung cancer, an emerging area of innovation in disease treatment with the advent of human genome sequencing. Next, we train and validate predictive models for estimating the probability of success of drug development programs. By providing greater risk transparency, our models can help facilitate more accurate matching of investor risk preferences with the risks of biomedical investment opportunities, thus increasing the efficiency of capital allo-cation. Finally, we turn our attention to the ongoing COVID-19 (coronavirus disease 2019) pandemic. We propose a systematic framework for quantitatively assessing the potential costs and benefits of different vaccine efficacy trial designs for COVID-19 vaccine development, including traditional and adaptive randomized clinical trials, and human challenge trials (HCTs). Our results contribute to the current ethical debate about HCTs by identifying situations where HCTs can provide greater social value versus non-challenge development pathways, and are thus justifiable.
In Part III, we explore new business models to address the dearth of funding for translational medicine in the valley of death. In view of the increasingly critical role
that academic institutions play in the biotechnology industry, we develop a system-atic framework for tracking the financial and research impact of university technology licensing in the life sciences using the Massachusetts Institute of Technology as a case study. Next, we investigate the use of a recently proposed megafund structure for financing early-stage biomedical research. We extend the existing model to account for technical correlation between assets in the underlying portfolio, thus allowing us to evaluate the tail risks of the megafund more accurately. We show that financial engineering techniques can be used to structure the megafund into derivatives with risk-reward characteristics that are attractive to a broad range of investors. This allows the fund to tap into a substantially larger pool of capital than the traditional sources of biopharma funding. In the last part of the thesis, we further extend the megafund framework to include adaptive clinical trial designs, and demonstrate the economic viability of using the megafund vehicle to finance and accelerate drug de-velopment for glioblastoma, a disease with very few treatment options, low historical probabilities of success, and huge unmet need.
Thesis Supervisor: Andrew W. Lo
Acknowledgments
I am grateful to my thesis supervisor, Professor Andrew W. Lo, for his guidance and support over the past five years. I am deeply inspired by his wisdom, vision, and passion for research with real-world impact. He has been and always will be a role model in my career.
I would also like to thank my thesis committee, Professor Martha L. Gray and Dr. Sean Khozin, and RQE committee, Professor Peter Szolovits and Professor John V. Guttag, who have provided invaluable feedback on my work and encouraged me to see the big picture.
I am thankful to everyone in the MIT Laboratory for Financial Engineering: Jayna Cummings, Crystal Myler, Mavanee Nealon, and Kate Lyons for everything they have done to support our research; Chi Heem Wong, Samuel Huang, Qingyang Xu, Shomesh Chaudhuri, Zied Ben Chaouch, and Manish Singh for the many useful dis-cussions and joint work on several projects. They have made my PhD journey an amazing and enjoyable experience.
I was fortunate to have the opportunity to work with many collaborators and co-authors during my time at MIT: David Aron, Donald Berry, Scott Berry, Christine Blazynski, Meredith Buxton, John Frishkopf, Olga Futer, Mark Gordon, Jerry Gupta, Peter Hale, Michael Hay, Leah Isakov, Nicholas Kelley, Sean Khozin, Grace Lindsay, Jeff Lura, Lita Nelsen, Lesley Millar-Nicholson, Kirk Tanner, and Richard Thakor. I have learned so much about drug development and the biopharma industry from each and everyone. I’m also grateful to the MIT Laboratory for Financial Engineering and the Rockefeller Foundation for funding support. The views and opinions expressed in this thesis are solely my own, and do not necessarily represent the views and opinions of any institution or agency, or any of the individuals acknowledged above.
Finally, being far from home has been a great challenge. I would like to thank my friends and family for their unwavering love and support back in Singapore, without which none of this would be possible.
Contents
I
Introduction
19
1 Challenges of Biomedical Innovation 21
1.1 Introduction . . . 21
1.2 Thesis Contributions . . . 23
1.2.1 Clinical Trial Analytics . . . 23
1.2.2 New Business Models . . . 25
II
Clinical Trial Analytics
29
2 Predictive Models for Patient Outcomes in Lung Cancer 31 2.1 Introduction . . . 322.2 Data . . . 33
2.2.1 Study Population . . . 33
2.2.2 Tumor Response Data . . . 35
2.2.3 Longitudinal Tumor Size Data . . . 43
2.2.4 Survival Data . . . 44
2.3 Methods . . . 48
2.3.1 Stochastic Model for Tumor Growth . . . 48
2.3.2 Machine Learning Models for Objective Response . . . 51
2.3.3 Statistical Models for Survival . . . 52
2.4 Results . . . 53
2.4.2 Survival . . . 57
2.5 Discussion . . . 64
3 Predictive Models for Drug Development Programs 71 3.1 Introduction . . . 72 3.2 Data . . . 75 3.2.1 Summary Statistics . . . 75 3.2.2 Missing Data . . . 80 3.3 Methods . . . 81 3.3.1 Statistical Imputation . . . 83
3.3.2 Machine Learning Models . . . 88
3.4 Results . . . 90
3.4.1 Imputation Versus Listwise Deletion . . . 90
3.4.2 Predicting Drug Approvals . . . 96
3.4.3 Predictions Over Time . . . 99
3.5 Discussion . . . 104
4 Cost/Benefit Analysis of Vaccine Trial Designs for COVID-19 115 4.1 Introduction . . . 116
4.2 Simulation Framework . . . 118
4.3 Vaccine Efficacy Trial Designs . . . 119
4.3.1 Traditional Randomized Clinical Trial . . . 119
4.3.2 Optimized Randomized Clinical Trial . . . 121
4.3.3 Adaptive Randomized Clinical Trial . . . 122
4.3.4 Human Challenge Trial . . . 122
4.4 Efficacy Analysis . . . 124
4.4.1 Fixed-Duration Clinical Trial . . . 124
4.4.2 Superiority-by-Margin Testing . . . 126
4.4.3 Adaptive Clinical Trial . . . 127
4.5 Epidemiological Model . . . 131
4.7 Results . . . 134
4.8 Discussion . . . 136
4.9 Conclusion . . . 144
III
New Business Models
145
5 Impact of University Technology Licensing: A Case Study of MIT 147 5.1 Introduction . . . 1485.2 Data . . . 152
5.3 Measures of Impact . . . 152
5.3.1 Orange Book Citations . . . 152
5.3.2 Initial Public Offerings . . . 154
5.3.3 Mergers and Acquisitions . . . 157
5.3.4 Research and Development Pipeline . . . 157
5.3.5 Drug Approvals . . . 161
5.3.6 Intellectual Property . . . 163
5.4 Discussion . . . 165
5.5 Conclusion . . . 169
6 Financing Correlated Drug Development Projects 171 6.1 Introduction . . . 172
6.2 Methods . . . 173
6.2.1 Simulation Framework . . . 173
6.2.2 Parameters . . . 177
6.2.3 Gaussian Copula . . . 179
6.2.4 Impact of Correlation on Tail Risk . . . 183
6.3 Results . . . 187
6.3.1 Simulation . . . 187
6.3.2 Sensitivity Analysis . . . 192
7 Financing Treatments for Glioblastoma 205
7.1 Introduction . . . 206
7.2 Parameters . . . 207
7.2.1 Portfolio . . . 208
7.2.2 Probability of Success, Cost of Development, and Duration . . 212
7.2.3 GBM AGILE . . . 212
7.2.4 Correlation . . . 216
7.2.5 Profitability of an Approved Compound . . . 216
7.3 Results . . . 218 7.3.1 Baseline . . . 218 7.3.2 Sensitivity Analysis . . . 222 7.4 Discussion . . . 225 7.5 Conclusion . . . 226
IV
Conclusion
227
8 Summary of Findings 229V
Appendices
233
A Supplement to Chapter 2 235 A.1 Scaling RECIST Measurements . . . 235A.2 Case Studies of Longitudinal Data . . . 237
A.3 Features for Predictive Models . . . 240
B Supplement to Chapter 3 243 B.1 Data Preprocessing . . . 243 B.2 Multiple Imputation . . . 248 B.2.1 Imputation . . . 248 B.2.2 Analysis . . . 249 B.2.3 Pooling . . . 249
B.3 Imputation Versus Listwise Deletion. . . 251
B.3.1 Simulating Missingness . . . 259
B.4 Comparison with ANDI . . . 262
B.4.1 Modified ANDI . . . 264
B.5 Random Splitting Versus Temporal Ordering . . . 268
B.6 Additional Results . . . 270
C Supplement to Chapter 4 273 C.1 Asymptotics for Superiority-by-Margin Testing . . . 273
C.2 Parameter Estimation for the SIRDC-SD Model . . . 274
C.3 SIRDCV Model . . . 275
C.4 Evolution of the Epidemic . . . 276
C.4.1 Status Quo . . . 276
C.4.2 Ramp . . . 276
C.4.3 Behavioral . . . 276
C.5 Financial Costs of Vaccine Efficacy Studies . . . 277
C.6 Additional Results . . . 278
C.7 Steps in HCT Setup . . . 312
D Supplement to Chapter 5 315 D.1 Company Screening . . . 315
D.2 Orange Book Citations . . . 316
D.3 Initial Public Offerings . . . 318
D.4 Mergers and Acquisitions . . . 320
D.5 Research and Development Pipeline . . . 321
D.6 Drug Approvals . . . 325
D.7 Intellectual Property . . . 329
D.8 FDA Approvals . . . 333
E Supplement to Chapter 6 337
E.1 S&P Historical Default Rates . . . 337
F Supplement to Chapter 7 339 F.1 Literature Estimates . . . 339
F.2 Estimates by Experts . . . 340
F.3 Cost and Duration of GBM AGILE . . . 341
F.4 Correlation . . . 343
List of Figures
2-1 Sample size of the dataset after filtering . . . 38
2-2 Waterfall plots of DPR . . . 42
2-3 Distributions of key tumor size data . . . 45
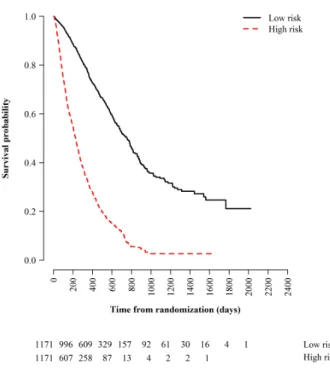
2-4 Kaplan-Meier survival curves . . . 47
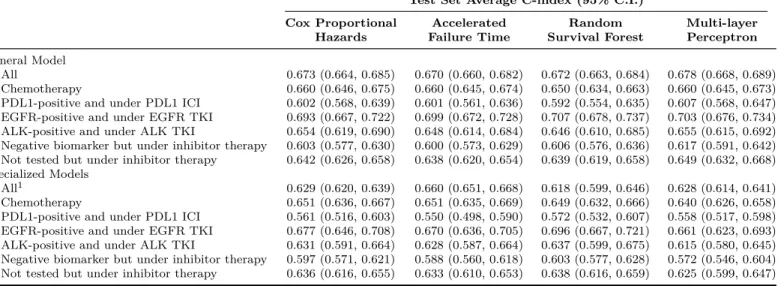
2-5 Calibration plots of the PFS Cox proportional hazards model. . . 61
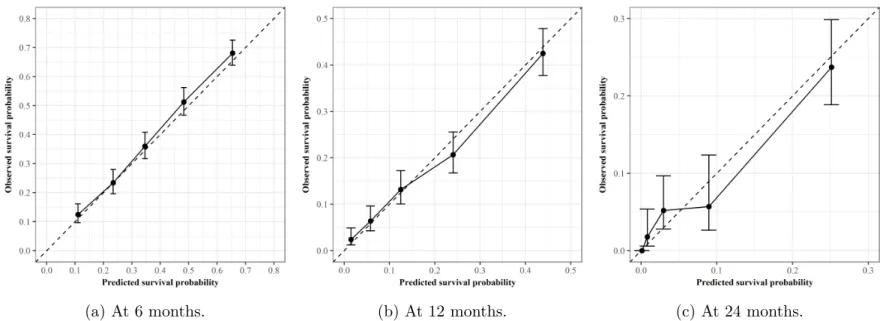
2-6 Calibration plots of the OS Cox proportional hazards model . . . 62
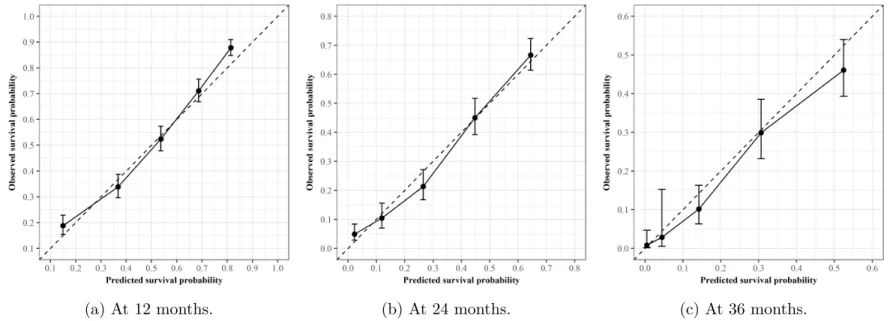
2-7 Risk stratification by survival models . . . 63
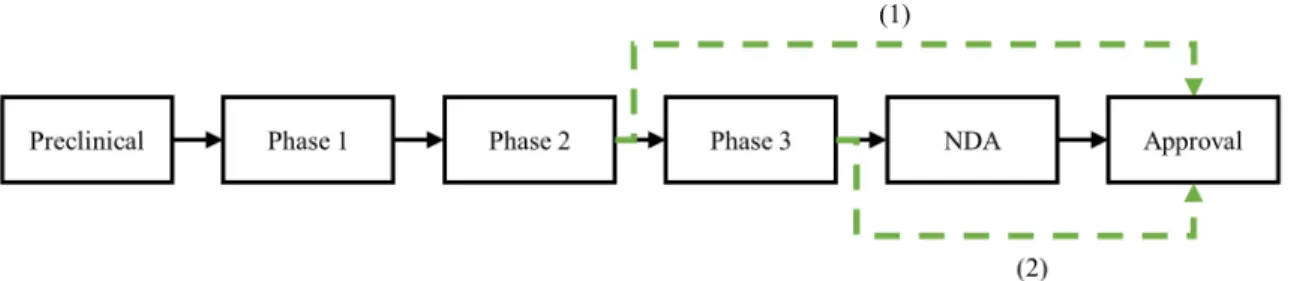
3-1 Predictive models for regulatory approval . . . 75
3-2 Success rates over time in datasets . . . 79
3-3 Missingness in drug features . . . 81
3-4 Missingness in trial features . . . 82
3-5 Imputation and machine learning methodology . . . 83
3-6 Feature matrix . . . 91
3-7 Comparison of 5NN-RF and ANDI . . . 93
3-8 Distributions of prediction scores . . . 101
3-9 Time-series walk-forward analysis . . . 105
3-10 Time-series walk-forward results . . . 105
3-11 Distributions of prediction scores . . . 107
3-12 Network graph of pipeline predictions for P2APP . . . 108
4-1 Simulation framework . . . 120
4-2 Infections as time-to-event data . . . 130
5-1 Highest stage of development of pipeline candidates of MIT licensees 160
5-2 Indication groups of pipeline candidates of MIT licensees . . . 160
5-3 Summary statistics of approved drugs with MIT licensee contribution 164 6-1 Simulation framework for the megafund. . . 176
6-2 Drug development process as a multi-state Markov chain . . . 180
6-3 Distribution functions of successes . . . 186
6-4 Distributions of cumulative ROE . . . 190
6-5 Sensitivity of cumulative ROE . . . 200
6-6 Sensitivity of annualized ROE . . . 201
7-1 Simulation framework for the megafund. . . 209
7-2 Possible development paths for the portfolio . . . 215
7-3 Correlation matrix of brain cancer projects . . . 217
7-4 Investment timeline of a brain cancer drug . . . 219
A-1 Case studies of longitudinal SLD data. . . 239
B-1 Data cleaning for P2APP . . . 244
B-2 Data cleaning for P3APP . . . 245
B-3 Multiple imputation . . . 248
B-4 Datasets created in experiment . . . 255
B-5 Distribution of accrual after imputation. . . 260
B-6 ROC curve of ANDI . . . 265
D-1 Simple moving average of MIT biotech company IPOs . . . 318
D-2 BRDPI adjusted net proceeds for IPOs . . . 319
D-3 IPO dilution . . . 319
D-4 Acquisition values of MIT biotech companies . . . 320
D-5 Cumulative patents granted to MIT licensees . . . 330
List of Tables
2.1 Characteristics of clinical trials in the dataset . . . 36
2.2 List of variables extracted from SDTM and ADaM databases . . . 37
2.3 Summary statistics of categorical features. . . 39
2.4 Summary statistics of continuous features . . . 39
2.5 Summary statistics of best overall response . . . 41
2.6 Median PFS and OS . . . 46
2.7 Performance of predictive models for tumor response . . . 56
2.8 Top 20 coefficients of the general statistical model . . . 58
2.9 Top 20 coefficients of the general logistic regression model . . . 59
2.10 Performance of predictive models for PFS . . . 60
2.11 Performance of predictive models for OS . . . 60
2.12 Top 20 coefficients of the PFS Cox proportional hazards model . . . . 64
2.13 Top 20 coefficients of the OS Cox proportional hazards model . . . . 65
3.1 Description of drug and trial features . . . 77
3.2 Sample sizes of datasets . . . 78
3.3 Breakdown by indication groups . . . 78
3.4 Breakdown by sponsor types . . . 79
3.5 Missingness in drug features . . . 82
3.6 Missingness in trial features . . . 83
3.7 Sample size of gold-standard dataset . . . 93
3.8 Out-of-sample performance of missing data approaches . . . 94
3.10 Distributions of prediction scores . . . 100
3.11 Distributions of prediction scores . . . 100
3.12 Top ten most important variables . . . 102
3.13 Distributions of prediction scores . . . 106
3.14 Distribution of prediction scores . . . 106
3.15 Top ten most important variables . . . 109
3.16 Out-of-sample and out-of-time performance for P2APP . . . 110
3.17 Out-of-sample and out-of-time performance for P3APP . . . 111
3.18 Top five pipeline predictions for P2APP by indication groups . . . 112
4.1 Assumptions common across all clinical trial designs. . . 124
4.2 Assumptions specific to each clinical trial design . . . 125
4.3 Sensitivity analysis . . . 136
4.4 Expected number of incremental infections and deaths avoided . . . . 137
5.1 Top 30 worldwide top-selling drugs in 2000 . . . 150
5.2 Top 30 worldwide top-selling drugs in 2015 . . . 151
5.3 Summary of MIT portfolio of life science and therapeutics companies 152 5.4 List of MIT IP citations in the Orange Book . . . 154
5.5 IPO data of publicly traded therapeutics companies . . . 156
5.6 Acquisition values of MIT biotech companies . . . 158
5.7 Summary statistics of drug approvals by MIT licensees . . . 163
6.1 Parameters used to simulate a megafund for rare diseases . . . 180
6.2 Distribution functions of successes . . . 185
6.3 Performance of RBO structures . . . 191
6.4 Sensitivity of the vanilla RBO performance . . . 197
6.5 Sensitivity of the guarantee-backed RBO performance . . . 198
6.6 Sensitivity of the equity-only RBO performance . . . 199
7.1 Hypothetical portfolio of brain cancer therapeutics . . . 211
7.3 Parameters for GBM AGILE. . . 215
7.4 Performance of the NBTS portfolio . . . 221
A.1 List of predictive factors for tumor response . . . 241
B.1 Data pre-processing procedures . . . 245
B.2 Examples of drug and trial features . . . 246
B.3 Biasness of imputations . . . 256
B.4 Out-of-sample performance of missing data approaches . . . 257
B.5 Missingness in drug features . . . 261
B.6 Missingness in trial features . . . 261
B.7 Sample size of oncology-only dataset . . . 264
B.8 Modified ANDI rubric . . . 264
B.9 Oncology ANDI algorithm . . . 267
B.10 Comparison of random splitting and temporal ordering . . . 269
B.11 Out-of-sample and out-of-time performance for P2APP . . . 270
B.12 Out-of-sample and out-of-time performance for P3APP . . . 272
C.1 Expected number of incremental infections and deaths avoided . . . . 278
C.2 Expected number of incremental infections and deaths avoided . . . . 280
C.3 Expected number of incremental infections and deaths avoided . . . . 282
C.4 Expected number of incremental infections and deaths avoided . . . . 284
C.5 Expected number of incremental infections and deaths avoided . . . . 286
C.6 Expected number of incremental infections and deaths avoided . . . . 288
C.7 Expected number of incremental infections and deaths avoided . . . . 290
C.8 Expected number of incremental infections and deaths avoided . . . . 292
C.9 Estimated date of licensure and probability of approval . . . 294
C.10 Estimated date of licensure and probability of approval . . . 296
C.11 Estimated date of licensure and probability of approval . . . 298
C.12 Estimated date of licensure and probability of approval . . . 300
C.14 Estimated date of licensure and probability of approval . . . 304
C.15 Estimated date of licensure and probability of approval . . . 306
C.16 Estimated date of licensure and probability of approval . . . 308
C.17 Estimated date of licensure and probability of approval . . . 310
D.1 Expanded list of MIT IP citations in the Orange Book . . . 317
D.2 Pipeline candidates by highest development stage . . . 323
D.3 Pipeline candidates by indication group . . . 324
D.4 List of drugs with MIT licensee contribution . . . 326
D.5 Label expansions by MIT licensees . . . 327
D.6 Post-acquisition drug approvals by MIT licensees . . . 328
D.7 Patents licensed by and granted to MIT licensees . . . 331
D.8 FDA NDA/BLA and NME/ NBE drug approvals . . . 333
E.1 Global corporate average cumulative default rates . . . 338
F.1 Literature estimates of parameters for standard clinical trials . . . 339
F.2 Estimates of parameters for standard clinical trials by NBTS experts 340 F.3 Assumptions for profitability of an approved drug for GBM . . . 344
Part I
Chapter 1
Challenges of Biomedical
Innovation
1.1
Introduction
The past two decades have seen an onslaught of biomedical innovations that have revolutionized drug discovery and disease treatment, including gene therapies for dis-eases thought to be incurable, immunotherapies for cancers, the use of human genome sequencing to discover new treatment modalities, 3D printing of complex biomateri-als, and not to mention advances in medical imaging, bioinformatics, and diagnostics. Despite the many promising breakthroughs, studies show that the research and devel-opment (R&D) productivity of the pharmaceutical industry has actually been steadily declining since 2000 and is at its lowest level today [1,2,3]. Even the most optimistic estimate puts the current pharmaceutical R&D efficiency at levels no higher than twenty years ago [4].
The truth is that biotechnology and pharmaceutical R&D has become more chal-lenging for various reasons. Advances in molecular biology have led to a proliferation of plausible targets to pursue for therapeutic intervention [5,6]. Most of these genomic targets are highly novel yet poorly validated, making projects based on such targets much riskier undertakings than the well-characterized targets that were developed in the 1990s [7]. The “omics” revolution has also catalyzed a shift in the drug
indus-try away from the “one-size-fits-all” paradigm to personalized medicine approaches optimized based on specific patient characteristics and biomarkers. While highly spe-cific therapeutics show great potential, they are more expensive and time-consuming to develop. More importantly, because such specialized products target only small populations of patients, they generate significantly less revenue as compared to block-buster drugs a decade ago, especially in the current climate where the pricing of new therapies has come under increasing scrutiny and pressure from regulators, payers, and patients.
Combinatorial drug discovery—an important alternative to the conventional single-agent approach for identifying effective combination therapies to treat complex dis-eases such cancers and neurological disorders—has also become less efficient over time as the combinatorial chemical search space increases exponentially with each new drug approval. The amount of resources required to search through the sheer number of possibilities has substantially slowed down discovery efforts. Furthermore, an ever-improving back catalog of approved medicines has raised the evidential hurdle for approval, making it increasingly difficult to achieve incremental improvement over time [1]. This crowds R&D activity into hard-to-treat diseases and complex treat-ment modalities that are potentially more transformative but also riskier to develop. Regulatory hurdles also appear to be rising as we observe a progressive lowering of risk tolerance by regulators [1]. The ever-growing number of safety requirements imposed by the U.S. Food and Drug Administration (FDA) has only made it more costly for biopharma companies to navigate the drug development process [8].
Today, there is significant uncertainty surrounding the scientific, medical, eco-nomic, regulatory, academic, and political environments within the biomedical ecosys-tem. Rising costs of clinical trials, a shift in research focus to more complex scientific pathways that have higher risks of failure, a tougher regulatory environment, tight-ening of drug pricing legislation, increasing competition from generics, the looming patent cliff for biologics, mounting competitive pressure in emerging markets, and continuing downward pressure by funding organizations on R&D budgets have cre-ated a volatile, unconducive environment for investments [2]. These factors have led
to diminishing returns in pharmaceutical R&D, further driving investors away from the biomedical industry to other sectors that can provide more attractive opportu-nities. According to the National Venture Capital Association (NVCA), the dollar volume of venture capital (VC) investments in the life sciences as proportion of total VC activity in the U.S. was 16.8% in 2019, one of the lowest levels since 2004 when it was as high as 27.7% [9, 10]. The total number of active biotech VC firms and number of biotech initial public offerings in the U.S. and Europe have also declined since 2014, indicating weakened interest from both private and public equity, the traditional funding sources of biotech startups [11, 12]. This outflow of capital has created an ever-widening gap in funding between early-stage basic biomedical research (usually funded by research grants from government agencies such as the National Institutes of Health) and late-stage clinical development (typically financed by large pharmaceutical companies), where many promising academic discoveries go to die not because of bad science but due to financial reasons. This vacuum in the funding of translational R&D is well known in the drug industry as the valley of death.
1.2
Thesis Contributions
In this thesis, we explore the use of data analytics to facilitate biomedical innovation in different areas, with a particular emphasis on the mismatch between the risk char-acteristics of biomedical projects and the risk preferences of biopharma investors as outlined in Section 1.1. Apart from the introduction and the conclusion, the thesis consists of six chapters, which can be broadly categorized into two themes: clinical trial analytics and new business models. Work on this thesis has led to multiple pub-lications on related topics [13,14,15,16,17,18] and several papers that are currently pending submission [19] or under review as of writing [20, 21].
1.2.1
Clinical Trial Analytics
In Chapter 2, we develop data analytics for precision medicine, an emerging area of innovation in disease treatment with the advent of human genome sequencing. While
the prediction of clinical outcomes is central to personalized medicine and the design of clinical trials, especially for a heterogeneous disease like non-small cell lung cancer (NSCLC), there are no predictive models for NSCLC that are widely implemented in practice. In this chapter, we apply survival analysis and machine learning techniques on patient-level clinical trial data to develop prognostic models for response and sur-vival in patients with advanced NSCLC. Our models reflect recent advances in the treatment paradigm of NSCLC, including biomarker-driven personalized treatments such as targeted therapies (e.g., epidermal growth factor receptor tyrosine kinase in-hibitors) and immunotherapies (e.g., programmed death-ligand 1 immune checkpoint inhibitors).
In Chapter 3, we turn our attention to the development of better analytics for quantifying and characterizing the risks and uncertainty in biomedical projects. In particular, the probability of success (PoS) of clinical trials is a key parameter that many clinical researchers and biopharma investors consider when making important scientific and business decisions. Without up-to-date estimates, investors may mis-judge the risk and value of projects, leading to lost opportunities for both investors and patients. Therefore, having accurate estimates of the PoS is critical for effi-cient risk management and resource allocation. In this chapter, we apply statistical imputation methods and machine learning algorithms on two large pharmaceutical pipeline databases to develop predictive models for estimating the PoS of drug de-velopment programs. The use of artificial intelligence in drug dede-velopment is not a new concept. Drug developers have already applied machine-learning tools to the discovery process via high-throughput screening of vast libraries of chemical and bio-logical compounds to identify drug targets. However, in managing their portfolios of investigational drugs, biopharma companies typically use unconditional estimates of regulatory approval rates based on historically observed relative frequencies. We pro-pose the use of a wide range of drug and clinical-trial features to obtain conditional estimates of success, and show that our approach achieves promising levels of predic-tive power. By providing more accurate forecasts of drug development outcomes, and consequently greater risk transparency, our models can help facilitate more accurate
matching of investor risk preferences with the risks of biomedical investment oppor-tunities. Such predictive analytics also reduces the uncertainty surrounding drug development, which will in turn increase the amount of capital that investors are willing to allocate to biomedical projects. By extension, this would lower the cost of capital and increase the efficiency of capital allocation and portfolio decision-making. In Chapter 4, we focus on analytics related to the ongoing coronavirus pandemic. The world is facing unprecedented challenges from the COVID-19 (coronavirus disease 2019) pandemic. Given the dire situation, human challenge clinical trials (HCTs) have been proposed as a way to expedite the vaccine development process. While moral concerns have been raised, bioethicists generally agree that an HCT may be ethi-cally permissible if it can provide greater societal value versus traditional pathways. However, there has not been any quantitative analysis of the potential benefits of a COVID-19 HCT versus non-challenge trials in literature, thus making it difficult to justify the use of a challenge study at this time. In this chapter, we propose a systematic, transparent, reproducible, and principled simulation framework for quan-titatively assessing the potential costs and benefits of different vaccine efficacy clinical trial designs for COVID-19 vaccine development, including traditional and adaptive randomized clinical trials, and HCTs. Our results contribute to the moral and eth-ical debate about HCTs by identifying situations where HCTs can provide greater social value versus conventional development pathways, and are thus justifiable. Our methodology allows stakeholders, such as vaccine developers, policymakers, and HCT volunteers to understand the implications of their actions (or inaction), and to make more informed ethical decisions regarding accelerating COVID-19 vaccine develop-ment amidst this crisis.
1.2.2
New Business Models
In Chapter 5, we perform a systematic study of technology licensing by the Mas-sachusetts Institute of Technology (MIT) in the therapeutics domain. The process of drug development in the pharmaceutical industry is undergoing a profound shift in its industrial organization. Instead of relying on in-house research, big pharmaceutical
companies are deploying growing amounts of capital previously committed to inter-nal R&D to acquire late stage, de-risked clinical assets with nearer-term payoffs to replenish their development pipelines [22]. On the other hand, smaller biotechnology firms have taken a more active role in early-stage drug discovery. Academic institu-tions also play an increasingly critical role in the industry through the licensing of seminal discoveries and the creation of startups. Despite the growing importance of technology licensing to the biomedical ecosystem, there has been surprisingly little data collected on the impact of technology transfer by academia. In this chapter, we address the knowledge and data gap through a systematic analysis of the financial and research impact of MIT life sciences technology licensing. We construct several measures of impact including MIT patents cited in the Orange Book, capital raised, outcomes from mergers and acquisitions, patents granted to MIT intellectual property licensees, drug candidates discovered, and U.S. drug approvals, a key benchmark of innovation in the biopharma industry. Our methodology provides a useful framework for other academic institutions to track the outcomes of their intellectual property in the therapeutics domain.
As discussed in Section 1.1, traditional sources of financing in biopharma R&D, such as private and public equity, and VC, are no longer effective nor adequate for sup-porting early-stage translational research, which corresponds to the riskiest and most challenging part of the biomedical innovation process. Due to increasing complex-ity and risk, the needs and expectations of limited partners and shareholders have become less aligned with the new realities of biomedical innovation. For example, the constant scrutiny of corporate performance has steered the senior management of public companies towards projects with surer and nearer-term payoffs, and away from more speculative but potentially transformative research [23]. According to the Dow Jones VentureSource, less than 4% of the biotech companies funded by VCs in 2014 were in the seed stage [24]. In contrast, almost 80% of the biotech companies that received VC investments were already in product development, indicating the lack of interest and support from VCs in early-stage startups. This is not surprising, given that drug development is widely accepted as one of the most complex and riskiest
businesses that is not only subjected to scientific challenges but also vulnerable to external economic and public policy conditions.
Biomedical projects are difficult to fund on a standalone basis because they require a large amount of initial capital, have long gestation lags during which no cash flows are generated and additional investments are needed, and perhaps most importantly, have low probabilities of success [25]. The average drug requires at least a decade of translational research and clinical testing before it is approved by the FDA. Because of these characteristics, the funding requirements of biomedical research far outstrip the capital available from traditional sources of funding, thus creating a valley of death. In Chapters6and7, we study the use of financial engineering techniques such as portfolio theory and securitization to mitigate and structure the risks inherent in biomedical projects. In particular, we consider the recently proposed megafund approach [23], which involves combining a large number of biomedical assets into a single portfolio to diversify the financial risk of therapeutic development and increase the likelihood of success through multiple “shots on goal.” Although it is impossible for any VC to fund a portfolio of such scale (requiring capital between hundreds of millions to several billion dollars to achieve sufficient risk reduction) singlehandedly, the megafund can tranched—that is, securitized—to create equity and investment grade bonds with risk-reward characteristics that are attractive to institutional investors. This allows the fund to tap into the fixed income market, a substantially larger pool of capital than the conventional sources of biopharma R&D financing but one traditionally unwilling to participate in biopharma investments due to the risky and fragmented nature of drug development. According to the Securities Industry and Financial Markets Association, the size of the U.S. bond market was $45 trillion in 2019, which is two orders of magnitude larger than the $444 billion in assets under management by VCs in the same year, as reported by the NVCA [10, 26].
In Chapter 6, we extend the recently proposed megafund structure to account for technical correlation between assets in the underlying portfolio using a single-factor model with a Gaussian copula, thus making it a more realistic representation of bio-pharma R&D, and also allowing us to evaluate the tail risks of the megafund more
accurately—the financial crisis of 2008 has made clear the importance of correlations between underlying assets in the valuation of asset-backed securities [27]. In Chap-ter 7, we further extend the megafund framework to include adaptive clinical trial designs, and demonstrate the economic viability of using the megafund vehicle to finance and accelerate drug development for glioblastoma, a disease with very few treatment options, low probabilities of success, and huge unmet need.
Part II
Chapter 2
Predictive Models for Patient
Outcomes in Lung Cancer
Lung cancer is the leading cause of cancer-related mortality in the world. In par-ticular, non-small cell lung cancer (NSCLC) accounts for approximately 85% of lung cancer cases. Recent advances in molecularly targeted therapy and immunotherapy have changed the treatment paradigm of NSCLC. An updated predictive model for clinical outcomes that reflects the current standard of care for advanced-stage NSCLC has broad clinical utility in terms of developing individualized treatment plans and risk stratification. In this chapter, we aggregate data from 17 randomized clinical tri-als submitted to the U.S. Food and Drug Administration, evaluating chemotherapy, targeted therapy, and immunotherapy in patients with advanced NSCLC. We develop and validate a range of statistical and machine-learning predictive models for three im-portant clinical endpoints—objective response (OR), progression-free survival (PFS) and overall survival (OS)—in NSCLC patients using routinely collected patient and disease variables, including biomarker mutations, and inhibitor therapy. Our models achieved promising out-of-sample predictive performances. We find biomarker status to be the strongest predictor of OR, PFS, and OS in patients treated with immune checkpoint inhibitors and targeted therapies. However, single biomarkers have lim-ited predictive value, especially for immunotherapy. To advance beyond the results achieved in this study, data on composite multi-omic signatures is required.
2.1
Introduction
Lung cancer is one of the most commonly diagnosed cancers in the United States and worldwide, and the leading cause of cancer-related mortality. In particular, non-small cell lung cancer (NSCLC) accounts for approximately 85% of lung cancer cases. The majority of NSCLC patients are diagnosed at advanced stages (III and above) [28]. The standard of care for these patients is typically chemotherapy. However, recent advances in molecularly targeted therapy and immunotherapy have been shown to significantly improve the survival of specific patient groups.
Predictive models play an important role in cancer treatment planning. These models, by providing accurate predictions of the survival rate, allow patients to make more informed decisions about treatment. Because cases of NSCLC comprise a het-erogeneous group of patients, there is a wide variation in the effectiveness of different therapies. With predictive models for clinical outcomes, physicians can develop treat-ment plans based on the specific characteristics of individual patients rather than on general statistics of the population. In addition, predictive models can be used to support patient selection and risk stratification in clinical trials. Despite their clin-ical relevance, however, there are no predictive models for NSCLC that are widely implemented in practice. Mahar et al. [29] reviewed 32 lung cancer prognostic tools published between 1996 and 2015. They found many studies to be poorly designed and inadequately described. Most did not conduct a formal evaluation of the internal validity of the developed model. Some contained novel but expensive and difficult to measure factors that would be impractical to include in prognostic models intended for common clinical use.
In this chapter, we perform a pooled analysis of 17 randomized clinical trials in NSCLC submitted to the U.S. Food and Drug Administration (FDA) to support New Drug Applications. The trials evaluated chemotherapy, targeted therapy, and immunotherapy treatments in patients with advanced NSCLC. We characterize the tumor dynamics, response, progression-free survival (PFS), and overall survival (OS) of patients under these different treatment modalities. Our aim is to develop updated
predictive models for three important clinical endpoints—tumor response, PFS, and OS—that reflect recent advances in the treatment paradigm of NSCLC. To this end, we propose a stochastic tumor growth model based on the longitudinal tumor size data collected in clinical trials to predict tumor response. At the same time, we ex-plore machine-learning algorithms and survival models. In our models, we consider clinical, demographic, and pathological features routinely collected in medical screen-ings. We describe our training and testing methodology in Section 2.3. At the end, we identify baseline variables that are strongly associated with response and survival, and compare our findings with related studies in the literature.
2.2
Data
2.2.1
Study Population
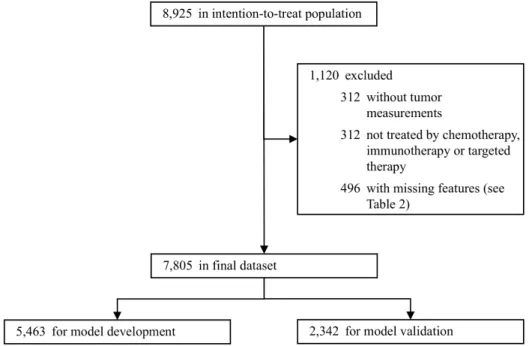
We specify 17 randomized clinical trials submitted to the FDA between January 2007 and February 2017 as our initial dataset. These trials evaluate treatments under nine approved drugs for NSCLC, consisting of three programmed death-ligand 1 (PDL1) immune checkpoint inhibitors (ICI), three epidermal growth factor receptor (EGFR) tyrosine kinase inhibitors (TKI), and three anaplastic lymphoma kinase (ALK) TKIs. We summarize the characteristics of the clinical trials—experimental and control arms, trial design, line of therapy, and sample size—in Table 2.1. Five trials test immunotherapy, one in the first-line setting and four in the second-line setting; four trials assess ALK-translocation targeted therapy, two in the first-line setting and two in the second-line setting; and eight trials evaluate EGFR-mutation targeted therapy, four in the first-line setting, three in the second-line setting, and one in the third-line setting. Almost all trials are open-label with standard-of-care chemotherapy as the control arm. In aggregate, the dataset includes 8,925 patients in the intention-to-treat population.
We extract survival data, tumor measurements, response outcomes, baseline de-mographics, medical history, and laboratory tests results from patient-level Study
Data Tabulation Model (SDTM) and Analysis Data Model (ADaM) databases. Af-ter compiling and standardizing common features across all trials, we have 46 cate-gorical variables and 5 continuous variables in the dataset (excluding endpoints, see Table 2.2).
All trials in our dataset adopt the Response Evaluation Criteria in Solid Tu-mors (RECIST) for tumor measurements and response outcomes. In cases where both investigator-assessed and independent review committee (IRC)-determined tu-mor measurements are available, we give priority to the version used by the investiga-tors to decide the continuation or discontinuation of the study medication, as stated in the clinical trial protocol. For response outcomes, we give priority to confirmed outcomes over unconfirmed ones, and use values assessed by IRC whenever available, since they are generally perceived to be more reliable and less susceptible to bias com-pared to investigator-assessed outcomes—e.g., IRC-confirmed best overall responses are often used to compute the objective response rate as a secondary endpoint in clinical trials. We do the same for PFS. Five studies in the dataset were initiated under the older RECIST version 1.0, and use the sum of longest diameter (SLD) measurements based on up to ten measurable target lesions. This limit was reduced to five lesions in RECIST version 1.1. In order to reconcile measurements collected under the older criteria with the current version, we scale earlier measurements to reflect the new five lesion limit (see Appendix A.1).
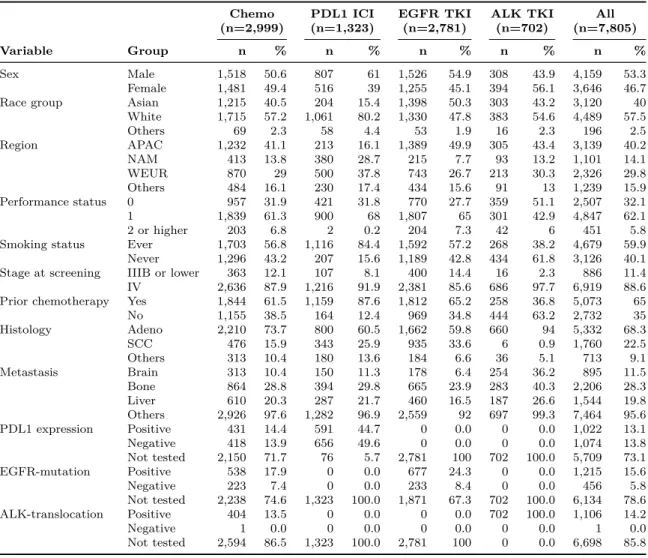
For our analysis, we exclude patients who either (1) did not have tumor measure-ments in the database, or had ambiguous records, such as non-measurable disease, no target lesions, or a 0 mm baseline SLD, (2) were given a placebo (e.g., the placebo comparator arm in the third-line Afatinib trial) or were not otherwise treated by chemotherapy, immunotherapy, or targeted therapy in the clinical trial before its dis-continuation, or (3) had missing features in their records that were necessary for subsequent analyses. The final sample comprises 7,805 patients (see Fig. 2-1). In Tables 2.3 and 2.4, we pool patients by the type of therapy received—chemotherapy, PDL1 ICI, EGFR TKI, and ALK TKI—and list the summary statistics of key baseline demographics and medical history to give the reader an intuition for the
characteris-tics of the dataset.
Most patients in our dataset have advanced NSCLC with some form of metasta-sis. All patients treated with ALK TKI are proven positive for the ALK mutation. In contrast, about two-thirds of the patients (67%) under EGFR TKI have an un-known EGFR mutation status. The proportion of patients in the sample with ALK rearrangements (9%) is almost twice that observed in the general NSCLC population (5%) [30]. The overall median patient age is 60 years, with that for the ALK trials being lower at 53 years. Unlike other therapy groups, about 62% of the ALK sample have no history of smoking, and over 90% are diagnosed with adenocarcinoma. This is consistent with studies showing that ALK translocations are observed predominantly in adenocarcinomas, and among younger and nonsmoking patients [31].
Most of the patients are enrolled outside the United States, mainly in the Asia-Pacific and the Western Europe regions. Over half of the patients in the dataset are white (58%). In particular, PDL1 ICI seems to be much more well-studied in Caucasians (80%) than Asians (15%). In general, there is an even mix of both sexes in the dataset, except in the PDL1 group, where over 60% of the patients are male. Since more than half of the trials in the dataset are in the second-line setting or higher, the majority of the patients (65%) have undergone at least one regimen of chemotherapy prior to participation in these clinical trials.
2.2.2
Tumor Response Data
Tumor response is an important efficacy endpoint in cancer clinical trials, and one of the most commonly used. The use of tumor regression for evaluating cancer ther-apeutics is supported by multiple studies that demonstrate an association between solid tumor shrinkage and improved OS, or to other time-to-event measures, such as PFS [32]. It is typically employed as a secondary endpoint to complement survival data, but tumor response has been used as the primary surrogate endpoint in some single-arm trials to support the accelerated approval of breakthrough therapies and orphan drugs, together with the duration of response. An example is Osimertinib, which received accelerated approval in November 2015 based on an objective response
Table 2.1: Characteristics of clinical trials in the dataset. Abbreviations: Chemo, chemotherapy; R, randomized; OL, open-label; DB, double-blind; ITT, intention-to-treat population.
Therapy Treatment Therapy Control Design Phase Line ITT Initiation Cutoff
EGFR Gefitinib Chemo Docetaxel R, OL 3 2nd 1,466 Mar-04 Mar-07 EGFR Gefitinib Chemo Carboplatin
with paclitaxel
R, OL 3 1st 1,217 Mar-06 Apr-08 EGFR Erlotinib Chemo Pemetrexed
or docetaxel
R, OL 3 2nd 424 Apr-06 Aug-10 EGFR Erlotinib Chemo Docetaxel or
gemcitabine with cisplatin or carboplatin
R, OL 3 1st 173 Feb-07 Apr-12 EGFR Afatinib Placebo Best
supportive care
R, DB 2/3 3rd 585 Apr-08 Jun-10 EGFR Afatinib Chemo Pemetrexed
with cisplatin
R, OL 3 1st 345 Aug-09 Nov-13 ALK Crizotinib Chemo Pemetrexed
or docetaxel
R, OL 3 2nd 347 Sep-09 Aug-15 ALK Crizotinib Chemo Pemetrexed
with cisplatin or carboplatin
R, OL 3 1st 343 Jan-11 Nov-13 EGFR Erlotinib Chemo Gemcitabine
with cisplatin
R, OL 3 1st 217 Mar-11 Apr-14 EGFR Afatinib EGFR Erlotinib R, OL 3 2nd 795 Mar-12 Feb-15 PDL1 Nivolumab Chemo Docetaxel R, OL 3 2nd 272 Oct-12 Dec-14 PDL1 Nivolumab Chemo Docetaxel R, OL 3 2nd 582 Nov-12 Feb-15 ALK Ceritinib Chemo Pemetrexed
or docetaxel
R, OL 3 2nd 231 Jun-13 Jan-16 PDL1 Atezolizumab Chemo Docetaxel R, OL 2 2nd 287 Aug-13 Dec-15 PDL1 Pembrolizumab Chemo Docetaxel R, OL 2/3 2nd 1,033 Aug-13 Oct-15 ALK Alectinib ALK Crizotinib R, OL 3 1st 303 Aug-14 Feb-17 PDL1 Pembrolizumab Chemo
Platinum-based
R, OL 3 1st 305 Sep-14 May-16
Table 2.2: List of variables extracted from SDTM and ADaM databases.
Abbrevia-tions: APAC, Asia-Pacific; NAM, North America; WEUR, Western Europe; Adeno,
adenocarcinoma; SCC, squamous cell carcinoma; CR, complete response; PR, partial response; SD, stable disease; PD:, progressive disease; NE, not evaluable.
Type Variable Values
Demographics Age Years
Weight kg
Sex Male, female Race group Asian1, white, others
Region APAC, NAM, WEUR, others Medical history Time since diagnosis Days
Performance status2 0, 1, 2 or higher
Smoking status Ever, never Stage at screening IIIB or lower, IV Prior chemotherapy Yes, no
Histology Adeno, SCC, others3
Metastases in brain, bone, liver and others Yes, no Number of metastasis sites Count
Biomarker status in PDL1, EGFR and ALK4 Positive, negative, not tested
Number of baseline target lesions 1, 2, 3, 4, 5 or more Baseline SLD5 mm
Comorbidities in 23 system organ class levels6 Yes, no
Laboratory Alkaline phosphate High, normal, low measurements7 Alanine aminotransferase High, normal, low
Aspartate aminotransferase High, normal, low Bilirubin High, normal, low Creatine High, normal, low Hemoglobin High, normal, low Platelets count High, normal, low White blood cells count High, normal, low
Therapy type Therapy received Chemotherapy, PDL1 ICI, EGFR TKI, ALK TKI Endpoints Overall survival Days
Overall survival censor Yes, no Progression-free survival Days Progression-free survival censor Yes, no
Best overall response CR, PR, SD8, PD, NE
Objective response9 Yes, no Timepoint SLD mm Depth of response %
1Includes Pacific Islanders. 2Eastern Cooperative Oncology Group (ECOG) or World Health Organization (WHO)
score. 3Includes large cell carcinoma (LCC) and not otherwise specified (NOS).
4Patients are tested for at most one biomarker depending on the experimental arm of the the clinical trial they are
from: patients from PDL1 ICI trials are tested for PDL1 expression, EGFR TKI trials for EGFR-mutation, and ALK TKI trials for ALK-translocation. 5Measurements under RECIST version 1.0 are scaled to reconcile with version
1.1 (see AppendixA.1). 6As defined in the Medical Dictionary for Regulatory Activities (MedDRA). 7High, normal, low as determined by investigators on-site. 8Includes non-CR/non-PD.
Figure 2-1: Sample size of the dataset after filtering. We exclude patients who either (1) did not have tumor measurements in the database or had ambiguous records such as non-measurable disease, no target lesions, or 0 mm baseline SLD, (2) were on placebo (e.g., the placebo comparator arm in the third-line Afatinib trial), or were not treated by either chemotherapy, immunotherapy, or targeted therapy in the clinical trial before discontinuation, or (3) had missing features that are necessary for subsequent analyses (see Table 2.2). We randomly select 70% of the dataset as the development cohort and use the other 30% as the validation cohort (see Section2.3.2).
Table 2.3: Summary statistics of key baseline demographics and disease characteris-tics (categorical features) broken down by the type of therapy received.
Chemo PDL1 ICI EGFR TKI ALK TKI All (n=2,999) (n=1,323) (n=2,781) (n=702) (n=7,805)
Variable Group n % n % n % n % n %
Sex Male 1,518 50.6 807 61 1,526 54.9 308 43.9 4,159 53.3 Female 1,481 49.4 516 39 1,255 45.1 394 56.1 3,646 46.7 Race group Asian 1,215 40.5 204 15.4 1,398 50.3 303 43.2 3,120 40 White 1,715 57.2 1,061 80.2 1,330 47.8 383 54.6 4,489 57.5 Others 69 2.3 58 4.4 53 1.9 16 2.3 196 2.5 Region APAC 1,232 41.1 213 16.1 1,389 49.9 305 43.4 3,139 40.2 NAM 413 13.8 380 28.7 215 7.7 93 13.2 1,101 14.1 WEUR 870 29 500 37.8 743 26.7 213 30.3 2,326 29.8 Others 484 16.1 230 17.4 434 15.6 91 13 1,239 15.9 Performance status 0 957 31.9 421 31.8 770 27.7 359 51.1 2,507 32.1 1 1,839 61.3 900 68 1,807 65 301 42.9 4,847 62.1 2 or higher 203 6.8 2 0.2 204 7.3 42 6 451 5.8 Smoking status Ever 1,703 56.8 1,116 84.4 1,592 57.2 268 38.2 4,679 59.9 Never 1,296 43.2 207 15.6 1,189 42.8 434 61.8 3,126 40.1 Stage at screening IIIB or lower 363 12.1 107 8.1 400 14.4 16 2.3 886 11.4 IV 2,636 87.9 1,216 91.9 2,381 85.6 686 97.7 6,919 88.6 Prior chemotherapy Yes 1,844 61.5 1,159 87.6 1,812 65.2 258 36.8 5,073 65 No 1,155 38.5 164 12.4 969 34.8 444 63.2 2,732 35 Histology Adeno 2,210 73.7 800 60.5 1,662 59.8 660 94 5,332 68.3 SCC 476 15.9 343 25.9 935 33.6 6 0.9 1,760 22.5 Others 313 10.4 180 13.6 184 6.6 36 5.1 713 9.1 Metastasis Brain 313 10.4 150 11.3 178 6.4 254 36.2 895 11.5 Bone 864 28.8 394 29.8 665 23.9 283 40.3 2,206 28.3 Liver 610 20.3 287 21.7 460 16.5 187 26.6 1,544 19.8 Others 2,926 97.6 1,282 96.9 2,559 92 697 99.3 7,464 95.6 PDL1 expression Positive 431 14.4 591 44.7 0 0.0 0 0.0 1,022 13.1 Negative 418 13.9 656 49.6 0 0.0 0 0.0 1,074 13.8 Not tested 2,150 71.7 76 5.7 2,781 100 702 100.0 5,709 73.1 EGFR-mutation Positive 538 17.9 0 0.0 677 24.3 0 0.0 1,215 15.6 Negative 223 7.4 0 0.0 233 8.4 0 0.0 456 5.8 Not tested 2,238 74.6 1,323 100.0 1,871 67.3 702 100.0 6,134 78.6 ALK-translocation Positive 404 13.5 0 0.0 0 0.0 702 100.0 1,106 14.2 Negative 1 0.0 0 0.0 0 0.0 0 0.0 1 0.0 Not tested 2,594 86.5 1,323 100.0 2,781 100 0 0.0 6,698 85.8
Table 2.4: Summary statistics of key baseline demographics and disease characteris-tics (continuous features) broken down by the type of therapy received.
Median (min–max)
Variable Chemo PDL1 ICI EGFR TKI ALK TKI All
Age (years) 60 62 61 53 60 (19–85) (20–90) (24–88) (18–91) (18–91) Time since diagnosis (days) 164 312 183 87 201
(1–7,207) (21–11,068) (1–5,503) (11–4,734) (1–11,068) Baseline SLD (mm) 70 79 68 59 70
rate (ORR) endpoint for the treatment of patients with metastatic EGFR T790M mutation-positive NSCLC who had progressive disease following first-line EGFR TKI therapy.
We summarize the RECIST best overall response outcomes by the type of therapy received and the biomarker mutation status of the patient in Table 2.5. The ORR of patients under inhibitor therapy with the corresponding biomarker mutation (37% for PDL1 ICI, 45% for EGFR TKI, and 65% for ALK TKI) is more than twice as large as those with the same mutations but under chemotherapy (17%, 23%, and 29%). Patients with a negative biomarker status, but still treated with inhibitor therapy, have the worst outcomes. They exhibit progressive disease (PD) the most frequently (43-44%), and have the lowest ORR, even when compared with their counterparts in the chemotherapy group. On average, patients with an unknown EGFR-mutation status seem to respond better to chemotherapy (ORR 16%) than EGFR TKI (ORR 14%).
In Fig. 2-2, we show how the distributions of depth of response (DPR), defined as the maximum reduction in tumor burden with respect to the baseline SLD, differ among the four treatment groups. In these waterfall plots, we sort the DPR in descending order and plot it from left to right. Positive values represent growth, while negative values correspond to shrinkage. Note that having a DPR smaller than -30% does not always lead to an objective response, because the response may not be confirmed in subsequent readings. It is clear that patients under inhibitor therapy with the corresponding biomarker mutation experience a greater reduction in SLD. This is shown by the shift in the waterfalls to the left compared to subgroups with other mutations. Of the therapies, it seems that ALK TKI has the most aggressive anti-tumor activity. Almost all ALK-positive patients demonstrate some extent of tumor regression, and their ORR is substantially larger (65%) than the comparable values for PDL1 ICI and EGFR TKI.
Table 2.5: Summary statistics of best overall response broken down by the type of therapy received and biomarker mutation status.
CR PR SD PD NE ORR N n % n % n % n % n % n % Chemotherapy All 2,999 4 0.1 560 18.7 1,297 43.2 801 26.7 337 11.2 564 18.8 PDL1-positive 431 1 0.2 74 17.2 177 41.1 127 29.5 52 12.1 75 17.4 PDL1-negative 418 0 0 62 14.8 161 38.5 145 34.7 50 12 62 14.8 EGFR-positive 538 1 0.2 121 22.5 265 49.3 93 17.3 58 10.8 122 22.7 EGFR-negative 223 0 0 30 13.5 114 51.1 53 23.8 26 11.7 30 13.5 ALK-positive 404 2 0.5 115 28.5 138 34.2 122 30.2 27 6.7 117 29 ALK-negative 1 0 0 0 0 0 0 1 100 0 0 0 0 Not tested 984 0 0 158 16.1 442 44.9 260 26.4 124 12.6 158 16.1 PDL1 ICI All 1,323 11 0.8 306 23.1 397 30 490 37 119 9 317 24 PDL1-positive 591 9 1.5 211 35.7 159 26.9 167 28.3 45 7.6 220 37.2 PDL1-negative 656 1 0.2 83 12.7 213 32.5 292 44.5 67 10.2 84 12.8 Not tested 76 1 1.3 12 15.8 25 32.9 31 40.8 7 9.2 13 17.1 EGFR TKI All 2,781 8 0.3 575 20.7 1,027 36.9 858 30.9 313 11.3 583 21 EGFR-positive 677 5 0.7 300 44.3 216 31.9 112 16.5 44 6.5 305 45.1 EGFR-negative 233 0 0 26 11.2 81 34.8 101 43.3 25 10.7 26 11.2 Not tested 1,871 3 0.2 249 13.3 730 39 645 34.5 244 13 252 13.5 ALK TKI All 702 27 3.8 431 61.4 149 21.2 60 8.5 35 5 458 65.2 ALK-positive 702 27 3.8 431 61.4 149 21.2 60 8.5 35 5 458 65.2 ALK-negative 0 0 - 0 - 0 - 0 - 0 - 0 -Not tested 0 0 - 0 - 0 - 0 - 0 - 0 -Total 7,805 50 0.6 1,872 24.0 2,870 36.8 2,209 28.3 804 10.3 1,922 24.6
Figure 2-2: Waterfall plots of DPR broken down by the type of therapy received and biomarker mutation status. For example, the second plot on the first row shows the DPR of PDL1-positive patients under chemotherapy and the third plot on the second row shows the DPR of PDL1-negative patients under PDL1 ICI. Each vertical bar represents a single subject. Dashed horizontal line at -30% shows the RECIST threshold for response. We truncate the plots at +100% for better visualization. There are 27 patients who demonstrate tumor growth beyond this limit. We also exclude 774 patients that have only the baseline measurement in the database.
2.2.3
Longitudinal Tumor Size Data
In order to develop a continuous-time and continuous-SLD stochastic tumor growth model to incorporate into our predictive model, we use longitudinal tumor size data extracted from our dataset. This data consists of patient-level SLD measurements collected at clinical trial visits. Studies typically record three types of clinical trial visit, namely the baseline visit, the treatment visits, and the follow-up visits. We use timepoint measurements from all three types of visit in our analysis.
In Fig. 2-3, we show the distributions of key data characteristics broken down by the type of therapy received. In aggregate, the baseline SLDs (BSLDs) seem to follow a shifted log-normal distribution with a mode between 25–35 mm. Patients under chemotherapy and PDL1 ICI generally have larger BSLDs, with modes in the 45–55 mm and 45–65 mm ranges, respectively. In contrast, patients under ALK TKI have the smallest BSLDs on average, with a mode between 15–25 mm. In the dataset, about 10% of the patients completed only one visit, the screening visit. These patients withdrew from the trial after receiving the first dose, but before the first post-baseline tumor assessment visit. While the distributions for chemotherapy, PDL1 ICI and EGFR TKI are largely skewed to the left, that for ALK TKI is quite evenly spread out between 1–12 visits. In general, we rarely observe patients with more than ten visits. Visits are mostly scheduled at intervals of 5–6 weeks, although we observe a second peak for PDLI ICI and ALK TKI at about 9 weeks and 8 weeks, respectively.
We examine several case studies in Appendix A.2 to illustrate some of the sub-tleties present in the longitudinal SLD dataset. Apart from some straightforward cases, it is often difficult to glean the exact reasons for discontinuations in tumor assessment from the dataset. Nevertheless, it is clear that there is a discontinuation process at work that affects our observation of SLD measurements. For example, we are less likely to observe measurements after PD in SLD has occurred. This phe-nomenon is in inherent to the data collection process because of the patient safety protections designed into the clinical trials. In this chapter, we will develop a
proba-bilistic model for the discontinuation mechanism, and incorporate it into our tumor growth models.
2.2.4
Survival Data
Overall survival is the gold standard for efficacy endpoints in clinical trials. It is defined as the time from randomization in a clinical trial until death from any cause. While OS is universally recognized as a direct measure of clinical benefit, there are multiple limitations associated with its use. For ethical reasons, many trials allow patients in the control arm who experience progressive disease to receive the experi-mental therapy (i.e., crossovers). This makes it difficult to assess the impact of the new drug on OS. Moreover, large sample sizes and extended follow-ups are required to demonstrate statistical differences in OS between treatment arms [33]. In many cases, PFS is used as a surrogate endpoint for OS to support drug approvals. Similar to OS, PFS is defined as the time from randomization to tumor progression or death. However, PFS is more easily established because it requires a smaller sample size and a shorter follow-up time. In addition, PFS is free from the confounding effects of crossovers and post-trial therapies.
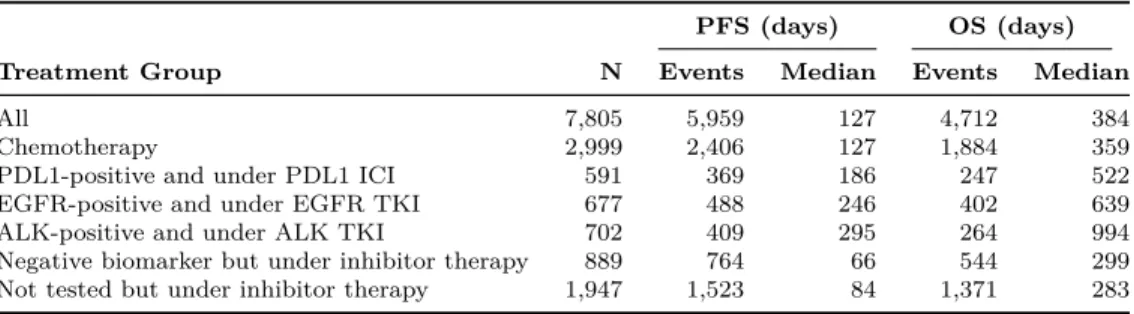
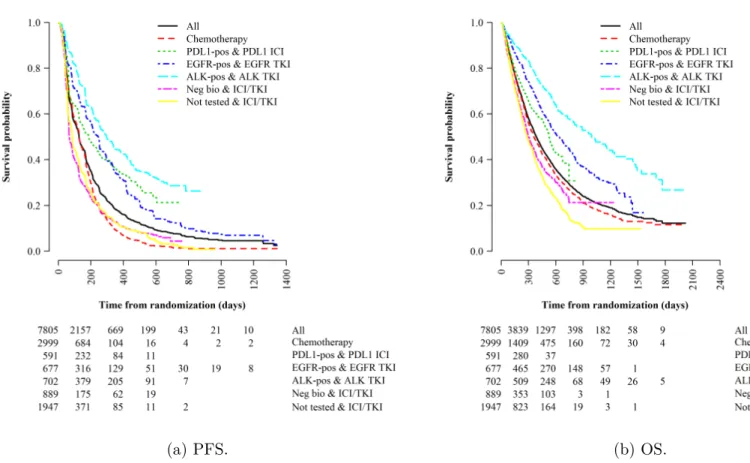
We extract both survival endpoints from our dataset, and summarize them in Table2.6 and Fig.2-4. The median PFS and OS in the dataset are 127 and 384 days, respectively. We observe PFS events in about 76% of the patients and OS events in about 60%. We categorize patients into six treatment groups and examine their survival outcomes, according to the type of therapy received and their biomarker mu-tation status: (1) any biomarker status and under chemotherapy, (2) PDL1-positive and under PDL1 ICI, (3) EGFR-positive and under EGFR TKI, (4) ALK-positive and under ALK TKI, (5) negative biomarker status but under inhibitor therapy (that is, either PDL1-negative but under PDL1 ICI or EGFR-negative but under EGFR TKI), and (6) not tested for any biomarkers but under inhibitor therapy (either PDL1 ICI or EGFR TKI). In Table2.6, we find that immunotherapy and targeted therapy offer PFS improvements for patients with positive biomarkers. These patients have a higher median survival compared to other treatment groups. The Kaplan-Meier
Figure 2-3: Distributions of key tumor size data characteristics broken down by the type of therapy received. The first column shows the BSLDs (scaled as described in Section 2.2), second the number of visits completed by each patient, and third the time intervals between two consecutive visits for all patients in the dataset. We truncate the BSLD at 215 mm, number of visits at 15, and time between visits at 102 days for better visualization. There are 113 patients with BSLD larger than 215 mm, 97 patients who completed more than 15 visits, and 139 pairs of consecutive visits that are apart by more than 102 days.
Table 2.6: Median PFS and OS broken down by treatment group.
PFS (days) OS (days)
Treatment Group N Events Median Events Median
All 7,805 5,959 127 4,712 384 Chemotherapy 2,999 2,406 127 1,884 359 PDL1-positive and under PDL1 ICI 591 369 186 247 522 EGFR-positive and under EGFR TKI 677 488 246 402 639 ALK-positive and under ALK TKI 702 409 295 264 994 Negative biomarker but under inhibitor therapy 889 764 66 544 299 Not tested but under inhibitor therapy 1,947 1,523 84 1,371 283
(a) PFS. (b) OS.
Figure 2-4: Kaplan-Meier survival curves broken down by treatment group.
2.3
Methods
2.3.1
Stochastic Model for Tumor Growth
We assume that net tumor growth in our dataset (that is, net of natural tumor growth and drug-induced regression) follows an exponential model. This is one of the most commonly used models in the literature to describe macroscopic tumor growth [34,35,36,37]. We make the rate constant a linear function of the treatment group (as defined in Section2.2.4), demographics, medical history, and laboratory test features in the dataset (see Table 2.2). This will allow us to identify the key factors driving tumor response. In addition, we incorporate additive Gaussian white noise into the rate constant to account for any randomness intrinsic to the tumor growth process, uncertainty in tumor measurements, or possible errors due to model misspecification.
d𝑌 (𝑡) =(︁𝜇 + 𝛽⊤𝑥 + 𝜎 𝜉(𝑡))︁𝑌 (𝑡) d𝑡 , 𝑌 (𝑡) , 𝜎 > 0 , 𝛽 , 𝑥 ∈ R𝑚
=(︁𝜇 + 𝛽⊤𝑥)︁𝑌 (𝑡) d𝑡 + 𝜎 𝑌 (𝑡) d𝑊 (𝑡) (2.1) where 𝑌 (𝑡) is the SLD measurement1 for some patient at time 𝑡, 𝑥 is the feature
vector for the patient with coefficients 𝛽, 𝑚 is the number of features, 𝜇 is the intercept constant, (𝜇 + 𝛽⊤𝑥) is the linear function for the net rate of tumor growth,
𝜎 𝜉(𝑡) is Gaussian white noise scaled by a positive constant 𝜎, and 𝑊 (𝑡) is the Wiener
process.
The resulting model in Eq. (2.1) is a stochastic differential equation that cor-responds to geometric Brownian motion. By applying Itô’s formula, we obtain an analytic solution (see Eq. (2.2)). Under the model, the tumor growth process is continuous and can only assume positive values. This agrees well with the physi-cal characteristics of lesions. Since Brownian motion is a Markov process, timepoint 1We add a small 𝜖 = 0.1 mm to cases where SLDs are observed to be 0. We assume that target
lesions do not disappear completely under complete response. Instead, they shrink to small sizes that are not easily discovered by the human eye through CT scans or X-ray imaging. We make this assumption so that all SLDs are strictly positive and the data fulfills the 𝑌 (𝑡) > 0 constraint in the model. It should make no material difference to our analysis, since the 𝜖 added is substantially smaller than the smallest non-zero SLD observed—1 mm—in the dataset.
transitions—the percentage changes in SLD from one visit to the next—are indepen-dent log-normal random variables (see Eq. (2.3)). In other words, tumor sizes in the future are independent of past measurements given the present state. The net rate of tumor growth here, (𝜇 + 𝛽⊤𝑥), is better known as drift in literature, and 𝜎 as
volatility. 𝑌 (𝑡) = 𝑌 (0) exp(︁(𝜇 + 𝛽⊤𝑥 −1 2𝜎 2) 𝑡 + 𝜎 𝑊 (𝑡))︁ (2.2) ln(︁𝑌 (𝑡 + ℎ) 𝑌 (𝑡) )︁ ∼ 𝒩(︁(𝜇 + 𝛽⊤𝑥 − 1 2𝜎 2) ℎ , 𝜎2ℎ)︁ (2.3)
where 𝑌 (0) is the BSLD, ℎ is the time interval between two visits.
As described earlier, patient discontinuation is a complex process that depends on a multitude of factors. At each visit, investigators decide whether or not to discontinue patients based on patient conduct and clinical condition. We propose to model the process as a sequence of Bernoulli trials where patients have a probability of being discontinued at each visit. This probability is conditioned on each individual’s target lesion response at the current assessment—that is, whether SLD indicates disease progression, one of the most important factors determining discontinuation— as derived from observed SLD measurements (see Eq. (2.4)). Patients who discontinue move to a state with a null measurement; patients who stay advance to the next visit.
𝐷(𝑡) | 𝑆(𝑡) = 𝑠(𝑡) ∼ Bernoulli(𝑃𝑠(𝑡)) , 𝐷(𝑡) ∈ {0 , 1} , 𝑆(𝑡) ∈ {PD , NPD} (2.4)
where 𝐷(𝑡) is the discontinuation decision at time 𝑡, 𝐷(𝑡) = 1 refers to discontinua-tion, 𝐷(𝑡) = 0 refers to continuadiscontinua-tion, 𝑆(𝑡) is the response status of target lesions at time 𝑡, and NPD refers to non-PD. We note that 𝑠(𝑡) is derived from all past SLDs including the current assessment at time 𝑡.
We combine the tumor growth and the patient discontinuation models to obtain the probability density function for our dataset (see Eq. (2.5)). The corresponding likelihood function is shown in Eq. (2.6). We can estimate parameters of both models jointly through maximum likelihood estimation. The set of features for considera-tion is large (see Table 2.2). Therefore, we employ the stepwise forward selection