Publisher’s version / Version de l'éditeur:
Vous avez des questions? Nous pouvons vous aider. Pour communiquer directement avec un auteur, consultez la première page de la revue dans laquelle son article a été publié afin de trouver ses coordonnées. Si vous n’arrivez pas à les repérer, communiquez avec nous à PublicationsArchive-ArchivesPublications@nrc-cnrc.gc.ca.
Questions? Contact the NRC Publications Archive team at
PublicationsArchive-ArchivesPublications@nrc-cnrc.gc.ca. If you wish to email the authors directly, please see the first page of the publication for their contact information.
https://publications-cnrc.canada.ca/fra/droits
L’accès à ce site Web et l’utilisation de son contenu sont assujettis aux conditions présentées dans le site LISEZ CES CONDITIONS ATTENTIVEMENT AVANT D’UTILISER CE SITE WEB.
8th International Conference on Short and Medium Span Bridges [Proceedings],
pp. 168-1-168-10, 2010-08-03
READ THESE TERMS AND CONDITIONS CAREFULLY BEFORE USING THIS WEBSITE. https://nrc-publications.canada.ca/eng/copyright
NRC Publications Archive Record / Notice des Archives des publications du CNRC :
https://nrc-publications.canada.ca/eng/view/object/?id=f2a10279-46cb-4917-83ce-5f1a8720b5ae https://publications-cnrc.canada.ca/fra/voir/objet/?id=f2a10279-46cb-4917-83ce-5f1a8720b5ae
NRC Publications Archive
Archives des publications du CNRC
This publication could be one of several versions: author’s original, accepted manuscript or the publisher’s version. / La version de cette publication peut être l’une des suivantes : la version prépublication de l’auteur, la version acceptée du manuscrit ou la version de l’éditeur.
Access and use of this website and the material on it are subject to the Terms and Conditions set forth at
Modelling RC bridge columns under the combined effects of traffic and
reinforcement corrosion
http://www.nrc-cnrc.gc.ca/irc
M ode lling RC bridge c olum ns unde r t he c om bine d e ffe c t s of t ra ffic
a nd re inforc e m e nt c orrosion
N R C C - 5 3 5 3 6
M o h a m m e d , A . M . ; A l m a n s o u r , H . ; M a r t i n
-P e r e z , B .
A u g u s t 2 0 1 0
A version of this document is published in / Une version de ce document se trouve dans:
8th International Conference on Short and Medium Span Bridges, Niagara Falls,
Ontario, Canada, August 3-6, 2010, pp. 168-1-168-10.
The material in this document is covered by the provisions of the Copyright Act, by Canadian laws, policies, regulations and international agreements. Such provisions serve to identify the information source and, in specific instances, to prohibit reproduction of materials without written permission. For more information visit http://laws.justice.gc.ca/en/showtdm/cs/C-42
Les renseignements dans ce document sont protégés par la Loi sur le droit d'auteur, par les lois, les politiques et les règlements du Canada et des accords internationaux. Ces dispositions permettent d'identifier la source de l'information et, dans certains cas, d'interdire la copie de documents sans permission écrite. Pour obtenir de plus amples renseignements : http://lois.justice.gc.ca/fr/showtdm/cs/C-42
Proceedings of 8th International Conference on Short and Medium Span Bridges
Niagara Falls, Canada 2010
MODELLING RC BRIDGE COLUMNS UNDER THE COMBINED
EFFECTS OF TRAFFIC AND REINFORCEMENT CORROSION
Amina M. MohammedUniversity of Ottawa, Canada
Husham H. Almansour
National Research Council Canada, Canada
Beatriz Martín-Pérez
University of Ottawa, Canada
ABSTRACT
Significant increase in strength and stiffness of construction materials in the past five decades has led to a considerable reduction of bridge elements size and weight, resulting in more slender bridge structures that could have inadequate dynamic characteristics. For slab-on-girder bridges, the bridge superstructure traffic-induced vibration is reduced through dampers and discontinuity in the superstructure/substructure joints before affecting the bridge substructure. However, significant level of traffic vibration is observed in the substructure. On the other hand, reinforced concrete (RC) bridge columns in cold regions are affected by chloride-induced reinforcement corrosion from the application of de-icing salts in the winter, and their serviceability and strength capacity can be reduced over time. This paper presents a numerical model of individual and compound effects of traffic and corrosion-induced damage in RC bridge columns on the dynamic performance of the bridge superstructure. The procedure includes two time-dependent cycles presenting each process: an external cycle, which represents the corrosion process, and an internal cycle, which performs time-history analysis of the bridge under traffic load. The slab-on-girder bridge is modelled as a beam-on-two-columns system (BOTC) using a two-dimensional finite element method, and the truck is modelled as a two-degree of freedom dynamic system integrated with the bridge model. Corrosion-induced damage is introduced through the reduction of the reinforcing steel area and spalling of the concrete cover. It is found that the model is efficient in simulating the static and dynamic behaviour of slab-on-girder bridges. From the case study, it is found that although reinforcement corrosion of the bridge columns significantly reduces their capacity, it only causes a marginal increase in the bridge superstructure dynamic deflection under the dynamic movement of the truck.
1. INTRODUCTION
Significant increase in strength and stiffness of construction materials in the past five decades has led to a considerable reduction of bridge elements size and weight, resulting in more slender bridge structures that have vulnerable dynamic characteristics. Furthermore, heavier and faster trucks are now standardized, and the average number of trucks passing bridges has dramatically increased. For the design and/or assessment of a bridge structure, it is imperative to evaluate its dynamic behaviour as well as the combined effect and/or interaction between traffic-induced vibration and environmental loads. In fact, the vibration response of a structure is increasingly being used as a means to detect and characterize damage in the structure. On the other hand, RC bridge columns in cold regions are affected by chloride-induced reinforcement corrosion, generated mainly from the application of de-icing salts in the winter, and their serviceability and strength capacity can be reduced over time.
Simply supported slab-on-girder bridges are the most popular type of bridges in North America. The redundancy of this bridge type depends on the number of girders and the stability of its substructure. Although the traffic-induced vibration is reduced through dampers and simply supports connections before affecting the bridge substructure, a
significant level of traffic vibration is observed in the substructure. The dynamic response of a bridge subjected to moving loads is a very complex phenomenon and has been widely considered. For instance, many analytical models have been proposed to ensure better understanding of the dynamic effects of the bridge-vehicle interactions. The studies by Lin and Trethewey (1990), Law and Zhu (2004), Asnachinda et al. (2008), and Zambrano et al. (2008) have focused on developing analytical solutions for simply supported and continuous beams with uniform cross section subjected to a moving load. In order to obtain the dynamic response for both the moving dynamic system and the bridge, the governing equations for the interaction between the bridge system and the moving dynamic system were derived. However, the bridge system was represented by only the superstructure, while the substructure was omitted.
Field surveys have shown that RC bridge columns in cold climates are among the bridge elements with highest exposure to chlorides (Andersen 1997). Reinforcement corrosion is a continuous long-term process, leading to reduction in cross sectional area of the affected steel bars and loss of concrete section as a result of longitudinal cracking and spalling. Hence, reinforcement corrosion may cause significant changes in the bridge capacity and safety. A comprehensive study on RC columns subjected to reinforcement corrosion was performed by Rodríguez et al. (1996), in which the effects of steel corrosion on the RC column behaviour were evaluated experimentally. The authors observed that reinforcement corrosion not only reduced the axial capacity of the columns, but it also introduced a load eccentricity due to spalling of the concrete cover and led to buckling of the longitudinal reinforcement due to premature loss of one or more columns ties.
The goal of this paper is to present a numerical model that combines the effects of traffic and corrosion of the columns of slab-on-girder bridges on the structural performance of the bridge superstructure. A simply supported slab-on-girder bridge is modelled as a two-dimensional frame consisting of a beam supported on two columns with a hinge beam-column joint in one of the beam sides and a roller on the other side. The truck load is modelled as a two-degree of freedom dynamic system. Corrosion-induced damage is introduced through the reduction of the reinforcement steel area and the column concrete section.
2. RESEARCH SIGNIFICANCE
This paper presents a numerical model for slab-on-girder bridge columns under the combined effects of two processes, traffic load and reinforcement corrosion. The contribution of this study includes the development of a comprehensive tool to evaluate the structural performance of slab-on-girder bridge superstructures when the bridge columns are under the combined effect of the two processes. This enables the understanding of the many aspects of the progressive damage due to the combined effects of reinforcement corrosion and traffic loads. The model can also be used to study the effect of each load (traffic or corrosion) alone, and the combined effect of both loads, on the static and dynamic behaviour of the bridges under service loads. This paper presents part of on-going research, where the non-linear elasto-plastic behaviour of the bridge under extreme loading conditions (ULS) is under development.
3. MODELLING THE BRIDGE STRUCTURE, TRAFFIC AND CORROSION LOADS
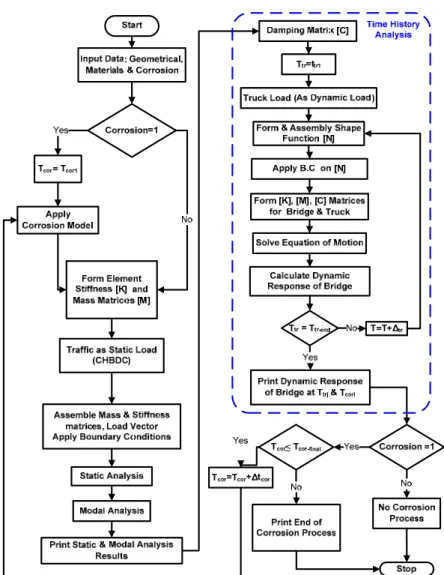
Figure 1 shows a flowchart of the proposed model. The model involves five major parts: (i) input data; (ii) formulation of structure and load matrices; (iii) static and dynamic analysis; (iv) corrosion process; and, (v) combined load results. The procedure includes two time-dependent cycles representing each process: (a) an external cycle, which represents the corrosion process and is activated once the corrosion activation parameter is equal to 1 (or Corrosion = 1 in the input data); (b) an internal cycle, which performs time-history analysis of the bridge under traffic load. The external or corrosion cycle starts running at time (Tcor1) and ends at time (Tcor-final) with time
increment of (∆tcor). During every corrosion time inclement, a time-history analysis of the bridge is performed.
The procedure commences with the input data of: (i) the structure, which includes its geometrical and material characteristics and boundary conditions; (ii) the traffic load; and (ii) the corrosion parameters. The results for the bridge performance are printed with reference to both processes time increments.
Figure 1. Proposed model for combined effects of traffic and corrosion loads.
3.1 Modelling the Bridge Structure and Traffic Load
A two-dimensional bridge system under a moving vehicle is modelled as a static and dynamic system using the direct stiffness method. Three types of analyses are carried out on the proposed model: (i) static analysis, wherein the traffic load is defined by a static truck load positioned to induce maximum static response; (ii) free vibration analysis; and (iii) forced vibration analysis, or time-history analysis. This enables evaluating the effects of the current deterioration of bridge concrete columns on the dynamic performance of the bridge superstructure compared to its dynamic performance right after construction. Furthermore, studying the dynamic behaviour of the bridge could lead to identify a critical ratio of the superstructure stiffness to the substructure (columns) stiffness, wherein the vibration is significant and cannot be ignored in evaluating the combined effects of traffic and corrosion loads.
3.1.1 Bridge Model
A typical slab-on-girder bridge is simply supported on columns or abutments. Since the focus of this study is on the behaviour of bridge columns, hence it is essential to model both the superstructure and substructure as one structural system. The model is required to effectively simulate the connection between the two parts. Since the load distribution, and hence the stress distribution, in the lateral direction (orthogonal to the traffic direction) is lightly affecting the bridge column behaviour, the bridge is modelled as a two-dimensional frame. The frame in this model is basically formed from a beam, representing the superstructure, and two columns. The connections between the
beam and the columns are represented by an internal hinge on one side and a roller on the other side. The model also accounts for possible eccentricity in both connections. The base of the two columns is assumed fully fixed.
For the purpose of calculating the beam properties such as structural rigidity, which are equivalent to the properties of the slab-on-girder superstructure, the slab is assumed to be compositely connected to the girders. In the present model, the lateral slab flexural action and the girders tensional rigidities are ignored. The columns are considered as a composite section for the essential step of including the effect of reinforcement steel loss when the corrosion model is applied. Both the composite beam and the columns are introduced as a 2D finite frame element with three degrees of freedom for each node. Self weight of the bridge elements is evaluated as a uniform load. The damping matrix is derived assuming a linear relation between damping of the bridge elements and their mass and stiffness.
The internal beam-column joints (connections) are to be considered as follows:
1. Hinge: (i) continuity in the vertical displacement V, i.e. beam and column have the same V; (ii) continuity in the horizontal displacement; (iii) discontinuity in the rotations, i.e. beam and column have independent rotations, or θbeam ≠ θcolumn. .
2. Roller: (i) continuity in the vertical displacement; (ii) discontinuity in the horizontal displacement, or Ubeam ≠ Ucolumn; (iii) discontinuity in the rotations, or θbeam ≠ θcolumn.
3.1.2 Vehicle Model
The vehicle is modelled as a two degree of freedom: vertical displacement (y) and rotation (θ) as shown in Figure 2. It is assumed that the two axles of the vehicle remain in contact with the surface of the bridge superstructure. Only vertical vibration is considered. The force load of the vehicle-bridge system is considered as a point load moving along the bridge. The governing equations of the moving dynamic system and the bridge are presented in Lin and Trethewey (1990).
Figure 2. Vehicle model (adopted from Lin and Trethewey, 1990).
3.1.3 Dynamic Bridge System
[1] 2 2 .. . T T i yi i i i 1 i 1 2 2 n .. . i 1 1 i i i i 1 i 1 i 1 .. . 2 i i 1 2 i i i i i i i i 1 [M] [N ] f [N ] f {d} [C] {0} {0} {d} [0] m 0 {y} c [N ] c ( 1) c b {y} [0] 0 I { ) { } ( 1) b c [N ] ( 1) c b c b θ = = + = = = θ + = ⎡ ⎤ ⎡ ⎤ ⎧ ⎫ ⎢ ⎥⎧ ⎢ ⎥ ⎪ ⎪ ⎢ ⎥⎪ ⎢ ⎥ ⎪ ⎪ ⎢ ⎥ + − − ⎢ ⎥ ⎨ ⎬ ⎢ ⎥⎨ ⎢ ⎥ ⎪ ⎪ ⎢ ⎥ ⎢ ⎥ ⎪ ⎪θ ⎢ ⎥ θ ⎢ ⎥⎩ ⎭ ⎢ − − ⎥ ⎣ ⎦ ⎣ ⎦
∑
∑
∑
∑
∑
∑
∑
∑
2 T i i 1 2 . 2 n i 1 i i x i i i i i i 1 i 1 i 1 1 2 . i i 1 2 i i i x i i i i i i i i 1 [N] f [K] {0} {0} {d} ( c x[N ] k [N ]) k ( 1) k b {y} 0 { } d F(t) ( 1) (b c x[N ] b k [N ]) ( 1) k b k b = + = = = + = ⎫ i i ⎪ ⎪ ⎪ ⎬ ⎪ ⎪ ⎪ ⎪ ⎩ ⎭ ⎡ ⎤ ⎧ ⎫ ⎢ ⎥ ⎪ ⎪ ⎢ ⎥ ⎧ ⎫ ⎪ ⎪ ⎢ ⎥ ⎪ ⎪ ⎪ ⎪ +⎢ − − − ⎥⎨ ⎬ ⎨= ⎬ ⎪ ⎪ ⎪ ⎪ ⎢ ⎥ θ⎩ ⎭ ⎪ ⎪ ⎢ ⎥ − + − ⎪ ⎪ ⎢ ⎥ ⎩ ⎭ ⎣ ⎦∑
∑
∑
∑
∑
∑
∑
where [M], [K], [C] are the structural mass, stiffness, and damping matrices of the bridge, d&&, , d are the nodal acceleration, velocity and displacement vectors, respectively, fi is the magnitude of a concentrated force, [N] is the
shape function, m1, ki, ci are the spring mass, stiffness, and damping of an axle of the moving system, y&&, , y are
the vertical displacement, velocity and acceleration of the spring mass, and bi is the vehicle axle position from its
center of gravity.
d&
y&
In order to check the performance of the proposed model, the vehicle model is first integrated with the bridge superstructure (as originally proposed by Lin and Trethewey, 1990), and then it is integrated with the proposed beam-and-columns system. The combined equations of the vehicle–bridge system as given by Eq. 1 is solved by the step-by-step integration method, and the dynamic response of the bridge under the moving vehicle is expressed as a function of the transverse displacement of the structure w(x,t), i.e., w = [N]{d}.
3.2 Modeling the Corrosion Load
The effect of reinforcement corrosion is modelled here by reducing the rebar cross-sectional area over time. The change in the RC elements sectional properties (area and moment of inertia) leads to a variation of their stiffness matrices. The loss of reinforcing steel due to corrosion is evaluated by applying Faraday’s law, from which the thickness reduction x(t) of the reinforcing bar after time t can be calculated according to Eq. 2:
[2] corr s M x(t) i t zF = ⋅ ρ ⋅
where M is the metal molar mass (55.85 g/mol for iron), z is the valence of the ion formed as a result of iron oxidation (i.e., z = 2 for Fe → Fe2+ + 2e-), F is Faraday’s constant (F = 96,485 C/mol), ρs is the density of iron (ρs =
7.85 g/cm3), icorr is the corrosion current density, and t is the time elapsed since corrosion started. By substituting the
values of M, z, F and ρs into Eq. 2, the rate of thickness reduction results in x(t) = 0.0116·icorr·t, where x(t) is given in
mm, icorr is given in μA/cm2, and t is given in years. The depth of the corrosive penetration attack p(t) is calculated
from:
[3] p(t)= ⋅R x(t)= ⋅R 0.0116 i⋅ corr⋅ t
where R is the ratio between the maximum penetration of a pit pmax and average penetration pav corresponding to
uniform corrosion. Parameter R is also known as the pitting ratio. Val (2007) has reported that the maximum penetration of pitting on the surface of a rebar is about 4-8 times the average penetration corresponding to uniform corrosion. Assuming that the pit can be idealized as a hemisphere, as illustrated in Figure 3, the cross-sectional area As of a group of n reinforcing bars after t years of corrosion can be estimated as:
[4] 2 n o s p,i i 1 D A (t) n A (t) 0.0 4 = π = −
∑
≥where Do is the initial reinforcing bar diameter and Ap,i(t) is the cross-sectional area of a pit after time t, which is a
function of p(t) and calculated according to Val (2007).
Figure3. Pit configuration (adapted from Val, 2007).
4. CASE STUDY
The proposed model as illustrated in Figure 1 is validated through a case study of a steel and a slab-on-prestressed concrete girder bridges with center to center span of 20 m. Both bridges are simply-supported on RC piers formed from five rectangular 600×350 mm2 columns, connected from the top to a beam where the bridge superstructure girders rest on. The 6-m height columns are assumed to have full fixity at the foundation level. The bridges superstructure consists of a concrete slab compositely casted on steel or prestressed concrete girders as shown in Table 1. The two bridges are assumed to have been built in the early sixties, and the concrete compressive strength f’c for all the concrete components of both bridges is assumed 30 MPa. Details of the slab thickness, girder
geometrical properties, girder spacing, bridge width and number of girders are given in Table 1. The present case study involves performing different static and dynamic loading cases using a two-axle truck of a total mass of 34.4×10³ kg, where the body mass is 30,189 kg, the front axle mass is 2,806 kg, and the rear axle mass is 1,403 kg. The truck mass moment of inertia is 263,052 kg·m2, the stiffness of each axle is 5,363,163 N/m and the axle spacing is 6.19 m (Ali 1999). Since the proposed model is a two-dimensional model and the variation through the bridge width perpendicular to the traffic direction is ignored, the reported results, stiffness, mass, and damping are average values per traffic lane.
4.1 Convergence Study
To verify the validity of the proposed model under static and traffic loads, it is necessary to ensure the correct implementation of the internal hinge and roller at the beam-column joints. Depending on the column stiffness, the deformations of the columns add more deformations to the top beam (or the superstructure) in the BOTC frame compared to the case of a simply-supported beam. The static analysis is performed using a two-axle truck load by considering two cases: (i) a simply-supported beam (SSB); and (ii) the proposed beam on a two-column system (BOTC). Figure 4 shows that BOTC gives slightly higher deflection than SSB as expected.
Table 1: General properties of two bridges, slab-on-steel girder and slab-on-prestressed girder bridges.
Type of girder Year Built Skew Angel º Span Length m Girder Spacing m
Girder Properties Transverse width m Slab Thick m No. of Girders A m2 I m4 H m Steel 1965 0.0 20.0 2.69 0.0303 0.00405 0.915 17.69 0.2159 7 Prestressed 1963 0.0 20.0 2.08 0.333 0.0571 1.4213 14.03 0.165 7
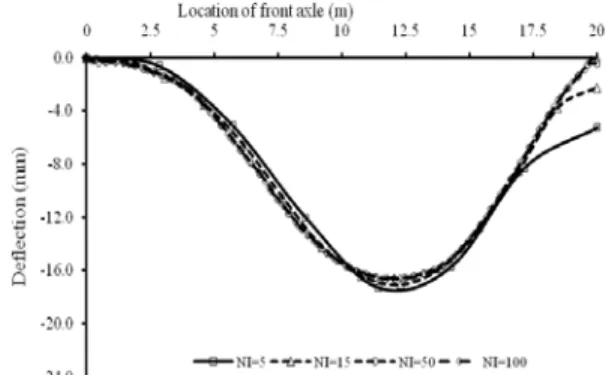
The dynamic analysis part of the proposed model is examined by two convergence studies. For both convergence studies, the truck speed is equal to 100 km/h. In the first convergence study, the number of element is assumed fixed (NE = 40), and the number of integration points, NI, varies from 5 to 100. Figure 5 shows the dynamic deflection under the front axle of the truck along the bridge span for different NI. It is found that after NI = 24, the change in the deflection becomes negligible. In the second convergence study, the number of integration points is constant (NI = 50) and the number of elements is varied from 4 to 40. It is found that after NE = 16 the results becomes stable and the change in the dynamic deflection due to the increase in the number of elements is negligible (see Figure 6).
Figure 4. Mid-span deflection of BOTC compared to SSB under truck load.
Figure 5. Convergence study 1: number of elements NE = 40 and truck speed = 100 km/h for different number of
integration points (NI).
Figure 6. Convergence study 2: number of integration points NI = 50 and truck speed = 100 km/h for different number of elements (NE).
4.2 Dynamic Deformations for Different Truck Speeds
Figure 7 shows the dynamic deflections of the bridge superstructure under the truck axles when the truck crosses the bridge (slab-on-steel girders) at the typical design speed of 100km/h. The proposed model accurately shows the entry and the exit of each of the truck axles and the range where the maximum deflection is expected. Figure 8 shows the dynamic deflection of the slab-on-steel girders bridge superstructure under the front axle for different truck speeds compared to the static deflection. In this comparison, the static deflection is calculated under the front axle, and the truck location is changed successively while the deflection is calculated for every position on the bridge superstructure from the static equilibrium. The dynamic deflection curve is very close to the static deflection when the truck speed is low, and the dynamic deflection increases as the truck speed increases. The impact factors
are calculated from the ratio of the maximum dynamic deflection to the maximum static deflection, which range between 1.07 to 1.23 as shown in Table 2.
Figure 7. Dynamic deflection of BOTC under front and rear axles for a truck speed =100 km/h.
Figure 8. Dynamic deflection of BOTC under front axle for different truck speeds.
Table 2: Impact factors under two-axles moving truck. Velocity (km/h) Impact Factor
20 1.067 40 1.147 80 1.097 100 1.180 120 1.229
4.3 Bridge Structure under Combined Traffic and Corrosion Loads
The behaviour of the bridge structure under combined traffic and corrosion loads is studied here. Corrosion-induced damage is simulated by assuming a steel mass loss of 30%, which is equivalent to 10 years of corrosion with a corrosion current density of 1µA/cm², and by assuming that the concrete cover of the columns has spalled out. For the two-axle truck moving over the bridge at a speed of 40 km/h, Figure 9 shows a very small increase in the dynamic deflection due to the reduction in steel area and spalling of the concrete cover from two sides of the RC bridge columns.
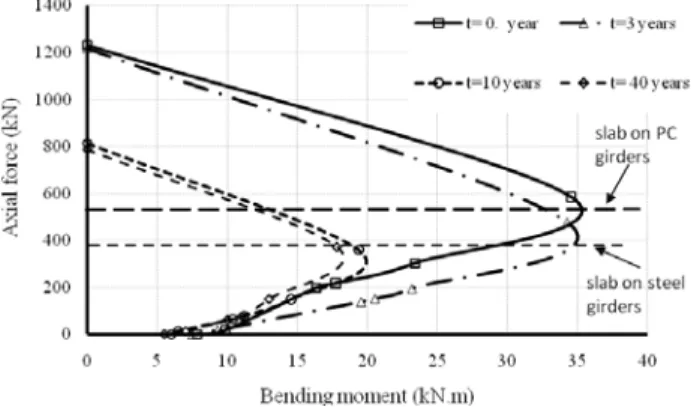
For a longer period of the corrosion process, say for 40 years, the reduction in reinforcing steel area could reach significant levels (assuming no maintenance is taken place). This would result in a large reduction of the column capacity. Figure 10 shows the interaction diagram of one column of the bridge pier, where 40 years of corrosion results in significant reduction of the capacity. If the column capacity is compared to the un-factored loads on the column, which are 536 kN for the slab on prestressed concrete girders and 382 kN for the slab on steel girders, it is clear that the safety margin is significantly decreased.
If all these effects are combined, then the influence of the corrosion process on the column ultimate axial capacity is significant. However, in the elastic range of the column load-deformation relationships, the only parameters affecting the deformation are the load level, the cross sectional properties (area and moment of inertia) and the modulus of elasticity. Since the ratio of the steel area to the column cross-sectional area and ratio of the concrete cover to the column cross-sectional area are small, then their losses are marginally affecting the deformations in the elastic range. In the present case study, it is clear that the change in the dynamic deflection of the bridge superstructure due to the corrosion of the column reinforcement is not enough to be an indication of the significant reduction of the pier capacity.
4.4 Effect of Girder Material on Dynamic Deflection of Bridge Superstructure
For the investigated bridge span of 20 m, Figure 11 shows that a significant difference in the superstructure dynamic deflections is observed when the steel girders are replaced by pre-stressed concrete girders. In this case study, the slab-on-steel girder bridge has less stiffness and mass per lane for the same span length. The corrosion of the longitudinal reinforcement and the concrete cover losses of the bridge columns have marginal effect on the dynamic deflections of the bridge superstructure. Further investigation is needed to evaluate the effect of different values of the superstructure and the column stiffness on the dynamic deflection of the bridge superstructure under the combined traffic and corrosion loads. This can be achieved by using high strength materials, longer bridge span, and larger girder spacing.
Figure 9. Comparison of dynamic deflections of superstructure under traffic load only and combined traffic and corrosion loads (steel girders).
Figure 10. Interaction diagram for RC bridge column at different corrosion stages.
Figure 11. Comparison of dynamic deflections of superstructure under traffic load only and under combined traffic and corrosion loads for slab on steel and prestressed concrete girders.
5. SUMMARY AND CONCLUSIONS
In this paper a numerical model of individual and compound effects of traffic and corrosion-induced damage of RC bridge columns on the performance of the bridge superstructure is introduced. The procedure includes two time-dependent cycles representing the two time-time-dependent processes: (i) external cycle, which represents the corrosion process; and (b) internal cycle, which performs time history analysis of the bridge under traffic load. The slab-on-girder bridge type is modelled as a beam on a two-column system using two dimensional finite element method, and the truck is modelled as a two degree of freedom dynamic system integrated with the bridge model. Corrosion-induced damage is introduced through the reduction of the reinforcing steel area and spalling of the concrete cover. The model is implemented into a computer program and the validation and a case study is performed.
The individual and compound effects of traffic and corrosion loads have been investigated on a 20-m slab-on-steel and concrete girder bridge on concrete piers (columns) through: (i) static load of the two axle truck; (ii) different truck speeds and girder materials; and, (iii) different levels of corrosion.
It is found that the model is efficient in simulating the static and dynamic behaviour of slab-on-girder bridges. It is capable of capturing all the combined effects of the traffic load and the reinforcement corrosion on the bridge dynamic deformations. From the case study, it is found that the corrosion of the bridge columns results in marginal increase in the bridge superstructure dynamic deflection under truck dynamic movement, even though it results in significant reduction in the column capacity. The results highlight that the assessment of the dynamic behaviour of the bridge superstructure due to corrosion-induced damage in the RC columns is not indicative of the reduction in the columns capacity.
6. FUTURE WORK
Thorough investigations are to be performed to evaluate the effects of the superstructure stiffness, span length of bridge superstructure, column dimensions, and different levels of corrosion intensity on the static and dynamic performance of the bridge column. This would lead to identify and quantify a critical ratio of the superstructure stiffness to the substructure (column) stiffness, wherein the vibration is significant and cannot be ignored in evaluating the compound or coupling effects of traffic and corrosion on RC bridge columns behaviour.
7. ACKNOWLEDGEMENTS
The financial support provided by The Libyan General Public Committee of Higher Education is gratefully appreciated.
8. REFERENCES
Ali, A. 1999. Dynamic Analysis of Bridges Using the Finite Element Strips Method. Ph.D. Thesis, Dept. of Civil Engineering, University of Ottawa, Ottawa, 213 pages.
Andersen, A. 1997. HETEK, Investigation of Chloride Penetration into Bridge Columns Exposed to De-Icing Salt. Copenhagen, Denmark.
Asnachinda P., Pinkaew T. and Laman J.A. 2008. Multiple Vehicle Axle Load Identification From Continuous Bridge Bending Moment Response. Engineering Structures, 30(10): 2800-2817.
Law, S. and Zhu, X. 2004. Dynamic Behaviour of Damaged Concrete Bridge Structures Under Moving Vehicular Loads. Engineering Structures, 26(9): 1279-1293.
Lin, Y.H. and Trethewey, M.W. 1990. Finite Element Analysis of Elastic Beams Subjected to Moving Dynamic Loads. Journal of Sound and Vibration, 136(2): 323-342.
Rodríguez, J., Ortega, L. M. and Casal, J. (1996). Load Bearing Capacity of Concrete Columns with Corroded Reinforcement. Corrosion of Reinforcement in Concrete Construction, Royal Society of Chemistry: 220-230. Val, D.V. 2007. Deterioration of Strength of RC Beams Due to Corrosion and its Influence on Beam Reliability.
Journal of Structural Engineering, 133(9): 1297-1306.
Zambrano, A., Rauci, M. and Malngone, P. (2008). Vehicle-Structure Interaction to Analyse the Primary Dynamic Aspects of Railway Bridges. Structure and Infrastructure Engineering, 4(2): 107-121.