arXiv:1001.1900v2 [hep-ex] 4 Oct 2010
Dependence of the t¯
t production cross section on the
transverse momentum of the top quark
V.M. Abazov37, B. Abbott75, M. Abolins64, B.S. Acharya30, M. Adams50, T. Adams48, E. Aguilo6, G.D. Alexeev37, G. Alkhazov41, A. Alton64,a, G. Alverson62, G.A. Alves2, L.S. Ancu36, M. Aoki49, Y. Arnoud14, M. Arov59, A. Askew48, B. ˚Asman42, O. Atramentov67, C. Avila8, J. BackusMayes82, F. Badaud13, L. Bagby49, B. Baldin49,
D.V. Bandurin58, S. Banerjee30, E. Barberis62, A.-F. Barfuss15, P. Baringer57, J. Barreto2, J.F. Bartlett49, U. Bassler18, D. Bauer44, S. Beale6, A. Bean57, M. Begalli3, M. Begel73, C. Belanger-Champagne42, L. Bellantoni49,
J.A. Benitez64, S.B. Beri28, G. Bernardi17, R. Bernhard23, I. Bertram43, M. Besan¸con18, R. Beuselinck44, V.A. Bezzubov40, P.C. Bhat49, V. Bhatnagar28, G. Blazey51, S. Blessing48, K. Bloom66, A. Boehnlein49, D. Boline61, T.A. Bolton58, E.E. Boos39, G. Borissov43, T. Bose61, A. Brandt78, R. Brock64, G. Brooijmans70, A. Bross49, D. Brown19, X.B. Bu7, D. Buchholz52, M. Buehler81, V. Buescher25, V. Bunichev39, S. Burdin43,b, T.H. Burnett82, C.P. Buszello44, P. Calfayan26, B. Calpas15, S. Calvet16, E. Camacho-P´erez34, J. Cammin71, M.A. Carrasco-Lizarraga34, E. Carrera48, B.C.K. Casey49, H. Castilla-Valdez34, S. Chakrabarti72, D. Chakraborty51, K.M. Chan55, A. Chandra53, E. Cheu46, S. Chevalier-Th´ery18, D.K. Cho61, S.W. Cho32, S. Choi33, B. Choudhary29,
T. Christoudias44, S. Cihangir49, D. Claes66, J. Clutter57, M. Cooke49, W.E. Cooper49, M. Corcoran80, F. Couderc18, M.-C. Cousinou15, D. Cutts77, M. ´Cwiok31, A. Das46, G. Davies44, K. De78, S.J. de Jong36, E. De La Cruz-Burelo34, K. DeVaughan66, F. D´eliot18, M. Demarteau49, R. Demina71, D. Denisov49, S.P. Denisov40,
S. Desai49, H.T. Diehl49, M. Diesburg49, A. Dominguez66, T. Dorland82, A. Dubey29, L.V. Dudko39, L. Duflot16, D. Duggan67, A. Duperrin15, S. Dutt28, A. Dyshkant51, M. Eads66, D. Edmunds64, J. Ellison47, V.D. Elvira49,
Y. Enari17, S. Eno60, H. Evans53, A. Evdokimov73, V.N. Evdokimov40, G. Facini62, A.V. Ferapontov77, T. Ferbel61,71, F. Fiedler25, F. Filthaut36, W. Fisher64, H.E. Fisk49, M. Fortner51, H. Fox43, S. Fuess49, T. Gadfort73, C.F. Galea36, A. Garcia-Bellido71, V. Gavrilov38, P. Gay13, W. Geist19, W. Geng15,64, D. Gerbaudo68,
C.E. Gerber50, Y. Gershtein67, D. Gillberg6, G. Ginther49,71, G. Golovanov37, B. G´omez8, A. Goussiou82, P.D. Grannis72, S. Greder19, H. Greenlee49, Z.D. Greenwood59, E.M. Gregores4, G. Grenier20, Ph. Gris13, J.-F. Grivaz16, A. Grohsjean18, S. Gr¨unendahl49, M.W. Gr¨unewald31, F. Guo72, J. Guo72, G. Gutierrez49, P. Gutierrez75, A. Haas70,c, P. Haefner26, S. Hagopian48, J. Haley62, I. Hall64, L. Han7, K. Harder45, A. Harel71,
J.M. Hauptman56, J. Hays44, T. Hebbeker21, D. Hedin51, J.G. Hegeman35, A.P. Heinson47, U. Heintz77, C. Hensel24, I. Heredia-De La Cruz34, K. Herner63, G. Hesketh62, M.D. Hildreth55, R. Hirosky81, T. Hoang48,
J.D. Hobbs72, B. Hoeneisen12, M. Hohlfeld25, S. Hossain75, P. Houben35, Y. Hu72, Z. Hubacek10, N. Huske17, V. Hynek10, I. Iashvili69, R. Illingworth49, A.S. Ito49, S. Jabeen61, M. Jaffr´e16, S. Jain69, D. Jamin15, R. Jesik44, K. Johns46, C. Johnson70, M. Johnson49, D. Johnston66, A. Jonckheere49, P. Jonsson44, A. Juste49,d, E. Kajfasz15,
D. Karmanov39, P.A. Kasper49, I. Katsanos66, V. Kaushik78, R. Kehoe79, S. Kermiche15, N. Khalatyan49, A. Khanov76, A. Kharchilava69, Y.N. Kharzheev37, D. Khatidze77, M.H. Kirby52, M. Kirsch21, J.M. Kohli28,
A.V. Kozelov40, J. Kraus64, A. Kumar69, A. Kupco11, T. Kurˇca20, V.A. Kuzmin39, J. Kvita9, D. Lam55, S. Lammers53, G. Landsberg77, P. Lebrun20, H.S. Lee32, W.M. Lee49, A. Leflat39, J. Lellouch17, L. Li47, Q.Z. Li49, S.M. Lietti5, J.K. Lim32, D. Lincoln49, J. Linnemann64, V.V. Lipaev40, R. Lipton49, Y. Liu7, Z. Liu6,
A. Lobodenko41, M. Lokajicek11, P. Love43, H.J. Lubatti82, R. Luna-Garcia34,e, A.L. Lyon49, A.K.A. Maciel2, D. Mackin80, P. M¨attig27, R. Maga˜na-Villalba34, P.K. Mal46, S. Malik66, V.L. Malyshev37, Y. Maravin58, J. Mart´ınez-Ortega34, R. McCarthy72, C.L. McGivern57, M.M. Meijer36, A. Melnitchouk65, L. Mendoza8, D. Menezes51, P.G. Mercadante4, M. Merkin39, A. Meyer21, J. Meyer24, N.K. Mondal30, T. Moulik57, G.S. Muanza15, M. Mulhearn81, O. Mundal22, L. Mundim3, E. Nagy15, M. Naimuddin29, M. Narain77, R. Nayyar29,
H.A. Neal63, J.P. Negret8, P. Neustroev41, H. Nilsen23, H. Nogima3, S.F. Novaes5, T. Nunnemann26, G. Obrant41, D. Onoprienko58, J. Orduna34, N. Osman44, J. Osta55, R. Otec10, G.J. Otero y Garz´on1, M. Owen45, M. Padilla47, P. Padley80, M. Pangilinan77, N. Parashar54, V. Parihar77, S.-J. Park24, S.K. Park32, J. Parsons70, R. Partridge77, N. Parua53, A. Patwa73, B. Penning49, M. Perfilov39, K. Peters45, Y. Peters45, P. P´etroff16, R. Piegaia1, J. Piper64,
M.-A. Pleier73, P.L.M. Podesta-Lerma34,f, V.M. Podstavkov49, M.-E. Pol2, P. Polozov38, A.V. Popov40, M. Prewitt80, D. Price53, S. Protopopescu73, J. Qian63, A. Quadt24, B. Quinn65, M.S. Rangel16, K. Ranjan29,
P.N. Ratoff43, I. Razumov40, P. Renkel79, P. Rich45, M. Rijssenbeek72, I. Ripp-Baudot19, F. Rizatdinova76, S. Robinson44, M. Rominsky75, C. Royon18, P. Rubinov49, R. Ruchti55, G. Safronov38, G. Sajot14,
A. S´anchez-Hern´andez34, M.P. Sanders26, B. Sanghi49, G. Savage49, L. Sawyer59, T. Scanlon44, D. Schaile26, R.D. Schamberger72, Y. Scheglov41, H. Schellman52, T. Schliephake27, S. Schlobohm82, C. Schwanenberger45, R. Schwienhorst64, J. Sekaric57, H. Severini75, E. Shabalina24, V. Shary18, A.A. Shchukin40, R.K. Shivpuri29, V. Simak10, V. Sirotenko49, P. Skubic75, P. Slattery71, D. Smirnov55, G.R. Snow66, J. Snow74, S. Snyder73, S. S¨oldner-Rembold45, L. Sonnenschein21, A. Sopczak43, M. Sosebee78, K. Soustruznik9, B. Spurlock78, J. Stark14,
V. Stolin38, D.A. Stoyanova40, J. Strandberg63, M.A. Strang69, E. Strauss72, M. Strauss75, R. Str¨ohmer26, D. Strom50, L. Stutte49, P. Svoisky36, M. Takahashi45, A. Tanasijczuk1, W. Taylor6, B. Tiller26, M. Titov18, V.V. Tokmenin37, D. Tsybychev72, B. Tuchming18, C. Tully68, P.M. Tuts70, R. Unalan64, L. Uvarov41, S. Uvarov41,
S. Uzunyan51, P.J. van den Berg35, R. Van Kooten53, W.M. van Leeuwen35, N. Varelas50, E.W. Varnes46, I.A. Vasilyev40, P. Verdier20, L.S. Vertogradov37, M. Verzocchi49, M. Vesterinen45, D. Vilanova18, P. Vint44, P. Vokac10, H.D. Wahl48, M.H.L.S. Wang71, J. Warchol55, G. Watts82, M. Wayne55, G. Weber25, M. Weber49,g,
M. Wetstein60, A. White78, D. Wicke25, M.R.J. Williams43, G.W. Wilson57, S.J. Wimpenny47, M. Wobisch59, D.R. Wood62, T.R. Wyatt45, Y. Xie49, C. Xu63, S. Yacoob52, R. Yamada49, W.-C. Yang45, T. Yasuda49, Y.A. Yatsunenko37, Z. Ye49, H. Yin7, K. Yip73, H.D. Yoo77, S.W. Youn49, J. Yu78, C. Zeitnitz27, S. Zelitch81, T. Zhao82, B. Zhou63, J. Zhu72, M. Zielinski71, D. Zieminska53, L. Zivkovic70, V. Zutshi51, and E.G. Zverev39
(The DØ Collaboration)
1
Universidad de Buenos Aires, Buenos Aires, Argentina
2
LAFEX, Centro Brasileiro de Pesquisas F´ısicas, Rio de Janeiro, Brazil
3
Universidade do Estado do Rio de Janeiro, Rio de Janeiro, Brazil
4
Universidade Federal do ABC, Santo Andr´e, Brazil
5
Instituto de F´ısica Te´orica, Universidade Estadual Paulista, S˜ao Paulo, Brazil
6
Simon Fraser University, Burnaby, British Columbia, Canada; and York University, Toronto, Ontario, Canada
7
University of Science and Technology of China, Hefei, People’s Republic of China
8
Universidad de los Andes, Bogot´a, Colombia
9
Center for Particle Physics, Charles University, Faculty of Mathematics and Physics, Prague, Czech Republic
10
Czech Technical University in Prague, Prague, Czech Republic
11
Center for Particle Physics, Institute of Physics,
Academy of Sciences of the Czech Republic, Prague, Czech Republic
12
Universidad San Francisco de Quito, Quito, Ecuador
13
LPC, Universit´e Blaise Pascal, CNRS/IN2P3, Clermont, France
14
LPSC, Universit´e Joseph Fourier Grenoble 1, CNRS/IN2P3, Institut National Polytechnique de Grenoble, Grenoble, France
15
CPPM, Aix-Marseille Universit´e, CNRS/IN2P3, Marseille, France
16
LAL, Universit´e Paris-Sud, IN2P3/CNRS, Orsay, France
17
LPNHE, IN2P3/CNRS, Universit´es Paris VI and VII, Paris, France
18
CEA, Irfu, SPP, Saclay, France
19
IPHC, Universit´e de Strasbourg, CNRS/IN2P3, Strasbourg, France
20
IPNL, Universit´e Lyon 1, CNRS/IN2P3, Villeurbanne, France and Universit´e de Lyon, Lyon, France
21
III. Physikalisches Institut A, RWTH Aachen University, Aachen, Germany
22
Physikalisches Institut, Universit¨at Bonn, Bonn, Germany
23
Physikalisches Institut, Universit¨at Freiburg, Freiburg, Germany
24
II. Physikalisches Institut, Georg-August-Universit¨at G¨ottingen, G¨ottingen, Germany
25
Institut f¨ur Physik, Universit¨at Mainz, Mainz, Germany
26
Ludwig-Maximilians-Universit¨at M¨unchen, M¨unchen, Germany
27
Fachbereich Physik, University of Wuppertal, Wuppertal, Germany
28
Panjab University, Chandigarh, India
29
Delhi University, Delhi, India
30
Tata Institute of Fundamental Research, Mumbai, India
31
University College Dublin, Dublin, Ireland
32
Korea Detector Laboratory, Korea University, Seoul, Korea
33
SungKyunKwan University, Suwon, Korea
34
CINVESTAV, Mexico City, Mexico
35
FOM-Institute NIKHEF and University of Amsterdam/NIKHEF, Amsterdam, The Netherlands
36
Radboud University Nijmegen/NIKHEF, Nijmegen, The Netherlands
37
Joint Institute for Nuclear Research, Dubna, Russia
38
Institute for Theoretical and Experimental Physics, Moscow, Russia
39
40
Institute for High Energy Physics, Protvino, Russia
41
Petersburg Nuclear Physics Institute, St. Petersburg, Russia
42
Stockholm University, Stockholm, Sweden, and Uppsala University, Uppsala, Sweden
43
Lancaster University, Lancaster, United Kingdom
44
Imperial College London, London SW7 2AZ, United Kingdom
45
The University of Manchester, Manchester M13 9PL, United Kingdom
46
University of Arizona, Tucson, Arizona 85721, USA
47
University of California, Riverside, California 92521, USA
48
Florida State University, Tallahassee, Florida 32306, USA
49
Fermi National Accelerator Laboratory, Batavia, Illinois 60510, USA
50
University of Illinois at Chicago, Chicago, Illinois 60607, USA
51
Northern Illinois University, DeKalb, Illinois 60115, USA
52
Northwestern University, Evanston, Illinois 60208, USA
53
Indiana University, Bloomington, Indiana 47405, USA
54
Purdue University Calumet, Hammond, Indiana 46323, USA
55
University of Notre Dame, Notre Dame, Indiana 46556, USA
56
Iowa State University, Ames, Iowa 50011, USA
57
University of Kansas, Lawrence, Kansas 66045, USA
58
Kansas State University, Manhattan, Kansas 66506, USA
59
Louisiana Tech University, Ruston, Louisiana 71272, USA
60
University of Maryland, College Park, Maryland 20742, USA
61
Boston University, Boston, Massachusetts 02215, USA
62
Northeastern University, Boston, Massachusetts 02115, USA
63
University of Michigan, Ann Arbor, Michigan 48109, USA
64
Michigan State University, East Lansing, Michigan 48824, USA
65
University of Mississippi, University, Mississippi 38677, USA
66
University of Nebraska, Lincoln, Nebraska 68588, USA
67
Rutgers University, Piscataway, New Jersey 08855, USA
68
Princeton University, Princeton, New Jersey 08544, USA
69
State University of New York, Buffalo, New York 14260, USA
70
Columbia University, New York, New York 10027, USA
71
University of Rochester, Rochester, New York 14627, USA
72
State University of New York, Stony Brook, New York 11794, USA
73
Brookhaven National Laboratory, Upton, New York 11973, USA
74
Langston University, Langston, Oklahoma 73050, USA
75
University of Oklahoma, Norman, Oklahoma 73019, USA
76
Oklahoma State University, Stillwater, Oklahoma 74078, USA
77
Brown University, Providence, Rhode Island 02912, USA
78
University of Texas, Arlington, Texas 76019, USA
79
Southern Methodist University, Dallas, Texas 75275, USA
80
Rice University, Houston, Texas 77005, USA
81
University of Virginia, Charlottesville, Virginia 22901, USA and
82
University of Washington, Seattle, Washington 98195, USA (Dated: January 12th 2010)
We present a measurement of the differential cross section for t¯t events produced in p¯p collisions at √
s = 1.96 TeV as a function of the transverse momentum (pT) of the top quark. The selected events
contain a high-pTlepton (ℓ), a large imbalance in pT, four or more jets with at least one candidate for
a b jet, and correspond to 1 fb−1of integrated luminosity recorded with the D0 detector. Objects in
the event are associated through a constrained kinematic fit to the t¯t → W bW¯b → ℓνb q¯q′¯b process.
Results from next and next-to-next-to-leading-order perturbative QCD calculations agree with the measured differential cross section. Comparisons are also provided to predictions from Monte Carlo event generators using QCD calculations at different levels of precision.
PACS numbers: 14.65.Ha,12.38.Qk,13.85.Qk
The transverse momentum (pT) of top quarks in t¯t events provides a unique window on heavy-quark pro-duction at large momentum scales. In the standard model (SM), the lifetime of the top quark is far shorter than the characteristic hadron-formation time of quan-tum chromodynamics (QCD), which provides access to
the properties and kinematics of a “bare” quark, such as mass, charge, spin, and pT, that are almost unaffected by bound-state formation or final-state interactions [8]. The top quark is unique in that it has a mass close to the scale of electroweak symmetry breaking. Detailed studies of the properties of this bare quark beyond the
ment of its total production rate, such as the measure-ment of its quantum numbers and of its couplings to other SM particles, may indicate whether the top quark plays a privileged role in the symmetry breaking. Focusing on details of the t¯t production, measurements of differential cross sections in the t¯t system test perturbative QCD (pQCD) for heavy-quark production and can constrain potential new physics beyond the SM [9], e.g., by mea-suring the transverse momentum of the top quark [10].
In this Letter, we present a new measurement of the inclusive differential cross section for p¯p → t¯t+ X pro-duction at √s = 1.96 TeV as a function of the pT of the top quark. The measurement is corrected for detec-tor efficiency, acceptance and resolution effects, making it possible to perform direct comparisons with different theoretical predictions. The data were acquired with the D0 detector at the Fermilab Tevatron Collider and cor-respond to an integrated luminosity of ≈ 1 fb−1. This measurement was performed in the ℓ+jets decay channel of t¯t → W bW¯b → ℓν + b¯b + ≥ 2 jets, where ℓ repre-sents an e or µ from the decay of the W boson or from W → τ → ℓ. The dependence of the cross section on the pT of the top quark was examined previously using ≈ 100 pb−1of Tevatron Run I data at√s = 1.8 TeV [11], where no deviations from the SM were reported.
The D0 detector [12] is equipped with a 2 T solenoidal magnet surrounding silicon-microstrip and scintillating-fiber trackers. These are followed by electromagnetic (EM) and hadronic uranium/liquid argon calorimeters, and a muon spectrometer consisting of 1.8 T iron toroidal magnets and wire chambers and scintillation counters. Electrons are identified as track-matched energy clus-ters in the EM calorimeter. Muons are identified by matching tracks in the inner tracking detector with those in the muon spectrometer. Jets are reconstructed from calorimeter energies using the Run II iterative seed-based midpoint cone algorithm with a radius of 0.5 [13]. Jets are identified as originating from a b quark using an artifi-cial neural network (b NN) which combines several track-ing variables [14]. Large misstrack-ing transverse energy, 6ET (the negative of the vector sum of transverse energies of calorimeter cells, corrected for reconstructed muons) signifies the presence of an energetic neutrino. Events are selected using a three-level trigger system, which has access to tracking, calorimeter, and muon information, and assures that only events with the desired topology or with objects above certain energy thresholds are kept for further analysis.
The analysis uses similar data samples, event selec-tion, and corrections as used in the inclusive t¯t → ℓ+jets cross-section measurements detailed in Ref. [15]. Events accepted by lepton+jets triggers are subject to additional selection criteria including exactly one isolated lepton with pT > 20 GeV/c and ≥ 4 jets with pT > 20 GeV/c and |η| < 2.5 [16]; at least one jet must have pT > 40 GeV/c. At least one jet is also required to be tagged
by the b NN algorithm. Additionally, we require 6ET > 20 GeV (25 GeV) for the e+jets (µ+jets) channel and electrons (muons) with |η| < 1.1 (2.0).
Our measurement uses the alpgen [17] event gener-ator, with pythia [18] for parton showering, hadroniza-tion, and modeling of the underlying event, to simulate the inclusive t¯t signal. A pythia sample serves as a cross check. The CTEQ6L1 set of parton distribution functions (PDFs) [19] was used with a common factor-ization and renormalfactor-ization scale set to µ = mt+
P pjetsT for mt = 170 GeV/c2. Backgrounds are modeled with alpgen+pythia for W +jets and Z+jets production, pythia for diboson (W W , W Z, and ZZ) production, and comphep [20] for single top-quark production. The detector response is simulated using geant [21]. The simulated t¯t signal is normalized to the cross section measured by a dedicated likelihood fit in the same fi-nal state using the same event selections (including the b-tagging requirement) and data as Ref. [15], namely to 8.46+1.09−0.97 pb at a top-quark mass mt = 170 GeV/c2 (in good agreement with the value extracted in this study by integrating the differential cross section). The dibo-son and single top-quark backgrounds are normalized to their SM predictions, Z+jets to the prediction from next-to-leading-order (NLO) pQCD, and W +jets such that the predicted number of events matches the data before applying b tagging.
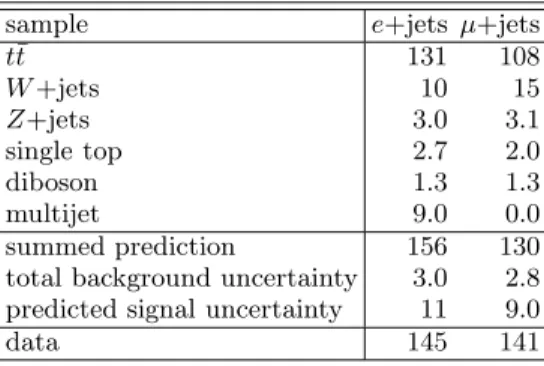
The small multijet background, in which a jet is misidentified as an isolated lepton, is non-negligible only in the e+jets channel. Its rate is estimated from data using the large difference in the probability of electro-magnetic showers of real electrons or misidentified jets to satisfy the electron selection criteria. The details of the sample composition and the observed yields before and after requiring the jets to be tagged as b-jet are pre-sented in Table I.
The selection yields 145 and 141 events in the e+jets and µ+jets decay channels, respectively. The measured t¯t signal fraction is 0.79, indicating that this sample is suitable for detailed studies of t¯t production. A con-strained kinematic fit to the t¯t final state, which takes
TABLE I: Expected yields for signal and backgrounds samples and observed event counts in e+jets and µ+jets channels.
sample e+jets µ+jets
t¯t 131 108 W +jets 10 15 Z+jets 3.0 3.1 single top 2.7 2.0 diboson 1.3 1.3 multijet 9.0 0.0 summed prediction 156 130 total background uncertainty 3.0 2.8 predicted signal uncertainty 11 9.0
]
2 tm [GeV/c
100 150 200 250 300 350 400 -1]
2 tdN / dm [GeV/c
1 2 3 4 5]
2m [GeV/c
100 150 200 250 300 350 400 1 2 3 4 5]
2m [GeV/c
100 150 200 250 300 350 400 1 2 3 4 5DØ
data, 1 fb
-1tt
-Background
FIG. 1: The reconstructed top-quark mass compared with expectation. Hashed areas represent statistical and jet energy calibration uncertainties on the prediction.
into account the unreconstructed neutrino and finite ex-perimental resolution, is used to associate leptons and jets with individual top quarks [22, 23]. The fit assumes equal masses for the two reconstructed top quarks and the two reconstructed W boson masses are constrained to 80.4 GeV/c2. All possible permutations of objects needed to produce the t¯t system are considered, and the solution of fitted leptonic and hadronic top-quark four-momenta with the smallest χ2 (the goodness of the fit) is selected for further analysis. The b-jet assignment in-formation is not used in the selection of the best permu-tation to avoid the associated efficiency loss. The effects of possibly selecting a wrong permutation when choosing the one with the best χ2 are taken into account in the corrections of the measurement to the parton level. The solution with the best (second best) χ2 corresponds to the correct assignment of the quarks from the decay of the t¯t pair in 48% (17%) of events.
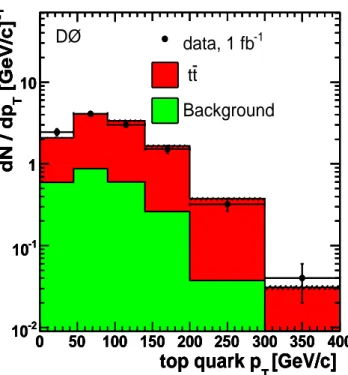
The reconstructed top-quark mass (mt) from the best fit in data, simulated t¯t signal, and background is shown in Fig. 1. There is good agreement between the data and the sum of signal and background expectations in terms of the shape, resolution, and mean of the distribution in mt(χ2/NDF = 1.28). The pT spectrum of the top quark (for leptonic and hadronic entries) in data, together with predicted signal and background, is shown in Fig. 2 for the best solution but now refitted with a top-quark mass fixed to 170 GeV/c2(the value used in the inclusive cross section measurement [15]) to improve resolution. To ob-tain a background-subtracted data spectrum, the signal
purity is fitted using signal and background contributions as a function of pT, and applied as a smooth multiplica-tive factor to the data. The result is the background-corrected distribution shown as a solid line in Fig. 3.
The reconstructed pT spectrum is subsequently cor-rected for effects of finite experimental resolution, based on a regularized unfolding method [24, 25] using a mi-gration matrix between the reconstructed and parton pT derived from simulation. The size of the pT bins was cho-sen based on the requirement that the purity (the fraction of parton-level events which are reconstructed in the cor-rect pT range) is > 50%, as shown in Table II. This also results in pT bins which are larger than the experimental resolution for the top quark pT. The correlation between reconstructed and correct pT is > 80%. Figure 3 com-pares the reconstructed and corrected results as a func-tion of the pT of the top quark. The dependence of the unfolding on the parton spectrum shape in the migration matrix is tested by reweighting the distribution with arbi-trary functions. Shape variations of ≈ 20% induce 2−6% changes in the differential cross section. A correction for acceptance from the dependence of the spectrum on kine-matic restrictions of reconstructed quantities is applied to the unfolded distributions.
The measured differential cross section as a function of the pT of the top quark (using for each event the two measurements obtained from the leptonic and hadronic top quark decays), dσ/dpT, is shown in Fig. 4 and tab-ulated in Table III together with the NLO pQCD pre-diction [26, 27]. The statistical uncertainties are esti-mated by performing 1000 pseudo-experiments where, in each experiment, the background-corrected spectrum is allowed to vary according to Poisson statistics and is then unfolded using the regularized migration matrix (Table II). The largest experimental uncertainties affect-ing the shape of the pT distribution include jet energy calibration in data and in simulation (1.5 − 5.0%), jet reconstruction efficiency (0.7 − 3.5%), and jet energy res-olution (≈ 0.5%). The residual dependence of the
un-TABLE II: The migration matrix between the reconstructed (rows) and parton (columns) top-quark pT derived from
alpgent¯t events passed through full detector simulation. The matrix indicates the fraction of events migrated from a given parton bin to the reconstructed bins. The binning used for correlating reconstructed and parton levels of pT are given at
the left and top, respectively. Results in bold print are for diagonal terms. pT (GeV/c) 0–45 45–90 90–140 140–200 200–300 300–400 0–45 0.530 0.162 0.062 0.020 0.003 0.000 45–90 0.344 0.578 0.227 0.072 0.021 0.000 90–140 0.103 0.228 0.560 0.223 0.055 0.031 140–200 0.019 0.029 0.145 0.581 0.232 0.071 200–300 0.002 0.002 0.006 0.103 0.650 0.363 300–400 0.000 0.000 0.000 0.001 0.038 0.535
T
top quark p [GeV/c]
0
50
100 150 200 250 300 350 400
-1[GeV/c]
TdN / dp
-210
-110
1
10
Ttop quark p [GeV/c]
0
50
100 150 200 250 300 350 400
-1[GeV/c]
TdN / dp
-210
-110
1
10
Ttop quark p [GeV/c]
0
50
100 150 200 250 300 350 400
-1[GeV/c]
TdN / dp
-210
-110
1
10
-1DØ
data, 1 fb
tt
-Background
FIG. 2: The pTspectrum of top quarks (two entries per event)
compared with expectation. Hashed areas represent statisti-cal and jet energy statisti-calibration uncertainties on the prediction.
folded result on the top-quark mass is 2 − 6% for mt in the 170-175 GeV/c2 range. This additional uncer-tainty does not need to be considered for comparisons with models in which mt is set to 170 GeV/c2. For the main background sources, W/Z+jets, we have also con-sidered the variations of the background shape caused by uncertainties in the k-factors and in additional scale factors for heavy-flavour jets. Other systematic uncer-tainties [15] account for unceruncer-tainties in the modeling of the signal, estimated from the difference between alpgen and pythia, for uncertainties in the PDFs and in the b-quark fragmentation. The uncertainty on the integrated luminosity is 6.1%. The systematic uncertainties quoted in the following combine the uncertainty on the normal-ization (independent of pT) with the shape-dependent systematics. The total correlated systematic uncertainty is 9.6% (including the uncertainty on luminosity) and the total systematic uncertainty on the cross section, in-tegrating over pT, is 10.7%.
Results from NLO pQCD [26, 27] calculations obtained using CTEQ61 [28] PDFs (using the scale µ = mt = 170 GeV/c2) are overlaid on the measured differential cross section in Fig. 4. Also shown are results from an approximate next-to-NLO (NNLO) pQCD calcula-tion [29] computed using MSTW2008 NLO PDFs [30] and same scales choices as the NLO result, and from the mc@nlo [31] (using CTEQ61 PDFs), alpgen, and pythia event generators. The QCD scale uncertainty was evaluated for the NLO pQCD calculation [26, 27]
[GeV/c]
Ttop quark p
0 50 100 150 200 250 300 350 400 -1[GeV/c]
TdN / dp
-2 10 -1 10 1 10 -1DØ
data, 1 fb
reconstructed
corrected
[GeV/c]
Ttop quark p
0 50 100 150 200 250 300 350 400 -1[GeV/c]
TdN / dp
-2 10 -1 10 1 10FIG. 3: Comparison between the background-subtracted re-constructed top-quark pT spectrum and the one corrected for
the effects of finite experimental resolution (two entries per event). Inner and outer error bars represent the statistical and total (statistical and systematic added in quadrature) uncertainties, respectively.
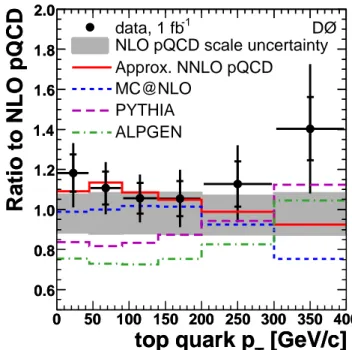
by varying µ = mt = 170 GeV/c2 by factors of 2 and 1/2, and the PDF uncertainty by the approximate NNLO code [29]. The total uncertainty is < 4% with only a small (< 1%) shape variation. A comparison of the ratio of dσ/dpT relative to a NLO pQCD calculation is shown in Fig. 5. The NLO pQCD calculations agree with the measured cross section, however, results from alpgen (pythia) have a normalization shift of about 45% (30%) with respect to data. A shape comparison of the ratio of (1/σ) dσ/dpT relative to NLO pQCD is shown in Fig. 6. All of the calculations reproduce the observed shape. The χ2 and corresponding χ2 probabilities [32] for the com-parisons in Figs. 5 and 6 of predictions to data are given in Table IV.
In conclusion, we have presented a 1 fb−1 measure-ment of the differential cross section of the top-quark pT for t¯t production in the ℓ+jets channel using p¯p col-lisions at√s = 1.96 TeV. Results from NLO and NNLO pQCD calculations and from the mc@nlo event genera-tor agree with the normalization and shape of the mea-sured cross section. Results from alpgen+pythia and pythiadescribe the shape of the data distribution, but not its normalization. We thank the staffs at Fermilab and collaborating institutions, and acknowledge support from the DOE and NSF (USA); CEA and CNRS/IN2P3 (France); FASI, Rosatom and RFBR (Russia); CNPq,
[GeV/c]
Ttop quark p
0 50 100 150 200 250 300 350 400]
-1[pb/GeVc
T/ dp
σ
d
0.02 0.04 0.06 0.08 0.1 0.12 0.14 0.16 -1DØ
data, 1 fb
NLO pQCD
Approx. NNLO pQCD
MC@NLO
PYTHIA
ALPGEN
[GeV/c]
Ttop quark p
0 50 100 150 200 250 300 350 400]
-1[pb/GeVc
T/ dp
σ
d
0.02 0.04 0.06 0.08 0.1 0.12 0.14 0.16FIG. 4: Inclusive dσ/dpT for t¯t production (two entries per
event) in data (points) compared with expectations from NLO pQCD (solid lines), from an approximate NNLO pQCD cal-culation, and for several event generators (dashed and dot-dashed lines). The gray band encompasses uncertainties on the pQCD scale and parton distribution functions. Inner and outer error bars represent the statistical and total (statistical and systematic added in quadrature) uncertainties, respec-tively.
FAPERJ, FAPESP and FUNDUNESP (Brazil); DAE and DST (India); Colciencias (Colombia); CONACyT (Mexico); KRF and KOSEF (Korea); CONICET and UBACyT (Argentina); FOM (The Netherlands); STFC and the Royal Society (United Kingdom); MSMT and GACR (Czech Republic); CRC Program, CFI, NSERC and WestGrid Project (Canada); BMBF and DFG
(Ger-TABLE III: Inclusive differential cross section dσ/dpTfor t¯t
production at√s = 1.96 TeV and mt= 170 GeV/c 2
. There are two entries per event, with the total normalized to the t¯t production cross section. In addition to total systematic uncertainties on the shape in pT in each bin, there is a pT
-independent systematic uncertainty of 9.6% that is not in-cluded in the table.
pT hpTi Cross Stat. Shape Sys. NLO
Section Unc. Unc. pQCD (GeV/c) (GeV/c) (fb/GeV) (fb/GeV) (fb/GeV) (fb/GeV)
0−45 29 70 11 5 59.6 45−90 68 130 20 10 116 90−140 113 89 13 6 83.8 140−200 165 37 6 3 35.6 200−300 233 8.7 1.7 0.7 7.72 300−400 329 1.1 0.3 0.1 0.814 σt¯t (pb) 8.31 1.28 7.54
[GeV/c]
Ttop quark p
0 50 100 150 200 250 300 350 400Ratio to NLO pQCD
0.6 0.8 1.0 1.2 1.4 1.6 1.8 2.0 -1DØ
data, 1 fb
NLO pQCD scale uncertainty
Approx. NNLO pQCD
MC@NLO
PYTHIA
ALPGEN
[GeV/c]
Ttop quark p
0 50 100 150 200 250 300 350 400Ratio to NLO pQCD
0.6 0.8 1.0 1.2 1.4 1.6 1.8 2.0FIG. 5: Ratio of dσ/dpT for top quarks in t¯t production (two
entries per event) to the expectation from NLO pQCD. The gray band encompasses uncertainties on the scale of pQCD and parton distribution functions. Also shown are ratios rel-ative to NLO pQCD for an approximate NNLO pQCD calcu-lation and of predictions for several event generators. Inner and outer error bars represent statistical and total (statistical and systematic added in quadrature) uncertainties, respec-tively.
many); SFI (Ireland); The Swedish Research Council (Sweden); and CAS and CNSF (China).
[a] Visitor from Augustana College, Sioux Falls, SD, USA. [b] Visitor from The University of Liverpool, Liverpool, UK. [c] Visitor from SLAC, Menlo Park, CA, USA.
[d] Visitor from ICREA/IFAE, Barcelona, Spain.
[e] Visitor from Centro de Investigacion en Computacion -IPN, Mexico City, Mexico.
[f] Visitor from ECFM, Universidad Autonoma de Sinaloa,
TABLE IV: The χ2
/NDF and χ2
probability for comparisons between the measured data and predictions using correlated (uncorrelated) uncertainties for the absolute (shape) compar-ison.
Prediction Absolute Shape χ2 /NDF prob. χ2 /NDF prob. NLO pQCD 0.695 0.653 0.315 0.904 Approx. NNLO pQCD 0.521 0.793 0.497 0.779 mc@nlo 1.22 0.295 0.777 0.566 pythia 2.61 0.0157 0.352 0.881 alpgen 5.04 3.54×10⁻⁵ 0.204 0.961
[GeV/c]
T
top quark p
0 50 100 150 200 250 300 350 400
Shape ratio to NLO pQCD
0.6 0.8 1.0 1.2 1.4 1.6 1.8 2.0 -1
DØ
data, 1 fb
NLO pQCD scale uncertainty
Approx. NNLO pQCD
MC@NLO
PYTHIA
ALPGEN
[GeV/c]
Ttop quark p
0 50 100 150 200 250 300 350 400Shape ratio to NLO pQCD
0.6 0.8 1.0 1.2 1.4 1.6 1.8 2.0
FIG. 6: Ratio of (1/σ) dσ/dpTfor top quarks in t¯t production
(two entries per event) to the expectation from NLO pQCD. The gray band encompasses uncertainties on the scale of pQCD and parton distribution functions. Also shown are ra-tios relative to NLO pQCD for an approximate NNLO pQCD calculation and of predictions for several event generators. Inner and outer error bars represent statistical and total (sta-tistical and systematic added in quadrature) uncertainties, respectively.
Culiac´an, Mexico.
[g] Visitor from Universit¨at Bern, Bern, Switzerland. [8] I. Bigi et. al., Phys. Lett. B181, 157 (1986).
[9] C. T. Hill and S. J. Parke, Phys. Rev. D49, 4454 (1994). [10] D. Atwood et al., Phys. Rev. D52, 6264 (1995).
[11] T. Affolder et al., CDF Collaboration, Phys. Rev. Lett. 87, 102001 (2001);
B. Abbott et al., D0 Collaboration, Phys. Rev. D58, 052001 (1998).
[12] V. M. Abazov et al., D0 Collaboration, Nucl. Instrum. Methods in Phys. Res. A565, 463 (2006).
[13] G. C. Blazey et al., in Proceedings of the Workshop: QCD and Weak Boson Physics in Run II, edited by U. Baur, R. K. Ellis, and D. Zeppenfeld, Fermilab-Pub-00/297 (2000).
[14] V. M. Abazov et al., D0 Collaboration, Nucl. Instrum. Methods in Phys. Res. A620, 400 (2010).
[15] V. M. Abazov et al., D0 Collaboration, Phys. Rev. D80 (RC), 071102 (2009).
[16] Pseudorapidity is defined as η = − ln tan(θ/2) where θ is the angle measured with respect to the proton beam coinciding with the positive z axis of a right-handed co-ordinate system at the center of the detector.
[17] M. L. Mangano, et al., J. High Energy Phys. 0307, 001 (2003).
[18] T. Sj¨ostrand et al., Comput. Phys. Commun. 135, 238 (2001); R. Field and R. C. Group, arXiv:hep-ph/0510198. [19] J. Pumplin et al., J. High Energy Phys. 0207, 012 (2002).
[20] E. E. Boos et al., Phys. Atom. Nucl. 69, 1317 (2006); Yad. Fiz. 69, 1352 (2006).
[21] R. Brun and F. Carminati, CERN Program Library Long Writeup W5013, 1993 (unpublished).
[22] V. M. Abazov et al., D0 collaboration, Phys. Rev. D75, 092001 (2007);
[23] S. Snyder, Ph.D. thesis, State University of New York at Stony Brook (1995), [Institution Report No. FERMILAB-THESIS-1995-27].
[24] A. Hoecker and V. Kartvelishvili, Nucl. Instrum. Meth-ods in Phys. Res. A372, 469 (1996).
[25] V. Kartvelishvili, http://www.lancs.ac.uk/users/spc/staff/kartvelishvili.htm. [26] M. Mangano, P. Nason, and G. Ridolfi, Nucl. Phys.
B373, 295 (1992).
[27] P. Nason, S. Dawson, and R. K. Ellis, Nucl. Phys. B327, 49 (1989) [Erratum-ibid. B335, 260 (1990)].
[28] D. Stump et al., J. High Energy Phys. 0310, 046 (2003). [29] N. Kidonakis and R. Vogt, Phys. Rev. D78, 074005
(2008).
[30] A.D. Martin, W.J. Stirling, R.S. Thorne, G. Watt, Eur. Phys. J. C63 189 (2009).
[31] S. Frixione and B. R. Webber, J. High Energy Phys. 0206, 029 (2002); S. Frixione, P. Nason, and B. R. Web-ber, J. High Energy Phys. 0308, 007 (2003).
[32] N. D. Gagunashvili, Nucl. Instrum. Methods in Phys. Res. A596, 439 (2008).