AN ALTERNATIVE DIAGNOSTIC METHOD USING MICRONEEDLES FOR SAMPLING THE IMMUNE SYSTEM IN SITU
by
Anasuya Mandal
B. Tech., Chemical Engineering
Indian Institute of Technology Bombay, India (2011)
M.S. Chemical Engineering Practice
Massachusetts Institute of Technology, Cambridge, USA (2014) Submitted to the Department of Chemical Engineering in partial fulfillment of the requirements for the degree of
Doctor of Philosophy at the
MASSACHUSETTS INSTITUTE OF TECHNOLOGY
May 2017
0 2017 Massachusetts Institute of Technology. All rights reserved.
Signature Redacted
Signature of A uthor ... tf... .... ... ... ... ... .Department of Chemical Engineering
Friday, May 19, 2017
Signature Redacted
C ertified by : ... ...
Paula Hammond David H. Koch Professor, Department of Chemical Engineering Thesis Supervisor
Signature Redacted
C ertified by: ... ...Darrell J. Irvine Professor of Materials Science and Engineering and Biological Engineering Thesis Supervisor
Signature Redacted
A ccepted by ... 7 1... ...
Daniel Blankschtein Herman P. Meissner '29 Professor of Chemical Engineering
NS Y Chairman, Committee for Graduate Students
JUN 19
2017
Members of Thesis Committee
Paula T. Hammond
Professor of Chemical Engineering
Massachusetts Institute of Technology
Thesis Advisor
Darrell J. Irvine
Professor of Biological Engineering and Materials Science & Engineering
Massachusetts Institute of Technology
Thesis Advisor
J. Christopher Love
Professor of Chemical Engineering
Massachusetts Institute of Technology
Michael F. Rubner
Professor of Polymer Material Science and Engineering
Massachusetts Institute of Technology
ALTERNATIVE DIAGNOSTIC METHODS
FOR SAMPLING THE IMMUNE SYSTEM IN
SITU
by
Anasuya Mandal
Abstract
Current protocols for immune system monitoring involve the collection of cells from blood or cerebrospinal fluid. However, since major populations of immune cells reside within tissues, these invasively-obtained body fluid samples are, at best, indirect indicators of the status of the immune system. Direct tissue sampling through biopsies is difficult to incorporate into long-term, repetitive, longitudinal immune monitoring. Whereas delayed-type hypersensitivity tests (e.g., Mantoux tuberculin test) query the presence of antigen-specific cells in the skin, but do not provide information about the phenotype and functional characteristics of responding immune cells.
Here we present a technology that addresses several of these challenges simultaneously, with the synergistic goals of providing enhanced diagnostic methods for sampling and analyzing the function of the immune system, and providing a greater insight into the status of the immune system than state-of-the-art assays. We designed hydrogel-coated, immune-monitoring, sampling microneedles that are capable of sampling non-recirculating immune cell populations present in the skin and permitting the quantification of biomarkers present in collected dermal interstitial fluid, thus enabling the parallel monitoring of both cellular and humoral immune responses.
We focused, first, on optimizing the materials for fabricating sampling microneedles with the requisite properties of mechanical integrity and robustness, reproducible fabrication, effective skin penetration, ability to include bioactive cell-signaling molecules in the MN sampling platform and a compartment within the platform for sample collection and retention. Next, we utilized two animal models: an immunization model in which mice were vaccinated with model antigen ovalbumin, and an infection model in which mice were infected, via tail-skin scarification, with vaccinia-virus expressing SIVgag. We established that including adjuvants and antigen as cargo in lipid nanocapsules embedded in the hydrogel coating of the microneedles elicit the recruitment and sampling of not only antigen-specific cells, but also non-recirculating tissue resident memory cells. In both models, we demonstrated that even at long times post antigen exposure, sampling microneedles consistently recruited for higher proportions of antigen-specific cells than those present in blood. Finally, we also showed that the dermal interstitial fluid collected via sampling microneedles, could be reliably quantified for biomarkers such as antigen-specific IgG.
The technology of sampling microneedles allows ex vivo analysis of cells retrieved directly from the local tissue environment and enables the investigation of antigen-specific cells for diagnostic purposes as well as answering spatio-temporal questions related to immunology in local tissue environments. This simple, painless and minimally-invasive sampling approach should facilitate longitudinal monitoring of antigen-specific immune cell populations in the skin relevant for a variety of infectious and autoimmune diseases, and aid the process of vaccine design.
Thesis Supervisor: Paula T. Hammond
Title: David H Koch Professor of Chemical Engineering Thesis Supervisor: Darrell J. Irvine
Acknowledgments
Six years ago, there is no way I could have predicted the twists and turns this journey would bring to my life. But as they say, hindsight is 20/20 and as I wrap up this phase of scholastic endeavors,
I am grateful to have the opportunity to thank the many, many people who have helped me connect
the dots along the way - scientifically, professionally and personally. I would like to express my sincere and heartfelt gratitude to the following people:
To my thesis advisors: Prof. Paula Hammond - for giving me the opportunity and having the confidence in me to take stab at this difficult project. Thank you for your kindness, constant encouragement and infectious enthusiasm, for the brief asides on 'science and language' and for showing me how collaborations can take science so much farther, with the synergies of combined expertise and effort. The sense of effortless class and warmth you radiate is a quality that I shall always strive toward. Prof. Darrell Irvine - I am deeply thankful to have received your guidance
and mentorship. Thank you for all the scores of hours that we brainstormed for new ideas and directions, when I came in to meet you with nothing having worked in the prior two weeks. I left your office feeling elated each time, with a smile on my face, my head held high and with a sense of renewed purpose. Some of my most cherished moments from these years have been discussing raw data with you and planning beforehand to preempt your insightful questions. Our interactions have shaped the way I approach and think about science and for that, I am indebted. Thank you for your caring, for pushing me to persevere and answer the 'why,' the 'how' and the 'what if questions. Thank you for your dedication towards all of us in the lab and our scientific pursuits. To my thesis committee: Prof. Chris Love, thank you for your motivation, facilitating our collaboration and your discerning and detailed technical comments. Prof. Rubner, thank you for the undying optimism and encouragement, for always asking about 'the big picture,' and for your materials related questions and technical expertise.
To my lab mates and lab alumni: I have been fortunate to be part of two big families in the Hammond and Irvine labs. Archana, this thesis would not have been possible without you and your infectious 'let's make your plan, write up the list and do this' and 'this just has to work' attitude. Almost all of the work that comprises this thesis happened after your advent into the lab. For all the scientific teaching and advice, the numerous iterations and discussions of experiment lists and for being my sounding board always - thank you, thank you, thank you! I will thoroughly miss the catching up over microneedle applications and necropsies. Pete, for your guidance and mentorship and for teaching me about the 'art' of microneedles. Stepping into your shoes was a difficult ask and I benefited greatly from those initial months of learning from you. Talar, Mari, Greg - for your advice over experimental protocols and procedures. Kavya - for teaching me the scarification technique and working with vaccinia virus. Sudha - for your unparalleled expertise and relentless assistance in all things microscopy. Nitasha and Eric - for your advice in my chemistry-related undertakings. Kelly - for promptly providing all of the ova vaccine for my mice, whenever I needed. Wuhbet and Heikyung- for all the help with the mice and troubleshooting protocols. Julio
- for your help with the SEM imaging of the 'Cappadocia' MNs. Melissa - for teaching me about ELISAs and to bleed mice 'like a pro.' Mohi - for listening and brainstorming with me in the initial phases of this project. Mila - for the amazing introductory crash course in immunology and for your continued advice over the years. Liz - for the AFM characterization of the alginate gels. Those AFMs essentially laid the foundation of this thesis. Andrew, Erik, Lawrence, Santi, Brett
-for asking the perceptive questions that are crucial to research. Jenny - for your inquisitiveness and for your hard work. Li, Sabrina, Jake, Lauren, Mehdi, Nicole, David, Prabhani, Samantha, Samin, Steven, Stephen, Yana, Yiran, Jouha - all for your help, advice, our conversations and fun memories. Alex, Andrew, Llian, Chris, Nikki - for helping to make the lab such a fun and vibrant place!
To my collaborators: Todd and Lionel, for being so industrious and eager to help me Seqwell and MuSIC. It was an absolute pleasure to work with both of you.
Technical assistance at the core facilities: Glenn Paradis and Mike Jennings (flow cytometry), Scott Malstrom (in vivo imaging), Bill DiNatale (SEM).
To the lab managers and amazing administrative assistants: Mark (for running the lab so seamlessly), Val, Mariann, Liz, Erin and Xiuyun - all of you make life so much easier. Thank you for all your help!
To members of the Course-X community: Suzanne, Fran, Joel, Sydney, Sharece, Eileen and 'New-Zanne' - the student office does such a wonderful job in making the department so lively, warm and welcoming. My 'split-session' practice school group: Prof. Claude Lupis and Prof. Bob Fisher, for your careful guidance; Helen, Karthik, Chris, Sakul, Nate, Sean, Alex, Jicong - for enjoyable times and cherished memories. Prof. Kris Prather - thank you for your counsel. Kristen, Garrett, Ankur, Connor, Lisa Guay, Natasha, Kevin, Lisa Volpatti, Mark Keibler, Mike - being part of the
GSAB and REFS-X with all of you have been some of the most valued experiences at MIT. Siva,
Sagar, Sayalee, Connie and Carl - for all the advice and guidance.
To members of the HST (GEMS) community: Prof. Edelman - for giving me chance to pursue this brilliant program. Adam, Becky, Jenny, Amanda and Rachit - for your camaraderie and discussions. My preceptorship hosting team - Dr. Pomahac, Ericka, Sotirios, Nicco, Thet Su, Lisa Quinn, Catherine, Grace, Lisa, Ramon, Bill, Ashley, and David - for allowing me to witness the incredible ways you all touch the lives of patients. Prof. Shiv Pillai - for the finest pedagogy I've ever experienced and for teaching us about the remarkable workings of the immune system. The Lymphocyte Rap is one of my guilty pleasures.
To colleagues and mentors at MIT: Libby Mahaffy - your teachings about conflict management and the 'yes and's will forever be etched in my brain; for learnings in compassion, empathy and emotional vocabulary. The International Students Office - for being so, so kind and supportive. The Fall 2016 6.928 group: Prof. Nifto, Nada, Andrew Dykhuis, Andrew David, Elizabeth, Jenny,
Eugene, Matt, Stephanie, Emily, Nil, and Filiz - for your diverse opinions, outlooks and exchanges in one of the best courses I've taken at MIT. To Amar, Wenda, Anthony, Gabrielle, Arvind, and Chris - for sticking through and helping me get better at tackling cases. To the drivers of the Tech shuttles and Saferide shuttles - for making those experimental time points in the wee hours just a little bit easier to get to.
To Sai, Chiraag, Nikhil, Priya, Mehul, Atulya, Rutu, Deeksha, Rahul, Ananth, Diviya, Hari, Annalisa and Manish, thank you for all the laughter and fun.
To my funding sources: the Institute for Soldier Nanotechnologies, the Koch Institute and the Alkermes Fellowship - for supporting my time and work here at MIT.
To 'my crew' - I owe you my sanity. Thank you all for being my sounding boards, all across the
world, patiently listening to my rants; for our quirky discussions, for your empathy and kindness, and, for celebrating my triumphs and commiserating with me. Tejal - for our laughter and never-ending chats that brought welcome respite to low-spirited days; Yash - for your candor, your zeal and, recently, our impromptu 'coffees'; Prashant - for all the 6am crib sessions and health talk; Nishant - for your thoughtfulness and our candid dialogues; Antariksh - for inspiring me to always look out for the next creative, eccentric thing to do; Lishi - for your compassion; Sriram - for the esoteric anecdotes and all the addictive hot pot; Sood - for your caring; and Priyanka - for all the fun in our artsy and gastronomy-related endeavors. Dr. Anjana Rajan - your carefully chosen words have helped me navigate some difficult times, and for our conversations, I shall be forever thankful.
To my family: my parents - for always believing in me, for constantly supporting my various, often disjoint, efforts; for pushing me to aim high and work hard; for inspiring me to pursue 'biology'. I am who I am because of you and your sacrifices. I hope to continue to make you proud of me. To Kasturi and Sid - for being the closest thing to home here in Boston.
And finally, to Vishnu - for your unwavering support, for being my biggest cheerleader, for always being the familiar face in the crowd, for proofreading all my drafts, for giving me strength when I didn't have any, for encouraging me to be enterprising, for practicing difficult conversations with me, for holding my hand on the slippery and difficult terrains of hikes and life alike, for our many adventures, and for so much more. I am wonderfully lucky to have and share my life with you. Thank you for your love.
CONTENTS
A b stract... 3 Acknowledgments... 5 List of Figures ... 10 List of Abbreviations ... 16 1 INTRODUCTION ... 171.1 The Immune System and Immune Response... 17
1.2 Skin as an Immune Organ... 19
1.3 The Need for a Novel Immune M onitoring M ethod... 21
1.3.1 Case Study on Immune Monitoring in Organ Transplantation... 22
1.3.2 Case Study on Systemic Lupus Erythematosus (SLE)...23
1.4 M icroneedle-Based System s... 24
1.5 Scope and Outline of Thesis ... 25
2 OPTIMIZATION OF MATERIALS FOR CELL AND INTERSTITIAL FLUID SAMPLING USING CHEMOATTRACTANTS... 27
2.1 Introduction... 27
2.2 M aterials and M ethods... 29
2.2.1 M aterials and Animals... 29
2.2.2 Preparation of Porous M icroneedles... 29
2.2.3 Trypan Blue Test for M icroneedle Insertion ... 30
2.2.4 Alginate Swelling Studies... 30
2.2.5 Atomic Force M icroscopy of Alginate Gels... 31
2.2.6 Subcutaneous Gel Injection Studies... 31
2.2.7 Preparation of Sampling (Alginate Coated) M icroneedles... 32
2.2.8 Crosslinking of Alginate Coated M icroneedles... 33
2.3 Results and Discussion ... 33
2.3.1 Porous M icroneedles Insertion In Vivo... 33
2.3.2 Choice of Alginate ... 39
2.3.3 Effect of Chemoattractant Dosing and Time on Cell Recruitment... 43
2.3.4 Persistence of Alginate on M N Application to Skin... 46
2.3.5 Sampling Microneedle Characterization, Insertion and Sampling In Vivo... 48
2.4 Conclusions... 50
3 ADJUVANT AND ANTIGEN TOGETHER ELICIT RECRUITMENT OF ANTIGEN-SPECIFIC CELLS AND RESIDENT M EMORY T CELLS... 52
3.1 Introduction... 52
3.2 M aterials and M ethods... 55
3.2.1 M aterials and Animals ... 55
3.2.2 Intradermal Injection of Adjuvant Based Studies... 56
3.2.3 Ear Tissue Digestion... 56
3.2.4 Synthesis of ICM Vs... 56
3.2.5 Immunizations... 57
3.2.6 Sampling M N Preparation ... 57
3.2.7 OVA-specific IgG titer ELISA ... 57
3.2.9 Characterization of Samples from Sampling MNs ... 58
3.2.10 MuSIC (Multispectral Imaging Cytometry) ... 58
3.2.11 Statistical A nalysis... 59
3.3 Results and Discussion ... 59
3.3.1 Confirmation of APC Hypothesis via MuSIC ... 59
3.3.2 Delayed Type Hypersensitivity Test Based Sampling... 63
3.3.3 Cell Recruitment into MNs with Adjuvants and CXCL 10 ... 64
3.3.4 Encapsulation of Adjuvant in ICMVs Elicits Increased Recruitment ... 66
3.3.5 Confirmation of Resident Memory T Cells in Tissue... 68
3.3.6 Optimized Sampling Conditions: Antigen Dose and Time of Application... 70
3.3.7 Antigen is Required to Signal for Recruitment of Antigen-Specific Cells... 73
3.3.8 Testing of Possible 'Immunization' via Sampling MNs... 75
3.3.9 TRM Sampling in Vaccinia-SIVgag Infection Model... 76
3.3.10 Antigen-Specific Cell Recruitment at Long Times ... 80
3 .4 C on clu sion s... 8 1 4 SAMPLING MICRONEEDLES FOR BIOMARKER EVALUATION... 84
4 .1 Introdu ction ... 84
4.2 Materials and Methods... 86
4 .2.1 M aterials ... . . 86
4.2.2 Animals and Immunizations ... 87
4.2.3 ISF Sample Collection from Sampling MNs... 87
4.2.4 ISF Volume Determination... 87
4.2.5 Total IgG and OVA-specific IgG Titer ELISA ... 88
4.3 Results and Discussion ... 88
4.3.1 ISF Collection via Sampling MNs... 88
4.3.2 Quantification of Antigen-Specific IgG... 90
4 .4 C on clu sion s... 9 1 5 CONCLUSIONS AND FUTURE DIRECTIONS ... 93
5.1 Summary of Key Results in this Thesis... 93
5.2 Future D irections ... 95
6 A PPEN D IX ... 9 8 6.1 Protocol for Fabrication of Sampling Microneedles... 98
6.2 Protocol for ICMV Synthesis ... 99
6.3 Protocol for Sampling Microneedle Application and Processing... 100
6.3.1 MN Application onto Ear... 100
6.3.2 MN application onto Dorsal Flank ... 101
6.3.3 MN Retrieval and Extraction of Cell & ISF Sample ... 101
6.4 Tail-skin Scarification using Vaccinia-SIVgag virus ... 102
6.5 Staining for Flow Cytometry ... 102
6.6 Protocol for Total IgG Measurement via ELISA... 103
6.7 Protocol for Ova-Specific IgG Measurement via ELISA ... 104
6.8 Protocol for Fluorescent Labeling of Alginate ... 105
6.9 Gating Strategy for Flow Cytometric Analyses... 107
LIST OF FIGURES
Figure 1-1: Memory cells and their role in an immune response. (A) NaYve T cells are activated by pathologic infections and differentiate into effector or killer T cells. Activated T cells
clonally expand in response to particular antigens (expansion phase). After pathogen clearance, high proportions of the expanded antigen-specific T cells undergo apoptosis (contraction phase). Some population of the surviving antigen-specific T cells is maintained as memory T cells (memory phase). Adapted from 5. (B) Function of TRMs in the event of pathogen exposure. Adapted from 6... 19
Figure 1-2: Anatomy of the skin and immune cells found in the skin. Adapted from2. ... 20
Figure 1-3: Immune monitoring in vascularized composite allotransplantation. Areas marked
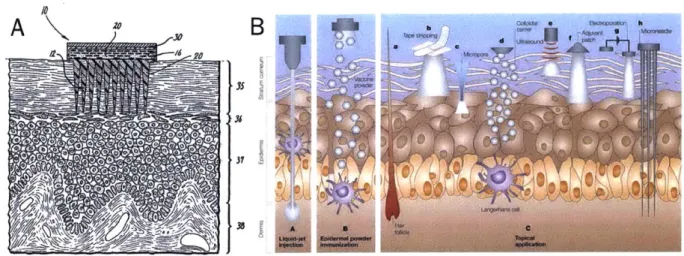
out for punch biopsy using blue ink on the allografted facial tissue (A) and sentinel hand flap (B). Biopsied tissue is seen on the tip of the tweezer (C). The biopsy cavity (3mm diameter, 7-8 mm deep) is closed via suture... 23 Figure 1-4: Schematic of MNs and their interaction with the dermis and epidermis. (A)
Schematic showing the earliest rendition of MNs, piercing the stratum corneum to deliver drugs into the skin transdermally, adapted from 60 (B) Schematic showing MNs "h"
entering the viable dermis, as compared to other transdermal delivery methods, adapted
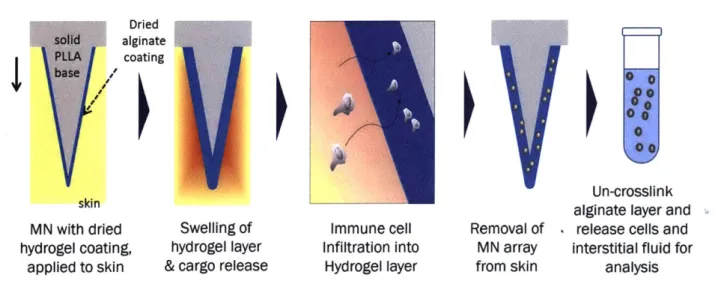
from 61. ... ... 25 Figure 2-1: Schematic of working of sampling MNs for cell and ISF sampling... 28 Figure 2-2 Schematic of method of fabrication of sampling (alginate coated) MNs. (a) MNs
were fabricated by melt-molding poly-L-Lactide into PDMS molds (b) PLLy was added for 30 minutes, removed and (c) dried. (d) Sucrose-alginate solution was added and dried under vacuum. (e) Calcium solution was added and dried under vacuum. (f) The resulting sampling MNs were stored under vacuum before (g) application to skin. ... 32
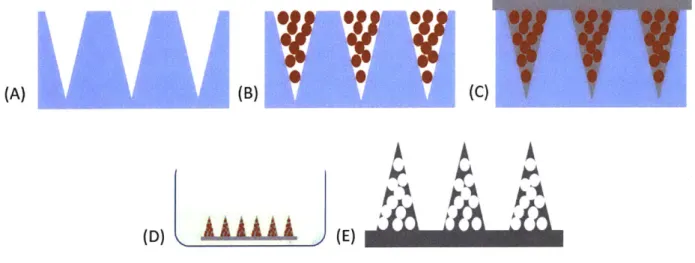
Figure 2-3 Schematic of fabrication of porous MNs. Microspheres are centrifuged into PDMS
molds (A) & (B). PLLA is melt-cased into PDMS mold (C) and de-molded MLNs are leached via immersion in ethyl acetate (D), producing porous MNs (E). ... 34
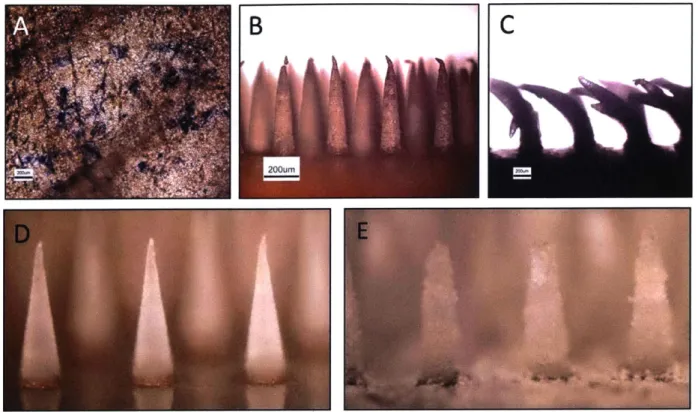
Figure 2-4 Porous MNs perform poorly upon insertion into murine ear skin. Murine ear skin
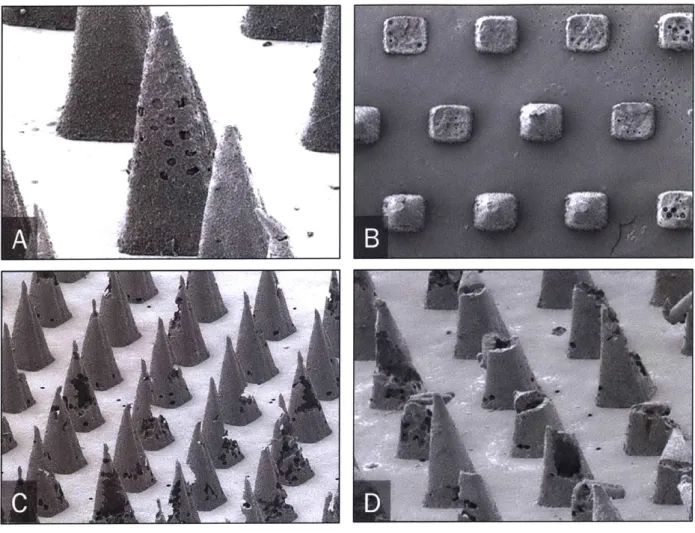
stained with Trpan Blue after insertion test (A) with porous PCL MNs viewed via optical micrography before (B) after insertion test (C). Conical PLLA MNs before (D) and after leaching (E) w ith D M F ... 35 Figure 2-5: Porous MNs pre and post insertion into murine skin, as viewed by scanning electron microscopy. PLLA with PMMA beads leached with ethyl acetate (A) and acetic
acid (B). PLLA MNs with polystyrene microspheres after leaching with ethyl acetate (C) and after insertion into mouse ear tissue (D). Scale bar: the distance between the centers of the bases of adjacent micorneedles is 500pm ... 36
Figure 2-6: Fabrication of chemokine loaded sugar-glass-reinforced porous MNs. (A) Sucrose solution with chemoattractants is dried overnight on porous MN array, yielding (B) sugar-glass-reinforced porous MNs, (C) Skin application, dissolution of sucrose layer, release of chemoattractant cargo, and chemotaxis of cells into porous MNs, followed by
(D) Porous MN array containing collected cells removed from skin. ... 37 Figure 2-7: Sucrose-glass reinforced porous MNs do not provide reproducible results for interconnected porous networks and mechanical integrity. Brightfield images of
as-fabricated solid MNs prior to PMMA porogen etching (A), after porogen dissolution (B), and after sucrose over-coating (C). (D) Optical micrograph of trypan blue-stained murine skin following application of sucrose-reinforced MNs revealing the pattern of stratum corneum penetration following MN patch application. Scale bars for (A)-(D) are 100 pm. (E, F) SEM images of porous MNs prior to sucrose coating showing pores on exterior MN
surfaces. Scale bars are 10 pm. (H, I, J). Optical micrographs of MNs post murine-skin insertion test. Each MN at the base is 250pm wide... 38 Figure 2-8: Crosslinking of alginate with calcium ions. (A) Calcium ionically crosslinks alginic
acid chains93 (B) Strategy for internal crosslinking of hydrogel layer with alginate
microspheres acting as calcium reservoirs to crosslink the surrounding alginate chains. 39
Figure 2-9: Choice of alginate via study of swelling behavior. Difference in wet (swollen state)
weight to dry weight, as a percentage of the dry weight giving the swelling ratio for different compositions of alginate (concentration in w/w% in PBS) and strength of crosslinking via calcium chloride (concentration in w/w% in water)... 41
Figure 2-10: Optimization of alginate coating composition. (A) Basal infiltration of cells nto
gels of low (75,000 g/mol) and high (200,000 g/mol) molecular weight (without adjuvants or chemoattractants added), at 1% and 2% w/w of gel when subcutaneously injected under the dorsal flanks of EFGP mice. (B) Elastic modulus of the same gels as measured by AFM.
(C) Comparison of number of cells infiltrated into gel using high MW gel 1%, with
(hatched bars) and without (solid bars) the presence of chemoattractants CCL21 and
CXCL 10, using the subcutaneous gel injection model. (D) Confocal micrographs showing
infiltration of cells with the presence of chemoattractant CCL21. ... 42
Figure 2-11: Effect of chemoattractant dosing and time on cell recruitemnt (A) and (B) show
the effect of time on infiltration of CD8, CD4 and Memory CD4 T cells and CD44+ memory cells at 4 pg of CCL21 and CXCL10. 1% High molecular weight gels were injected subcutaneously into the dorsal flanks of C57BL/6 mice. Gels were retrieved at indicated times and analyzed using flow cytometry. (C) and (D) show the effect of dose of chemoattractants CCL21 and CXCL 10 on gels retrieved at 48 hours... 44
Figure 2-12: Subcutaneously injected gels majorly comprise of macrophages. Phenotypical
analysis of cell infiltrate using flow cytometry of alginate gels (1mg, SLG100) when injected underneath the dorsal flank of C57BL6 mice with (varying doses) or without
CXCL 10 ("blank") for 12, 24 or 48 hours... 45
Figure 2-13: Fraction of CCL21 and alginate present on the surface of MN at various times post application to mouse flank skin as measured by IVIS (A) before (pre) and after
application (post app) and quantified (B), by normalizing to initial radiance... 47
Figure 2-14: Various methods of crosslinking the alginate to confer heightened persistence of alginate layer upon application to skin. (A) Fraction of radiance as detected by IVIS on MN surface for CCL21 and alginate after 8 hours of application, as compared to initial
radiance pre-application to skin. (B) Ratio of alginate to CCL21 signal retained on MN surface post 8 hours of application to skin... 47
Figure 2-15: Morphological characterization of alginate coated sampling MNs. (A) Confocal
micrograph showing conformal coating of MNs (shown in top view) and co-localized cargo (green) and alginate (red) on MN surface. (B) Thickness and roughness of dried alginate films via profilometry on silicon substrate. (C) Confocal micrograph showing porous nature of alginate coating on the surface of a single MN. (D) Trypan blue stain of mouse
ear tissue showing effective penetration of MNs. (E) and (F): Optical micrographs showing cell-sampling MNs before and after application to C57BL6 mouse ears... 49
Figure 2-16: CCL21 containing sampling MNs show recruitment of cells upon application to murine ear skin. (A) Non-applied sampling MN, (B) alginate coated MN applied to EGFP
mouse eear without CCL21 and (C) with CCL21. ... 50
Figure 3-1: Schematic showing the hypothesized difference in mechanism of cell recruitment via chemoattractants and adjuvants, when released from sampling MNs.
Chemoattractants create a gradient that cells respond to and migrate towards regions with higher concentrations of chemoattractant. Adjuvants often agonize nearby cells, often being TLR agonists themselves, and cause the distressed cell to release chemoattractants which causes other cells of interest to migrate towards the region of chemoattractant p ro du ctio n . ... 53 Figure 3-2: Variegation of TRM phenotypes in different tissue sites. Expression of the TRM markers CD69 and CD 103 on CD4+ and CD8+ TEM (effector memory T cell) populations in tissue sites (indicated on horizontal axis) is depicted by proportion of CD69+ based on position on the vertical axis, and proportion of CD103+, indicated by colored shading of each cell type (ranging from yellow = 0% to deep red/brown = 100%). CD69 is absent on
circulating cells and is progressively upregulated on T EM with the highest expression levels seen in mucosal sites. CD 103 expression is highest in CD8+ TEM in mucosal tissue sites and mucosal-draining lymph nodes with variable expression by CD8+ T EM in other tissues, and CD4+ TEM exhibit low or negligible CD 103 expression. Adapted from 1. ... 54 Figure 3-3: Schematic of Sampling MN platform. Hydrogel-coated MNs contain
immunostimulatory ICMV nanocapsules (red). Upon application to skin, the hydrogel layer swells and releases chemoattractant. (2) APCs home into the gel layer from surrounding tissue, (3) Take up ICMVs and are thus stimulated to (4) recruit antigen-specific T cells into the gel. (5) The platform is removed from skin, and (6) the gel is digested to retrieve collected cells and ISF for further analysis. ... 60 Figure 3-4: Characterization of MN infiltrate and confirmation of APC hypothesis via MuSIC. Groups of OVA-immunized mice (n=3/group) were sampled with sampling MNs
containing 5 pg of polyl:C, and 2 ptg OVA-Alexa Fluor555 and 5 yRg Pam3Cys inside ICMVs containing DiD, for 24 hours, followed by retrieval, antibody stanining and phenotypic analysis via MuSIC. Cell numbers (A) as a proportion of CD45+ immune cells (B) recruited into sampling MNs applied for 24 hours onto OVA-immunized mice. (C) Micrographs showing overlay of fluorescent channels for live/dead dye Sytox, CD45, CD3,
CD19, CD1 ic, DiD (ICMV) and OVA-Alexa Fluor 555, showing the prsence of antigen
presenting cells containing ICMVs. The edges of each well are 50 pm... 61
Figure 3-5: Cell sampling MNs allow detection of cellular immune responses. Groups of
OVA-immunized or naYve C57Bl/6 mice (n=8/group) were injected intradermally in the ear at time zero with 2 pg OVA and 5 ig each of polyl:C and Pam3Cys. 60 hours later, sampling
MN were applied to the same site for 12 hr, followed by retrieval for flow cytometry
analysis. (A) Timeline of immunization and sampling. (B) Flow cytometry plots showing OVA-specific CD8+ cells in naYve and immunized mice, as sampled from blood or with cell-sampling MNs, staining for CD8 and OVA-specific cells (using OVA peptide-MHC streptavidin tetramers). (C) OVA-specific (SIINFEKL+) cells as a percentage of total
CD8' cells quantified via flow cytometry. Shown are means s.e.m., ns, nonsignificant,
****, p < 0.0001, analyzed by one-way ANOVA, followed by Tukey's HSD. ... 63 Figure 3-6: Cell recruitment into MNs with adjuvants and CXCL1O. 7wk old C57BL/6 mice
were injected intradermally in their ears with adjuvants. Mice were euthanized 48 hours later and ears were digested and analyzed using flow cytometry for infiltrating populations including CD1 1b'CD1 lc- leukocytes (A) and CD8a' leukocytes (B). Live cells recruited into subcutaneously injected gels under the dorsal flank of naive C57BL6 mice for 24 hours, with and without presence of adjuvants Pam3Cys and polyl:C (C). Cell-sampling MNs, including adjuvants in the coating, were applied for 12 hours on the ears of naive
C57BL/6 mice. The alginate coatings on the MNs were digested and analyzed using flow
cytometry for infiltrating cell populations including total leukocytes (CD45+) (D) and total T cells (CD3e+) (E). "Non app" is a control MN array that was not applied to the skin, and represents the background noise of the measurement. Data sets represent mean s.e.m., *,
p < 0.05 and **, p < 0.01, analyzed by one-way ANOVA, followed by Tukey's HSD. .65 Figure 3-7: ICMVs encapsulating antigen and adjuvant, when embedded in the alginate layer of sampling MNs, elicit increased recruitment of cells into sampling MNs.
Groups of 8-10 wk old naive C57BL/6 mice (n=8/group) were sampled for 12 hours using sampling MNs containing adjuvant (5 tg Pam3Cys) in either soluble of ICMV encapsulated formats, with 5 pg poly I:C included in soluble form in the alginate coating.
(A) Live cells retrieved, per MN array. "Non app" is a control MN array that was not
applied to the skin, and represents that background noise of the measurement. (B) Live cells retrieved upon sampling C57BL/6 mice for 12 hours with sampling MNs containing ICMVs containing Pam3Cys incorporated in the crosslinking/outside/surface layer recruit more cells than those placed 'inside' in the alginate layer. (C) and (D): Confocal micrographs of ICMVs containing fluorescent OVA (red) encapsulated in ICMVs within in fluorescently tagged alginate (blue) as prepared by including the ICMVs in the alginate solution, or in the calcium crosslinking solution, respectively. Data sets represent mean s.e.m., ***, p < 0.001, analyzed by one-way ANOVA, followed by Tukey's HSD... 67
Figure 3-8: TRM characterization in the blood and skin compartments in OVA-immunized mouse model. Groups of OVA-immunized mice (n=3/group) were bled, euthanized and
their ears were digested and analyzed via flow cytometry. (A) Flow cytometric plots showing gating strategy for characterizing T RM S in blood and digested ear tissue from
C57BL6 mice that are naIve ("Nafve Blood", "Nafve Ear") or were immunized ("Imm.
Blood", "Imm. Ear" with OVA. OVA tetramer (SIINFEKL) (B) and antigen-specific TRM s (C) as a frequency of CD8' cells. (D) and (E) show CD69' and CD103' cells as a frequency of all live cells. Data sets represent mean s.e.m., ****, p < 0.0001, analyzed
by one-way ANOVA, followed by Tukey's HSD... 69 Figure 3-9: Optimal parameters for sampling of TRMs. Groups of OVA-immunized mice
(n=5/group) were sampled with sampling MNs with or without 0.02 pg, 0.2 pg or 2 pg OVA, applied to mouse ears for upto 24 hours to optimize the duration of application and dose of antigen for sampling. (A) Sample flow cytometry plots showing staining for CD69 and CD103 in blood and cell-sampling MN samples. (B) Timeline of timing optimization experiment. (C), (D), (E) and (F): Live cells, CD8+ cells, CD8+CD69+CD103+ TRMs and OVA-specific CD8+ T RM s, respectively, per sampling MN array, from sampling MNs applied to naive or OVA-immunized C57BL/6 mice to study effect of duration of application on recruited cell numbers. (G), (H), (I) and (J): Live cells, CD8+ cells,
CD8+CD69+CD103+ TRM s and OVA-specific CD8+ TRM s, respectively, per sampling
MN array, from sampling MINs containing ICMVs encapsulating 0.02ug, 0.2ug and 2ug
OVA to study dependence of recruited cell numbers on antigen level. Data sets represent mean s.e.m., *, p<0.05, **, p<0.01, ***, p < 0.001 and ****, p < 0.0001 analyzed by
one-way ANOVA, followed by Tukey's HSD ... 71 Figure 3-10: Antigen stimulus is required for the sampling and recruitment of antigen-specific cells via sampling MNs. Groups of OVA-immunized mice (n=5/group) were
sampled 11 weeks post boost for the presence of T RM S with sampling MNs containing no or 2 pg of OVA, applied for 24 hours, retrieved and analyzed via flow cytometry. (A) Timeline of immunization and sampling. (B), (C), (D), (E) and (F) Live cells, CD8+ cells, tetramer+CD8+ cells, T RMs and OVA-specific CD8+ T Rm s, respectively, per sampling
MN array, from cell-sampling MNs containing no antigen (open circles) and 2ug OVA
encapsulated in ICMVs incorporated in MN coating (filled circles). Data sets represent mean s.e.m., **, p<0.0I and ***, p < 0.001, analyzed by one-way ANOVA, followed by
T ukey 's H SD . ... 74
Figure 3-11: Sampling MNs do not change the immune status, as seen by monitoring levels of antigen-specific cells in blood post sampling. Groups of naive or OVA-immunized
mice (n=5/group) were sampled with sampling MNs containing 2 ptg of OVA, applied for 24 hours, retrieved and analyzed via flow cytometry. Frequencies of OVA-specific CD8+ T cells from blood in naYve (open circles) and previously immunized (filled circles)
C57BL/6 mice, post sampling MN application at day 0 and boost on day 24. Data sets
represent mean s.e.m., ****, p < 0.0001 analyzed by two-way ANOVA,... 75 Figure 3-12: Dose titration studies in a vaccinia-SIVgag virus tail-skin scarification infection mouse model. Groups of C57BL/6 mice (n=5/group) were infected via tail-skin
scarification with vaccinia-SIVgag virus and monitored. (A) Photographs of skin lesions and swelling region post tail-skin scarification of C57BL6 mice Adapted from 149. (B) Swelling, (C) lesion size and (D) body weight (normalized to average weight of group on day 0) post tail-skin scarification with 2x10⁵, 1x10⁶ and 2x10⁶ PFU of vaccinia-SIVgag
v iru s... 7 7 Figure 3-13: T RM characterization in the blood and skin compartments in vaccinia-SIVgag
virus tail-skin scarification mouse model. Groups of C57BL6 mice infected with 2x1 06
PFU of vaccinia-SIVgag virus via tail skin scarification (n=5/group) were bled, euthanzied
and ear tissue was resected and digested to confirm presence of antigen-specific T RM S.
Flow cytometric plots showing gating strategy for characterizing TRM S in blood and digested ear tissue. ... 78 Figure 3-14: T RM sampling in vaccinia-SIVgag tail-skin scarification infection mouse model. Groups of C57BL6 mice infected with 2x10⁶ PFU of vaccinia-SIVgag virus via tail skin
scarification (n=5/group) were sampled 11 weeks post infection with sampling MNs containing 2 ptg AL 11 peptide, and 5 ptg each of polyl:C and Pam3Cys, applied to mouse ears for 24 hours, retreived and analyzed via flow ctyometry. (A) CD8+ cells, (B) T RM
(CD8+ CD69+ CD103+) cells and (C) SIVgag-specific (SIVgag Tetramer+) TRM sampled
from 100 L blood (red circles) and sampling MNs (black circles) (D) SIVgag-specific (SIVgag Tetramer+) cells, (E) TRM and (F) SIVgag-specific (SIVgag Tetramer+) TRMs as a frequency of CD8+ cells. Data sets represent mean + s.e.m., ns, nonsignificant, **,
Figure 3-15: Sampling MNs consistently recruit higher proportion of antigen specific cells as compared to peripheral blood draws. Antigen-specific cells as a frequency of CD8+
leukocytes as queried by sampling MNs (black circles) and from peripheral blood (red squares) over long times (A) post immunization in an OVA-immunized mouse model and (B) post infection in a tail-skin scarification with vaccinia-SIVgag virus mouse model. Data sets represent mean s.e.m., ****, p < 0.000 1 analyzed by two-way ANOVA,... 81 Figure 4-1: Distribution of proteins found in suction blister fluid and serum. (A)
Venn-diagram of overlapping proteins found (percentages and numbers) both in suction blister fluid and serum and proteins uniquely found in one of the two matrices. Data obtained from 2-D-HPLC MS/MS. Numbers of proteins detected are given between parenthesis and as a percentage. (Minimal protein ID probability: 99%, number of uniquely detected pep- tides: at least 2,minimal peptide ID probability: 95%.) (B) Logarithm of the ratios between the uniquely detected peptides per protein found in suction blister fluid and serum. Higher ratios than 10 or lower than 0.1 were set at 10 and 0.1, respectively. Adapted from 40. .. 84
Figure 4-2: Accessing suction blister fluid. (A) Suction chamber during the development of blisters; (B) puncture of blisters and collection of suction blister fluid. Adapted from 40 85 Figure 4-3: Quantification of ISF. (A) Quantification of collection of ISF by comparison of
weights of dissected ears (blank and blue bars) and alginate layer weight (orange bar). MNs were applied to the ear tissues for 5 mins or 30 mins (solid and diagonally hatched bars respectively). (B) Quantification of total IgG titer measured by ELISA obtained from digested sampling MNs used to collect ISF from mouse ears and flanks. (C) Concentration of total IgG protein in ISF obtained from mouse flanks and from serum. *p <0.05, analyzed
by one-way ANOVA, followed by Tukey's HSD for multiple comparisons... 90 Figure 4-4: Quantification of OVA-specific IgG obtained from ISF via sampling MNs.
Ova-specific IgG can be quantified from ISF collected from sampling MNs, applied for 24 hours on ear skin of C57BL6 mice immunized with ovalbumin. **p < 0.01, ****, p < 0.0001, analyzed by one-way ANOVA, followed by Tukey's HSD for multiple comparisons.... 91
Figure 6-1: Schematic of method of fabrication of sampling (alginate coated) MNs. (a) MNs
are fabricated by melt-molding poly-L-Lactide into PDMS molds (b) PLLy is added for 30 minutes, removed and (c) dried. (d) Sucrose-alginate solution is added and dri ried under vacuum. (f) Resulting sampling MNs are stored under vacuum before (g) aplication to skin.
... 9 8 Figure 6-2: Sample serial flow cytometry gates for blood and MN samples (Gates are seq u en tia l)... 10 7 Figure 6-3: Flow cytometric plots showing skewing of antigen specific (ALit Tetramer+ CD8+) population in samples obtained vis sampling MNs, as compared to blood and sampling MNs containing no adjuvant and no antigen... 107 Figure 6-4: Flow cytometric plots showing skewing of resident memory T cells (CD69+CD103+) population in samples obtained vis sampling MNs, as compared to digested ear tissue and blood. ... 108 Figure 6-5: Non-applied sampling MN control for live cell gate and fluorescence Minus One (FM O) Controls based on blood sam ples... 108
LIST OF ABBREVIATIONS
APC Antigen Presenting Cell
DTH Delayed-Type Hypersensitivity
ICMV Inter-bilayer Crosslinked Multi-lamellar Vesicle
ISF Interstitial Fluid
MN Microneedle
MuSIC Multispectral Imaging Cytometry
OVA Ovalbumin
PLLA Poly-L-lactide
PLLy Poly-L-lysine
TLR Toll-Like Receptor
Chapter One
INTRODUCTION
1.1
The Immune System and Immune Response
Our body is under constant attack from various elements present in its environment
-microbial pathogens, viruses, and various chemical and physical factors. The body's immune system, comprising many biological structures and processes, plays a crucial role in defending and protecting the body against disease. The immune system has two main subsystems: the innate and the adaptive immune systems. Components of the innate immune system are present at barrier tissues such as the skin, gut, lungs, and other organs with mucosal linings that face continuous insults from the environment. They mainly protect against infection, in a non-specific manner of response, via cell mediated and humoral components. The innate immune system has no immunological memory and each exposure to pathogen leads to an immediate maximal response. It consists of the complement system and innate leukocytes such as natural killer cells, mast cells, eosinophils, basophils, phagocytic cells including macrophages, neutrophils, and dendritic cells, which identify and eliminate pathogens that might cause infection. The adaptive immune system, on the other hand, acts in slower manner, taking between 24-72 hours to mount a specific, tailored response against a particular antigen. It consists mainly of B cells and T cells that interact to provide and form antigen-specific responses, which, after their initial formation, retain the ability to mount tailored responses due to their immunological memory for the specific antigen.
The lymphatic system, which is part of the circulatory system, consists of lymphatic organs and a vast network of lymphatic vessels that form the roads using which immune cells are transported. Primary or central lymphoid organs (thymus and bone marrow) are the creation sites of lymphocytes and early, immature progenitor cells. Immature naYve T cells undergo maturation in the thymus where those cells that are unable to differentiate "self' from "non-self' antigens undergo apoptosis. Secondary or peripheral lymphoid organs, including lymph nodes and the spleen, mainly consist of mature nafve lymphocytes, and are the sites at which an adaptive immune response is initiated via lymphocyte activation by antigen presentation. Non-lymphoid or
peripheral tissues such as skin and intestine have previously been considered only as passive-barrier layers. However, in recent years, it has been shown that antigen-specific memory cells specifically home to and reside in peripheral tissue to confer long lasting immunity, for many years, at the most probable sites of invasion." To better understand the formation of and importance of these memory cells in peripheral tissues, we will now outline the timeline of the immune response.
A
Ex.nsion
Contction
Time after infection
TRM MAY INTERCEPT PATHOGENS AT SITES OF EXPOSURE
Time after reinfection
Infected barrier
L JI*
tissue Lympho node I I I Infected barrierL tissue Lymp nodeUpon reinfection, Tm must wait for antigen to access the lymph node before reactivation. Reactivated Tm proliferate, redifferentiate into effectors, then migrate to sites of Infection.
Tw are poised for Immediate pathogen interception and rapid effector function at sites of
infection.
Activated T,, also recruit memory T cells to sites of infection (not Illustrated).
I'
S
I-:
B
Figure 1-1: Memory cells and their role in an immune response. (A) NaYve T cells are activated by pathologic infections and differentiate into effector or killer T cells. Activated T cells clonally
expand in response to particular antigens (expansion phase). After pathogen clearance, high proportions of the expanded antigen-specific T cells undergo apoptosis (contraction phase). Some population of the surviving antigen-specific T cells is maintained as memory T cells (memory phase). Adapted from 5. (B) Function ofT RMs in the event of pathogen exposure. Adapted from 6.
An immune response is mounted upon pathogen or antigen encounter, most likely at the site of entry, which may be a skin wound, lesion, or breakage in the continuity of a barrier tissue. Epithelial barrier cells and resident innate immune cells express pattern-recognition receptors that recognize specific pathogen components and can trigger downstream activation cascades. Activation of dendritic cells through the activation of toll-like receptors (TLRs) expressed on innate cells results in the increased production of pro-inflammatory cytokines, antimicrobial peptides, increased nitric oxide synthesis, enhanced bacterial killing and increased antigen presentation.7,8 Antigen presenting cells (APCs) pick up antigens and which traffic to draining lymph nodes where mature, nafve T cells are encountered. As shown in Figure 1-1, this leads to clonal expansion, affinity maturation, recirculation of the activated effector lymphocytes to the site of infection or pathogen encounter.9"0 This effector population contracts after the resolution of the infection to a stable memory population of intermediate frequency 1-17 in the form of
recirculating central memory T cells (T cm) and effector memory T cells (TEM) which are excluded from many epithelial surfaces. However, some of these memory cells reside in peripheral tissues as terminally differentiated cytotoxic resident memory T cells (T RM s), poised for immediate attack
and interception of their specific cognate antigen, upon re-exposure.18 In the next Section we shall specifically discuss the role of the skin in the immunological context.
1.2 Skin as an Immune Organ
The skin in a human adult comprises around 20 billion memory T cells, nearly twice the number of T cells in circulation.'9,20 Though it is the largest and most exposed interface of the body with the environment, until recently, the skin was thought to serve as a passive barrier between the host and an environment that presents constant challenges in the form of microbial pathogens, chemical and physical intrusions, and radiation. The skin, in fact, presents the first line of defense against many such pathogenic encounters and, in recent years, has been greatly appreciated for its central role in defending the body.21
1 erm aaliy differentiatirg Comeocyte keratinocyte c.r I- euT CD8 MelnocyteBasap asemen ~
Od
~Q
~ tasaleT cell keratinocyte ebrane
CD4 T,2 cell
*ibrobast
CDC Tl cell CD4 TJ17 cell Dermis
Lymphatic vessel
(11)
Blood vessel®
T cell NKT cell Mast cell MacrophageFigure 1-2: Anatomy of the skin and immune cells found in the skin. Adapted from22.
Human skin has two main compartments: the epidermis and the dermis (Figure 1-2), both of which feature many players of the innate and adaptive immune system. The epidermis consists of the stratum basale, the bottommost layer of the epidermis, which is a perennially differentiating single layer of keratinocytes. As these keratinocytes differentiate, they move up the epidermis, changing morphology and function in the stratum spinosum and the stratum granulosum until they reach the very top layer of the stratum corneum. Dead keratinocytes are packed in a brick-and-mortar like structure to form the outermost layer of the epidermis, protecting the body from toxic agents and dehydration.23 Melanocytes, skin-resident APCs (Langerhans cells), and cytotoxic
CD8+ T cells can be found in the epidermis. The thickness of the stratum corneum varies between 10-30 ptm and the epidermis varies between 50-110 gm, depending upon the body site and
pigmentation.2 4 The dermis is composed of collagen and elastic tissue, and consists of many
specialized cells, especially dendritic cell subsets including dermal DCs and plasmacytoid DCs, T cell subsets including CD4+ T helper 1 (THI 1), TH2 and TH 17 cells, 76 T cells and natural killer T cells , macrophages, mast cells and fibroblasts. The dermis also features blood capillaries,
lymphatic vessels and nerves. The dermis is between 1.5 - 4 mm thick.
Because of the heavy presence of immunological components, the skin presents an attractive and easily accessible immunological site for the delivery of vaccines,2 5 as has been
explored in our research groups in the recent past.26,2 7 In conjunction, so vital is the immunological
role of the skin in the maintenance of homeostasis that for patients receiving immunosuppressive therapy after organ transplantation or as a treatment for genetic and acquired immunodeficiency disorders, there is a marked increase in the severity and frequency of cutaneous malignancies and infections.28,29
1.3 The Need for a Novel Immune Monitoring Method
The methods used to access to fluid compartments of the body today for the purposes of diagnosis and monitoring fall into three categories: (i) invasive (in which a break in the skin is created, or there is contact with mucosa, or other internal body cavities beyond a natural or artificial body orifice, such as via traditional phlebotomy using venipuncture), (ii) minimally-invasive (featuring minimal damage of tissues at the site of entry of instrument(s), such as saliva swabs obtained from the inner lining of the cheek) and, (iii) non-invasive (in which no skin-break or mucosal-contact occurs, such as urine collection).
The field of immune monitoring is mainly dominated by analysis of blood draws, a practice that has been reported for millennia30, in which systemically circulating blood is drawn from a vein, typically in the arm. In recent decades, immune monitoring by flow cytometry on peripherally sampled blood has become the standard method for immunophenotyping. 13 2
However, systemically circulating blood does not feature the many important immune cell populations, as discussed previously, which preferentially reside in peripheral tissues including the skin, the gut and other mucosal linings. One widely used method to query the skin is via delayed-type hypersensitivity (DTH) tests33,34 such as the Mantoux test35 and allergen patch tests,36,3 7 which
example, in the case of the tuberculin Mantoux test, the tuberculin antigen is initially injected into the dermis and the skin is monitored for the next 2-3 days for the development of an induration, which classifies as a mounted immune response. It has been shown that the cells that respond to these injected stimuli are both central memory and effector memory cells which traffic to the site of antigen deposition, as well as skin-resident antigen-specific T cells.38 However, these methods remain qualitative and fail to offer quantitative information about the phenotypical and functional aspects of the cell infiltrate. There exist invasive methods of sampling and accessing non-recirculating immune cell populations from lymph nodes39 or from skin 0 but these are apparatus intensive and require special training for use. Additionally, in the contexts of (i) immunosuppression given to patients with genetic and acquired immunodeficiency disorders, and (ii) organ transplants and, (iii) vaccine development, assessing the immune status of the skin or related peripheral organs, which are not queried by blood draws, in a minimally invasive manner, is an unsolved problem.
We shall now proceed to highlight some specific needs in the medical field that would benefit from a sampling method capable of accessing immune cell populations not found in systemic circulation.
1.3.1 Case Study on Immune Monitoring in Organ Transplantation
Solid organ transplantation, despite continued improvement in its clinical management, still faces challenges due to infectious complications.41 Since patients who have undergone organ transplants, are on a strict immunosuppression regimen, they are not only susceptible to infections due to the lowered efficacy of their own immune system but are also at the risk of potentially rejecting the organ. Both of these factors require these individuals to be frequently monitored, especially for the status of their immune system. To illustrate this need further, we consider the case of skin-based allotransplants and the niche and new field of vascularized composite allotransplantation,4 2-4 4 in which multiple tissues are transferred from donor to recipient as a single
functional unit. In the specific case of face transplants,45 patients are continually monitored via invasive punch biopsies at the graft margin to test for transplant rejection periodically. These biopsies are analyzed via histological staining, a method that is impractical and cumbersome, and creates a lot of waste in the process of obtaining the biopsy (Figure 1-3). In the specific case of skin allograft transplants, histological analysis of biopsies betrayed the role of donor and recipient
T cells in the graft.46 For many of these patients, a biopsy implies travel to a specific medical facility and often, for patients not living in the area, travel days.
A
B
Figure 1-3: Immune monitoring in vascularized composite allotransplantation. Areas marked
out for punch biopsy using blue ink on the allografted facial tissue (A) and sentinel hand flap (B). Biopsied tissue is seen on the tip of the tweezer (C). The biopsy cavity (3mm diameter, 7-8 mm deep) is closed via suture.
While non-invasive methods of monitoring using imaging have been explored,47 skin samples obtained via biopsies offer a wealth of information about the functional, phenotypical, and morphological makeup of the tissue. Thus, there is an opportunity here for a good compromise between non-invasive imaging methods and invasive biopsy methods: a minimally invasive method to 'micro-biopsy' the skin to access immune cell populations and be able to characterize them via high throughput methods.
1.3.2 Case Study on Systemic Lupus Erythematosus (SLE)
Systemic Lupus Erythematosus, commonly known as Lupus or SLE, is a collection of auto-immune diseases in which the auto-immune system becomes hyperactive and attacks healthy tissue. Lupus affects an estimated 5 billion people worldwide and presents as pain and inflammation in joints, skin, kidneys, blood cells, brain, heart and lungs.48'49 Lupus has no cure but only treatment upon diagnosis. A classic hallmark of lupus and other similar autoimmune diseases such as rheumatoid arthritis and ulcerative colitis, is that these can periodically flare up and then improve. Flares are treated by regulating the dose of medication for these patients. They cannot currently be detected and the current standard of medical care includes annual, or monthly (as deemed
necessary based on severity of disease presentation) blood work to test for antinuclear antibodies
(ANA), BILAG, FBC, ESR, CRP, urea, creatinine, electrolytes, dsDNA titer and complement C3/C4 levels, and urine, liver and kidney function tests.5 0 These tests require trained professional
to be administered and for blood to be drawn. They are time and resource intensive both, on the care provider's side, as well as the patient side. In addition, these tests do no help to predict flares but only to record the levels of analytes of interest during the given immune status of the patient. In recent years, there have been some efforts to identify biomarkers, present in blood, to predict the onset of a flare in a patient. Candidate biomarkers include Clq antibodies, anti-nucleosome antibodies and complement C4d (erythrocyte bound) found in serum or peripheral blood and MCP-1, neutrophil gelatinase-associated lipocalin, transferrin, hepcidin and tumor growth factor 0 (TGFP) found in urine, to name a few.
-So far, most of these efforts have been confined to the analysis of blood, which is cumbersome to rely on, as discussed above. There have been some reports of the implications of the cellular immune response in the skin for lupus varieties: specifically, the lack of presence of regulatory T cells in skin lesions of patients with cutaneous lupus erythematosus." Such cellular immunological implications, derived from skin in such autoimmune diseases shows promise in improving the lives of patients with these diseases since skin has the possibility being sampled minimally-invasively, as we shall discuss in Chapter 4. The gap that lies in the monitoring of such long-term autoimmune diseases, can be closed by enabling diagnosis and sampling for flare detection at home, by the patient, via a minimally invasive method for sample collection.
1.4 Microneedle-Based Systems
MN-based systems consist of an array of projections, upto a millimeter in length, and are used by the field mainly for transdermal delivery of proteins, drugs and vaccines.56 57 MNs can
penetrate the stratum corneum and access the viable dermis. However, they do not reach the nerve endings or the capillaries. Consequently, MNs provide a painless and minimally invasive method to access the immunologically rich reservoir that is present in the epidermis and dermis of the skin
(Figure 1-4). These qualities make MiNs appealing for administering drugs and vaccines in
children5
8,59 and in patients where compliance because of pain may present an issue. Chapter 2 provides a more detailed background on MINs.
/N A 0
-B
3?1 A5I40
0 WQMw
f -,
! = f',A0(M BY ILL CZFigure 1-4: Schematic of MNs and their interaction with the dermis and epidermis. (A)
Schematic showing the earliest rendition of MNs, piercing the stratum corneum to deliver drugs into the skin transdermally, adapted from 60 (B) Schematic showing MNs "h" entering the viable
dermis, as compared to other transdermal delivery methods, adapted from 61
While there have been some efforst to sample and quantify analytes using MNs, they have been limited mainly to small molecules and proteins.62-69 Thus, in this thesis we consider the use of MNs for the purpose of immune monitoring - to access immune cell populations that are currently difficult to reach, or are obtained only via invasive means.
1.5 Scope and Outline of Thesis
In this thesis, we designed immune-monitoring sampling MNs that are capable of sampling non-recirculating immune cell populations present in the skin as well as biomarkers present in collected dermal interstitial fluid (ISF).
Chapter 2 describes our efforts to fabricate sampling MNs with the requisite properties of mechanical integrity and robustness, reproducible fabrication, effective skin penetration, ability to include bioactive cell-signaling molecules in the MN sampling platform and a compartment within the platform for sample collection and retention. We optimized the physical and chemical properties of the alginate-based hydrogel used to coat the surface of the MNs, the time of application as well as the dose of chemoattractants CCL21 and CXCL10 as cell-signaling molecules to be included inside the sampling MNs platform. The sampling MN platform described
in this Chapter forms the basis of the sampling MNs used in the subsequent chapters to query specific immune cells and biomarkers from dermal ISF.
Chapter 3 expands upon our most significant body of work, providing initial proof that sampling MiNs, including adjuvants and antigen as cargo in lipid vesicles called ICMVs, elicit the recruitment and sampling of not only antigen-specific cells, but also non-recirculating skin-TRM S.
Here we first optimized the combination of adjuvants used to enhance the recruitment of cells into the sampling MNs and showed in a DTH test scenario, in an animal model featuring mice immunized with model antigen ovalbumin (OVA), that sampling MNs were comparable to blood, as body fluid compartments to sample similar proportions of CD8+ cells that were antigen specific. We then characterized the time of application and dose of antigen required to signal for the recruitment of antigen-specific TRM s. We finally showed the similar results in a second mouse model featuring mice infected with vaccinia-SIVgag virus, via a tail-skin scarification method. We also compared frequencies of antigen-specific cells obtained from peripheral blood draws and from sampling MNs, at long times post antigen exposure in both animal models. Finally, with the help of the MuSIC technology, we characterized the phenotype of the sampling MN infiltrate to explore the mechanistic steps required in cell recruitment into the sampling MNs.
Chapter 4 explores the possibility of using sampling MNs to access dermal ISF and hence, the ability to sample for and detect biomarkers found in dermal ISF. We first quantified the volume of dermal ISF we obtained with sampling MNs and proceeded to quantify the levels of immunoglobulin G as well as antigen-specific IgG in the OVA-immunized mouse model.
Chapter 5 provides an overall summary and conclusions of this thesis as well as possible future directions. The Appendix details several key methods and protocols that were developed for this work.