HAL Id: hal-01552083
https://hal.archives-ouvertes.fr/hal-01552083
Submitted on 30 Jun 2017
HAL is a multi-disciplinary open access
archive for the deposit and dissemination of
sci-entific research documents, whether they are
pub-lished or not. The documents may come from
teaching and research institutions in France or
abroad, or from public or private research centers.
L’archive ouverte pluridisciplinaire HAL, est
destinée au dépôt et à la diffusion de documents
scientifiques de niveau recherche, publiés ou non,
émanant des établissements d’enseignement et de
recherche français ou étrangers, des laboratoires
publics ou privés.
A theoretical approach for elastically driven cooperative
switching of spin crossover compounds impacted by an
ultrashot laser pulse
Cristian Enachescu, Roman Stoleriu, Masamichi Nishino, Seiji Miyashita,
Roman Stancu, Maciej Lorenc, Roman Bertoni, Hervé Cailleau, Eric Collet
To cite this version:
Cristian Enachescu, Roman Stoleriu, Masamichi Nishino, Seiji Miyashita, Roman Stancu, et al.. A
theoretical approach for elastically driven cooperative switching of spin crossover compounds impacted
by an ultrashot laser pulse. Physical Review B, American Physical Society, 2017, 95 (22), pp.224107.
�10.1103/PhysRevB.95.224107�. �hal-01552083�
compounds impacted by an ultrashot laser pulse
Cristian Enachescu∗,1 Laurentiu Stoleriu,1 Masamichi Nishino,2 Seiji Miyashita,3
Alexandru Stancu,1 Maciej Lorenc,4 Roman Bertoni,4 Herv´e Cailleau,4 and Eric Collet4
1
Faculty of Physics, Alexandru Ioan Cuza University of Iasi, Romania
2
International Center for Materials Nanoarchitectonics, National Institute for Materials Science, Tsukuba, Ibaraki, Japan
3Department of Physics, Graduate School of Science,
The University of Tokyo, Bunkyo-Ku, Tokyo, Japan
4
Univ Rennes 1, CNRS, UBL, Institut de Physique de Rennes (IPR) - UMR 6251, Rennes, France (Dated: April 30, 2017)
In this paper we use an elastic model in order to study the elastically driven cooperative switching of spin crossover materials after femtosecond laser excitation. In this model, the molecules occupy a triangular lattice in open boundaries systems and are connected by springs. The volume change of a molecule between its two possible spin states, low-spin and high-spin, determines a variation of the spring length and therefore induces elastic interactions between molecules, which propagates throughout the whole sample as elastic distortions. This model is able to reproduce the multi-step out-of-equilibrium response to ultrashort laser excitation and especially the elastically-driven cooperative response. Then this model is developed in order to predict the behaviour of the system as a function of its different physical parameters, such as the magnitude of the elastic constant or the homogeneity of the photoexcitation. The contribution of the reorganisation of the molecular states during elastic steps, leading to clusters of high-spin molecules towards edge or corners is also revealed.
PACS numbers: 75.30.Wx, 64.60.-i, 75.60.-d
I. INTRODUCTION
Spin crossover inorganic compounds are among the few systems showing bistability at a molecular scale with switchable properties by variations of temperature and pressure or by light irradiation1,2. Pulsed laser irra-diation opens the possibility to control this bistability in an ultrafast way, through strongly out-of-equilibrium conditions3–8. Their molecular switching occurs between
the paramagnetic low spin state (LS), stable at low temperatures and paramagnetic high spin (HS) state of higher entropy, stable at higher temperature. Remark-ably, not only magnetic and optical properties are dif-ferent in the two states, but also the molecular volume, being around 3% higher in the HS state due the occu-pancy of antibonding ligand orbitals in HS molecules9. This size changes during thermal conversion between LS and HS states induces elastic interactions mediated by the lattice, which, if high enough, are responsible for abrupt transitions and cooperativity phenomena. At low temperatures, such crystals can be photo-switched from the ground LS state to the long-lifetime metastable HS state. By exciting some specific charge transfer bands, with a broad band lamp or a laser, the so called Light Induced Excited Spin State Trapping – LIESST effect – occurs10,11. At long time scales, varying from
nanosec-ond to days as a function of compound and temperatures,
∗Electronic address: cristian.enachescu@uaic.ro
the metastable HS state relaxes towards the ground state by a nonadiabatic, nonradiative process, either via tun-nelling – at low temperature - or thermally activated process12. The recent experiments using femtosecond
laser for photoexcitation and the detailed analysis of the subsequent evolution of the system allowed the study of very fast dynamical phenomena and contributed to a better understanding of the behaviour of spin crossover compounds at molecular level5,13,14. Observations of
molecules in solutions or in solid compounds demon-strated that the photoswitching from the LS towards the HS states, involving both change of electronic states and molecular structural reorganization occurs within≈ 200 fs15–18. In solids, this initial photo-switching of few
molecules from LS to HS states triggers further increases of the fraction of HS molecules XHS. This elastically
driven cooperative switching of spin crossover compounds occurs due to the propagation of the elastic distortions in the medium, the superposition of which induces vol-ume expansion of the lattice. This so-called elastic step5
during the of the out-of-equilibrium response following fs laser excitation, takes place on the acoustic time scale, which corresponds to the ratio between relevant size scale of the sample and the sound velocity in the medium.
The photoresponse measured through the time evolu-tion of the fracevolu-tion XHS of HS molecules, is directly
probed by ultrafast spectroscopy. Figure 1 shows typical photoresponse to fs laser excitation of SCO nanocrys-tals of[F eIII(3− MeO − SalEen)]P F
6, which was
re-ported in detail in ref.5. It is non-linear with excitation
2 above threshold below threshold 2
FIG. 1: Experimental evidence of the elastic step. The time course of XHSfollowing femtosecond laser excitation depends on the initial fraction of photoexcited molecules. For 2% (scaled ×2) of photoexcited molecules a relaxation occurs within 1µs. For 7% a self-amplification occurs up to 27% within 1 ns during the elastic step.
LS to HS states Xhν
HS, measured at the picosecond time
scale, depends linearly on the excitation density because of the local nature of the photoswitching process and each photon switches a single molecule. When the frac-tion of photoswitched molecules from LS to HS state is below 3%, the LS ground state is recovered within∼ 1 µs. At higher excitation density the HS fraction increases. For high excitation density, the molecular swelling over-come the lattice pressure and drives its expansion, favour-ing so the HS state of higher volume. In this case a self-amplified transformation is observed and, in aver-age, up to 7 molecules are switched per photon. The additional conversion on the elastic step is then defined as ∆XHS = XHSEl − XHShν. Therefore below the
amplifi-cation threshold ∆XHS < 0, whereas above ∆XHS> 0.
Among the many models elaborated for the study of spin crossover compounds, elastic models19–23 are the
more suitable for the study of the elastic step, as they build on the common sense by which interactions between molecules are of elastic origin and stem from the size difference between HS and LS molecules. Here we use a dynamic mechanoelastic model23–25 applied for open
boundary systems in order to emulate the evolution of the system after femtosecond excitation as function of several parameters. Ab-initio models are useful for study the details of electronic and bonding states26,27, but for
studies of phase change, the mechano-elastic model and other spin-crossover elastic models have advantage. Es-pecially for the phenomena of elastic step, the combi-nation of molecular dynamics and stochastic dynamics, treated in this study, is effective. This model was briefly introduced in ref.5and in the present paper we discuss the
role of different parameters in the model and the result-ing dynamics due to two competresult-ing and opposite goresult-ing processes, namely the local relaxation and the non-local amplification.
II. THE MODEL
In the mechanoelastic model, the spin-crossover molecules are represented as rigid spheres, situated in triangular configurations in open boundary lattices and interacting through connecting springs, with the elastic constant k. The conversion between the two states, HS and LS, is accompanied by a variation of the volume of a switching molecule, producing an instantaneous elastic force in its neighboring springs, which is transferred, step by step, to all the molecules in the system, in a degree depending on their relative position form the switched molecule. Therefore, the volume and the shape of the whole system dynamically change with every molecular switch, as elastic deformation propagates through the sample.
The motion of molecules is determined by local elastic forces and is accounted by solving the following differ-ential equations for all molecules in the system, for a specific number of steps n1.
md 2x i dt2 = Fi,x− µ dxi dt md 2y i dt2 = Fi,y− µ dyi dt , (1)
where xi, yi are Cartesian coordinates of the molecule i, m is the mass of the molecule, µ is a damping constant,
and Fi,x, Fi,y the components of the instantaneous force
acting on molecule i given by the sum of the forces from the neighbouring springs:
Fi,x= ∑ neighbor springs kδrij,x Fi,y= ∑ neighbor springs kδrij,y , (2)
where δrij is the deviation of the neighbour spring j from its unstressed value. In order to study dy-namical properties of the system during a spin transi-tion within the ME model, one assigns for every spin-crossover molecule a HS → LS and a LS → HS tran-sition probability, depending on the temperature T , on intrinsic molecular parameters (the HS− LS energy dif-ference D, the degeneracy ratio g, the effective activa-tion energy EA) and on the elastic interactions between
molecules, represented here by the local pressure pi
act-ing on molecule i, defined as pi =
∑
neighbor springs
k
Aδrij, with A
the molecular cross-sectional area. These Arrhenius-type probabilities can be written as:
PHSi →LS = 1 τ exp ( −EA− κpi kBT ) (3a) PLSi →HS= 1 τ exp ( −D− kBT ln g kBT ) exp ( −EA+ κpi kBT ) (3b) where τ is a constant scaling factor, and κ a constant that relates the local pressure with the activation energy. We consider here that compressed springs produce a pos-itive pressure (favouring the LS state), while elongated springs produces a negative pressure (favouring the HS state). After a Monte-Carlo standard procedure, one de-cides if a molecule switches or not. A Monte-Carlo elec-tronic step (MCES) is completed when every molecule has been checked once, by comparing its transition prob-ability (3a) or (3b) with a random number η ∈ (0, 1). A given molecule changes its state only if this number is smaller than the corresponding probability. After each MCES, the new equilibrium positions of all molecules are found.
In order to tune the different relative time scales of spin dynamics and lattice relaxation, we define the ratio
r = n1 n2
, where n1 is the number of steps to solve
dif-ferential equations (1), with probabilities (3) fixed and
n2 is the number of MCES per n1. It should be noted
that a large r (large n1) favours equilibrium
distribu-tion, allowing to accommodate to the distribution of lo-cal pressure pi, before any such pressure is changed, as
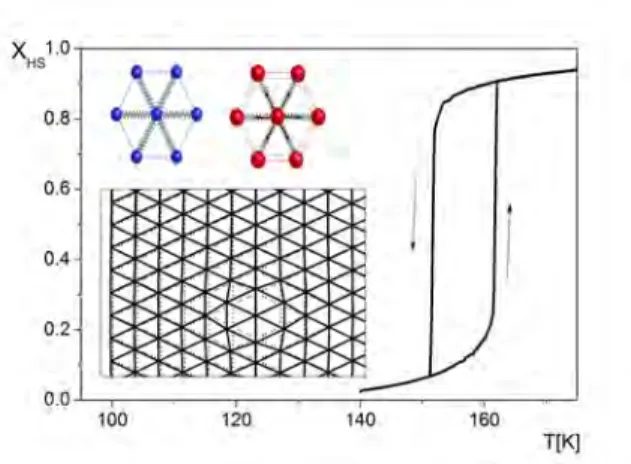
previously considered in mechanoelastic model for re-producing static phenomena. It is in this way that the thermal hysteresis shown in figure 2, or slow relaxation curves28 are simulated. Oppositely, a smaller r (high
n2) favours non-equilibrium distribution when the
prob-abilities (3) change before the system accommodates to the distribution of local pressure, like in the case of fast phenomena subsequent to femtoseconds photoexcitation experiments29. This is due to the fact that
molecu-lar switching timescale (related to n1) characterized by
the timescale related to intra-molecular bond expansion (200 fs) is shorter than the typical lattice equilibration timescale (ns). In this paper, if not stated otherwise, we have used r = 1, that means that we solve one single step of differential equations after every MCES. This value corresponds to a situation when the lattice relaxation timescale is much longer than the molecular switching timescale.
For the present simulations, we use a rectangular shape sample, composed of 13982 molecules in triangu-lar configurations which translates into real space in a 60 nm× 60 nm sample for the typical value of 1 nm per molecule. The value of the parameters considered in the simulations are in the range of those found by the esti-mation of the variation of the ligand field strengths in the two spin states due to the cooperativity and the bulk modulus30: κ = 0.2× 10⁻¹⁰A m, k = 5 N m−1, with the bond-length difference between the HS and
FIG. 2: (main figure) Typical dynamical LS−HS transforma-tion at 10000 MC steps/K; (inset) (up) LS molecule in LS environment and HS molecule in HS environment (down) The triangular network of particles connected with springs. In the initial state all the molecules are in the LS state (open circles). When a molecule switches its state to HS (red full circle), all the other molecules (small circles) change their po-sitions. The lattice becomes then distorted: the distortions are bigger in the vicinity of switched molecule (short range ef-fect), but they are present even in remote parts of the system (long range effect).
LS molecules ∆rHL = 0.2× 10⁻¹⁰m, while other
pa-rameters are µ = 0.7 N s m−1, EA = 552× 10−23J,
∆H = 1520× 10−23J and g = 1096, thus giving a ther-mal transition temperature T1/2= ∆H/kBln g of around
157 K (figure 2) close to the one experimentally reported for[F eIII(3− MeO − SalEen)]P F
6.
We consider a temperature below the thermal transi-tion temperature, at which most of the molecules are in the LS state. First, we run enough Monte Carlo steps in order to find the steady state at the corresponding tem-perature. Then the homogenous photoexcitation is sim-ulated by choosing randomly a number of LS molecules, corresponding to the desired photoexcitation percent-age, and by switching them to the HS state. Simul-taneously, their individual temperature is increased with ∆T = 100 K31. This value is in line with the lattice
heating experimentally observed of 15-20 K for a 15-20% photoexcitation. (consequently if 20% photoexcitation results in a global system heating of around 20 K, after the energy redistribution, we may assume that a 100% photoexcitation will result in a 100 K global heating, and, for practical purposes in Monte Carlo algorithm, we as-sume this value as individual increase of temperature for every photoexcited molecule). The temperature increase on the excited molecule allows to reduce the relaxation process towards its initial LS state due to lattice pres-sure. Here, as we are interested to simulate the behavior of the system for short time after photoexcitation when the elastic step appears and consider that the thermal dif-fusion is negligible and all molecules keep constant their temperatures attributed after the photoexcitation. This
4
FIG. 3: Simulation of the evolution of the HS fraction after different percentages of photoexcitation showing the elastic step. Inset: the variations of ∆XHS after the elastic step as a function of photoexcitation ratio at constant T = 125 K.
approximation was made for avoiding thermally-induced switching due to laser heating. We have also performed calculations taking into account the energy redistribution between the photoexcited molecules and their environ-ment and, qualitatively, the same effects are observed. However, a correct description of the heat diffusion is more complex and this will be a further step towards more realistic simulations. Even if the heat diffusion could occur really quick for a high excitation (distance between two excited LS), the energy barriers between LS and HS are such that Arrhenius-like conversion takes much longer that the arrival of the elastic step32. Then,
the system is allowed to evolve without any external in-fluence by alternative checking molecules for switching and solving the system of differential equations.
The dependence of ∆XHS on the initial
photoexcita-tion percentage is shown in figure 3 for a constant tem-perature T = 125 K. If the photoexcitation percentages are high enough, we notice a fast relaxation after the pho-toexcitation, followed by an increase of the HS fraction, which eventually surpasses the initial photoexcitation as observed experimentally. The variation of the HS frac-tion between the elastic step and after photoexcitafrac-tion is ∆XHS (figure 1). However, if the initial
photoexci-tation percentage is too small, only the relaxation from
HS to LS states can be observed and ∆XHS < 0. The
apparent trough at ∆XHS= 0.15 is the manifestation of
two competing and opposite going processes, namely the local relaxation and the non-local amplification.
The dependence of ∆XHSwith temperature for a
pho-toexcitation percentage of 15%, is shown in figure 4. If the temperature is close to the thermal transition temper-ature, then a large increase in the HS fraction is observed after photoexcitation. This increase corresponds to the
FIG. 4: Simulation of the evolution of the HS fraction after photoexciting 15% of LS molecules showing the elastic step at different temperatures. Inset: the variations of ∆XHS after the elastic step as a function of temperature.
experimentally observed elastic step5. The amplitude of
this elastic step decreases with decreasing temperature until it vanishes at around 125 K. For temperatures be-low 125 K, only the relaxation subsequent to photoexci-tation can be observed. By depicting the threshold at ∆XHS = 0, figure 4 (inset), we can conclude that with
increasing the temperature, which stabilizes the higher entropy HS state, and thus the equilibrium HS fraction, the elastic step takes on a greater magnitude. This could be rationalized with the lattice getting softer, which re-quires less elastic cost for macroscopic volume expansion and molecular switching.
We plot in figure 5 the variation of the volume (that actually in our 2D case is just the area S) of the whole sample at 145 K for two opposite cases, showing or not the elastic step. As it takes some time for stress inside the lattice to propagate via an elastic distortion towards the edges of the system, the volume (area) variation does not exactly follow the XHS variation. In both cases, the
initial HS fraction relaxation cannot be detected by the area variation: while some of the HS molecules relax, the area, which still corresponds to a state configuration before the photoexcitation, starts to increase in order to match the updated state due to internal pressure. Even in the case where only the relaxation is observed, the area still increases, as it should fit a state with ∆XHS higher
than prior to photoexcitation. We should strengthen here that at short times described by our simulations only the propagation of phonons, driven by an harmonic-type po-tential influence the switch of molecules all around the sample, as the heating transfer between molecules is ne-glected and all of them keep their temperature. Only in case of high value of r, the area and the fraction would be somewhat artificially brought to concur in time. We emphasize that in our calculations r = 1, which
corre-FIG. 5: Variation of XHS and of total area during elastic step at 145 K after two different initial photoexcitation per-centages.
sponds to a realistic value that allowed reproducing all features on experimentally determined timescales.
The explanation of the experimental observation is strictly related to the microscopic evolutions inside the material, as it results from figure 6, where we present snapshots of the system taken at 145 K at different in-stants, before and during the elastic step. In figure 6 upper left, we show the situation just after photoexci-tation, once molecules have switched from LS to HS state of higher volume but before the lattice relaxation starts. With this random distribution of HS molecules in a frozen lattice, most of them experience a very high pressure applied on them (blue circles). This high pres-sure will determine the switching back of several HS molecules to the lower volume LS state. Only the fact that the temperature of the photoexcited molecules has been increased prevents the switching back of all HS molecules (3). After a while (just at the end of relax-ation part of XHS), the relaxation of the lattice leads
to a decreasing of pressure for molecules situated closer to the edge (red and black circles). This state is asso-ciated with the end of the relaxation part of the curves. Remarkably, the molecules still associated with a high pressure are situated inside a circular area, just in the middle of the sample. This observation shows actually how the relaxation starts from the edges, developing to-wards the center. Later on, during the elastic step, the lattice has almost completely relaxed. There are no more molecules with a high pressure acting on them, while the number of the molecules with a low pressure and in the
HS state increased, especially towards edges and
cor-ners (black circles). This situation corresponds to figure 6.f, where one shows a ”reorganized” sample: accumula-tions of HS molecules (small clusters) are concentrated towards corners and edges. Actually, this figure helps us to understand the nature of the elastic step. Several photoexcited molecules situated in the vicinity of cor-ners / edge will lead to local deformations of the lattice resulting in creating more space for nearby LS molecules.
This means that most springs around the LS molecules will be elongated and, therefore, the LS− HS switching probability for these molecules will increase, and many of them will switch to HS state. Therefore, the elastic step appears due to a reorganization of the molecules with dif-ferent spin state and volume in the vicinity of corners / edges [movie in the Supplemental Material33]. The same conclusions can be drawn from the representations of the maps of local pressures, i.e. compressions or elongations of every spring in the system, which are similar to local deformation fields in a continuous medium, as shown in Figure 7. Just after photoexcitation, the values of the local pressures are homogenously distributed all around the sample, with somewhat larger values around photo-switched molecules (Fig. 7, a); then high local pressures persists for a while in a central region of the sample, while they decrease faster for edges (fig. 7, b, c). Towards the end of the elastic step, the local pressures are again homogenous all around the sample, but with lower val-ues.(Fig. 7, e, f).a,b,c,d,e,f correspond to different MCES shown in Figure 8.
The results presented din figure 8 supports these state-ments. They show, separately, the evolution of XHS for
regions in the middle of the sample and towards the edge and support the hypothesis that most of the effect is due to the increase of the number of HS molecules towards the edge. While towards the edges there is almost no decrease of XHS after irradiation (as the additional
pres-sure is rapidly freed by the increase of the volume), in the inside part the relaxation is important and the aver-age of XHS is much smaller that for the whole sample.
In the inset of figure 8, we present the variation of local pressures values during the elastic step. As qualitatively shown in figure 7, they decrease faster at the edges of the sample and slower in the bulk, but stabilize in the whole sample around the same non-null value towards the end of the elastic step.
The next question is to study the influence of the elas-tic constant on the magnitude of the elaselas-tic step. To clarify this point, we have simulated the behaviour of the system keeping constant all parameters of the sys-tem (as mentioned before), except the elastic constant. The temperature (145 K) and the photoexcitation per-centage (20%) is also similar for all simulations. The results are presented in figure 9. At first sight, it can be stated that the elastic step exists even for smaller values of the elastic constant, when no hysteresis appears and that there is no monotonic evolution of the magnitude of the elastic step with the amplitude of the elastic con-stant (a maximum value of the elastic step is obtained for an intermediate elastic spring value). However, due to the different steady state before photoexcitation (see figure 9 inset), the interpretation of these results is rather difficult, as we have previously shown, the value of the elastic step depends also on the initial photoexcitation state. On one side, these results show the existence of an elastic step independently of the value of k, while we may imagine a chemical tuning of a material in order to obtain
6
FIG. 6: Initial (upper left), intermediate and final states (lower right) after the propagation of the elastic distortion-elastic step. Yellow molecules: low spin state. Other colours: high spin molecules with a colour scale corresponding to their local pressure: black: low pressure (very stable), red: mod-erate pressure (stable), blue: high pressure. The snapshots correspond to situations just after photoexcitation (a), dur-ing and after the relaxation (b, c) and durdur-ing fluctuations around the elastic step (d, e, f), as shown in figure 8.
FIG. 7: Map of local pressures inside the sample during the elastic step. The snapshots correspond to those in Figure 6.
a larger elastic step. Different k entails different sound velocity, and indeed we observe that the onset of the elas-tic step in terms of MCES, not only its magnitude, is k dependent. The elastic step has a larger magnitude for an intermediate value of the elastic constant, as in the case of a soft lattice (low value of (k)), the local pres-sure is not large enough to cause the switching of many molecules, while in the case of a hard lattice (high value of (k))) the elastic distortions encounter more difficulties to propagate.34
Next, we discuss the amplitude of the elastic step as a function of the ratio r between the number of steps in the differential equations solved, and the number of MCES between two successive solving of differential equation. As we have stated above, r is a measure for how fast
FIG. 8: Difference in the evolution of XHS for central and edge regions and comparison with the average XHS for the whole sample. Inset: variation of the local pressures for cen-tral and edge regions of the sample.
FIG. 9: The dependence of the elastic response on the elastic constant of the springs. Inset: thermal hysteresis for all elastic constants at 1000 MCsteps K−1 — at 145 K the steady state is different for every spring constant.
is the lattice relaxation in comparison with individual molecular switching. The results for different r are pre-sented in figure 10. If r is large then no relaxation can be observed after the photoexcitation, as the lattice relaxes (almost) completely till the next molecular switching, so the local pressure will diminish enough for all recently
HS switched molecules and they will not switch back to LS. This situation corresponds to conventional LIESST
experiments performed at low temperature where the photoinduced molecular HS state lives orders of mag-nitudes longer than the acoustic timescale. When r is somewhat smaller, the lattice does not completely relax and therefore some molecules (especially those situated in the middle of the lattice, according to figure 6) will still have a higher pressure and will switch back to LS state. This number of molecules is larger, so that is the relax-ation, as r decreases more. However, in all situations, the
FIG. 10: The influence of the ratio probability check / steps during molecular motion on the elastic step: the temperature is considered 145 K and a 20% photoexcitation. The final state is the same irrespective to the ratio, but the initial re-laxation disappears if the lattice is let to relax after every molecular change.
value of the elastic step is similar – this can be easily un-derstood if we take into account that it is the equilibrium state for a given spin configuration. The surface shows a faster variation for larger r values, while, for smaller values, an incubation time is observed, as experimentally reported.
A final point that we would like to address is the role of the homogeneity of the photoexcitation on the value of the elastic step. It was experimentally observed that in function of various parameters, like the absorption cross section of the material, the photoexcitation wavelength or sample size, the photoexcitation can be more or less homogenous8. We have therefore considered different
ini-tial photoexcited state configurations, from a complete inhomogeneous one, where only the molecules near one side are photoexcited (figure 11, top) to a complete homo-geneous state, where the photoexcitation is completely random, as considered in previous paragraphs. Interme-diate states with the number of photoexcited molecules decreasing exponentially from one side to another have also been investigated (figure 11 bottom). The last situa-tion would be closest to the real situasitua-tion of a single crys-tal, of which absorption obeys Lambert-Beer law35,36.
In figure 12 we show that the value of the elastic step obtained in the case of intermediate photoexcitation is three times higher than that in the case of homogeneous or inhomogeneous states, for similar global values of ini-tial fraction of photoswitched molecules. This can be explained using the results presented in figure 10. If the photoexcitation is completely inhomogeneous and lo-cated on the surface, the photoexcitated molecules will only manifest in their immediate vicinity and will not have enough force to influence distant molecules. On the other side, in the case of completely random photoex-citation, most of the photoexcited molecules will be in the bulk part of the sample, so, either they will relax
FIG. 11: Initial (left) and final state after the propagation of the elastic distortion- elastic step (right) for different initial states with 20% HS molecules. The same color scale as in figure 6 is used.
or wither they will determine the switching of a small number of LS. Therefore, the most favourable case is an intermediate one, as in figure 11 bottom. The pro-portion of molecules near the photoexcitation side is just high enough to determine the switching of almost all their nearby molecules, and the region till the photoexcita-tion populaphotoexcita-tion surpasses a threshold is large enough to guarantee their influence in a large part of the sample. As expected, the surface changes faster in the case of an inhomogenous state, as there are a higher number of photoexcited molecules near the edge, so the elastic dis-tortion will need to cover a smaller distance, while for homogenous photoexcitation, the surface varies slowly.
III. CONCLUSIONS
In this paper, by using the mechanoelastic model, we have qualitatively reproduced the unusual self-amplified increase of the number of molecules in the high-spin state after femtosecond photoexcitation, recently reported in various experiments. The non-linear photo-response on acoustic timescale, for which elastic distortion propagates over the macroscopic sample, results from the competi-tion between the local relaxacompeti-tion and the non-local ampli-fication. We have explained this effect as a reorganisation of molecular states, resulting from the elastic distortion and due to the lattice deformations. Simulations points enhanced effect towards the edge and corners of the open boundary lattice. If the elastic lattice deformation origin of this self-amplification is well described by the present model, further work should consider size effects and heat
8
FIG. 12: The evolution of nHS (up) and on the total surface (down) starting from different initial states with the same number of photoexcitated molecules but with different homo-geneities (see figure 11). The maximum of the elastic step is attained for an intermediate non-homogenous initial state.
propagation, which manifest at a longer timescale, of
mi-croseconds. A study of the dependence of the elastic step with the size will most likely lead to the conclusion that as the size of the crystals decreases the expansion occurs faster and elastic deformation is larger. Equally, a fur-ther study will concern the rigidity of the lattice, which may preclude amplification at low excitation density and favor it at high excitation density. Photothermal conver-sion is not discussed here. It depends on the proximity of the thermal phase transition, but it is limited by the ther-mal equilibrium timescale and energy redistribution from the photoexcited molecules to the global system should be taken into account. At least for systems homoge-neously photoexcited, the description used in this paper remains valid but exponential decay of molecular temper-ature and exponential increase of the lattice tempertemper-ature should be included. This will be a next step in our stud-ies. Clearly one of the big hopes now is that we will be able to predict the elastic conversion time, whether it lags or not behind the volume (distortion) propagation, and that on the ultrafast time-scales for nanocrystals. We give away a taste for it in figure 11. The model can be improved by using parameters provided by ab-initio calculations such as vibration modes and frequencies or distortions during the switches between the states. We believe that the present model based on the coupling be-tween the strain wave and the order parameter field is a new perspective extendable onto many other photoactive materials for which important molecular volume-change couple to lattice expansion37–42.
Acknowledgements
This work was supported by National Research Coun-cil (CNCS-UEFISCDI), Romania, grant number PN-II-RU-TE-2014-4-0987, by the Institut Universitaire de France, Rennes M´etropole, R´egion Bretagne (CREATE 4146), ANR (ANR-13-BS04-0002, CNRS (LIA IM-LED) and by Grants-in-Aid for Scientific Research C (No. 25400391, and No. 26400324) from MEXT of Japan.
1
P. G¨utlich and A. Goodwin, Spin crossover in transition metal compounds, vol. I-III (Springer, Heidelberg, 2004).
2
M. A. Halcrow, Spin-crossover materials - properties and applications (John Wiley & Sons, Chichester, UK, 2013).
3 E. Collet, L. Henry, L. Pineiro-Lopez,
L. Toupet, and J. Real, Current Inorg. Chem. 6, 61 (2016). 4
A. Marino, M. Buron-Le Cointe, M. Lorenc, L. Toupet, R. Henning, A. D. DiChiara, K. Moffat, N. Brefueld, and E. Collet, Faraday Discuss. 177, 363 (2015).
5
R. Bertoni, M. Lorenc, H. Cailleau, A. Tissot, J. Lais-ney, M. Boillot, L. Stoleriu, A. Stancu, C. Enachescu, and E. Collet, Nat. Mater. 15, 606 (2016).
6
R. Bertoni, M. Lorenc, T. Graber, R. Henning, K. Moffat, J. Letard, and E. Collet, Cryst. Eng. Comm. (2016).
7
R. Bertoni, M. Lorenc, A. Tissot, M. L. Boillot, and E. Col-let, Coord. Chem. Rev. 282, 66 (2015).
8
E. Collet, N. Moisan, C. Balde, R. Bertoni, E. Trzop, C. Laulhe, M. Lorenc, M. Servol, H. Cailleau, A. Tissot, et al., Phys. Chem. Chem. Phys. 14, 6192 (2012). 9 E. Konig, Struct. Bonding 76, 51 (1991).
10
A. Hauser, Top. Curr. Chem. 234, 155 (2004). 11
S. Decurtins, P. G¨utlich, C. P. Kohler, H. Spiering, and A. Hauser, Chem. Phys. Lett. 10, 1 (1984).
12
A. Hauser, Chem. Phys. Lett. 192, 65 (1992). 13
R. Bertoni, M. Lorenc, A. Tissot, M. Servol, M. Boillot, and E. Collet, Angew. Chem. Int. Ed. 51, 7485 (2012). 14
M. Lorenc, J. Hebert, N. Moisan, E. Trzop, M. Servol, M. Buron-Le Cointe, H. Cailleau, M. L. Boillot, E.
Pon-tecorvo, M. Wulff, et al., Phys. Rev. Lett. 103, 028301 (2009).
15 A. Marino, M. Cammarata, S. F. Matar, J. F. Letard, G. Chastanet, M. Chollet, J. M. Glownia, H. T. Lemke, and E. Collet, Struct. Dynam. US 3, 028301 (2016). 16 R. Bertoni, M. Cammarata, M. Lorenc, S. F. Matar, J. F.
Letard, H. T. Lemke, and E. Collet, Accounts Chem. Res.
48, 774 (2015).
17 M. Cammarata, R. Bertoni, M. Lorenc, H. Cailleau, S. Di Matteo, C. Mauriac, S. F. Matar, H. Lemke, M. Chol-let, S. Ravy, et al., Phys. Rev. Lett. 113, 227402 (2014). 18 E. Collet, M. Lorenc, M. Cammarata, L. Guerin, M.
Ser-vol, A. Tissot, M. L. Boillot, H. Cailleau, and B.-L. C. M., Chem.-Eur. J. 18, 2051 (2012).
19 Y. Konishi, H. Tokoro, M. Nishino, and S. Miyashita, Phys. Rev. Lett. 100, 067206 (2008).
20
M. Nishino, K. Boukheddaden, Y. Konishi, and S. Miyashita, Phys. Rev. Lett. 98, 247203 (2007). 21 M. Nishino, C. Enachescu, S. Miyashita, P. A. Rikvold,
K. Boukheddaden, and F. Varret, Sci. Rep. 1, 162 (2011). 22
W. Nicolazzi, S. Pillet, and C. Lecomte, Phys. Rev. B 78, 174401 (2008).
23
C. Enachescu, L. Stoleriu, A. Stancu, and A. Hauser, Phys. Rev. Lett. 102, 257204 (2009).
24 C. Enachescu, M. Nishino, S. Miyashita, K. Boukhed-daden, F. Varret, and P. A. Rikvold, Phys. Rev. B 91, 104102 (2015).
25 C. Enachescu, L. Stoleriu, A. Stancu, and A. Hauser, Phys. Rev. B 82, 104114 (2010).
26
E. Holmstrom and L. Stixrude, Phys. Rev. Lett. 114, 117202 (2015).
27 K. Bairagi, O. Iasco, A. Bellec, A. Kartsev, D. Li, J. Lagoute, C. Chacon, Y. Girard, S. Rousset, F. Miserque, et al., Nature Comm. 7, 12212 (2016).
28 P. Chakraborty, C. Enachescu, and A. Hauser, Eur. J. In-org. Chem. 5-6, 770 (2013).
29
M. Nishino, T. Nakada, C. Enachescu, K. Boukheddaden, and S. Miyashita, Phys. Rev. B 88, 094303 (2013).
30
C. Enachescu and A. Hauser, Phys. Chem. Chem. Phys.
18, 20591 (2016).
31 M. Lorenc, C. Balde, W. Kaszub, A. Tissot, N. Moisan, M. Servol, M. Buron-Le Cointe, H. Cailleau, P. Chasle, P. Czarnecki, et al., Phys. Rev. B 85, 054302 (2012). 32 H. Cailleau, M. Lorenc, L. Guerin, M. Servol, E.
Col-let, and M. Buron-Le Cointe, Acta Cryst. A66, 189–197 (2010).
33 See Supplemental Material at [URL will be inserted by publisher] for a movie presenting the evolution of a system during the elastic step. Color scale in the movie: blue: LS molecules, yellow: HS molecules with high pressure, red: HS molecules with low pressure).
34
A. Slimani, K. Boukheddaden, and K. Yamashita, Phys. Rev. B 92, 014111 (2015).
35
D. B. Judd and G. Wyszecki, Color in Business, Science and Industry (Wiley, New York, 1975).
36 C. Enachescu, F. Varret, E. Codjovi, J. Linares, S. Floquet, P. Manikandan, and P. T. Manoharan, J. Phys. Chem. B
110, 5883 (2006).
37
S. Kobatake, S. Takami, H. Muto, T. Ishikawa, and M. Irie, Nat. 446, 778 (2007).
38
S. Ohkoshi, Y. Tsunobuchi, T. Matsuda, K. Hashimoto, A. Namai, F. Hakoe, and H. Tokoro, Nat. Chem. 2, 539 (2010).
39
A. Camjayi, C. Acha, R. Weht, M. G. Rodriguez, B. Cor-raze, E. Janod, L. Cario, and M. J. Rozenberg, Phys. Rev. Lett. 113, 086404 (2014).
40
H. Okamoto, Y. Ishige, S. Tanaka, H. Kishida, S. Iwai, and Y. Tokura, Phys. Rev. B 70, 165202 (2004).
41 Y. Okimoto, X. Peng, M. Tamura, T. Morita, K. Onda, T. Ishikawa, S. Koshihara, N. Todoroki, T. Kyomen, and M. Itoh, Phys. Rev. Lett. 103, 027402 (2009).
42
S. Cobo, D. Ostrovskii, S. Bonhommeau, L. Vendier, G. Molnar, L. Salmon, K. Tanaka, and A. Bousseksou, J. Am. Chem. Soc. 130, 9019 (2008).