Publisher’s version / Version de l'éditeur:
Vous avez des questions? Nous pouvons vous aider. Pour communiquer directement avec un auteur, consultez la première page de la revue dans laquelle son article a été publié afin de trouver ses coordonnées. Si vous n’arrivez pas à les repérer, communiquez avec nous à [email protected]. Questions? Contact the NRC Publications Archive team at
[email protected]. If you wish to email the authors directly, please see the first page of the publication for their contact information.
https://publications-cnrc.canada.ca/fra/droits
L’accès à ce site Web et l’utilisation de son contenu sont assujettis aux conditions présentées dans le site
LISEZ CES CONDITIONS ATTENTIVEMENT AVANT D’UTILISER CE SITE WEB.
The 45th International Conference of Metallurgists (COM 2996) [Proceedings], 2006-10
READ THESE TERMS AND CONDITIONS CAREFULLY BEFORE USING THIS WEBSITE.
https://nrc-publications.canada.ca/eng/copyright
NRC Publications Archive Record / Notice des Archives des publications du CNRC :
https://nrc-publications.canada.ca/eng/view/object/?id=9bfe6305-95d5-4daf-9a33-9ab6941e0f25 https://publications-cnrc.canada.ca/fra/voir/objet/?id=9bfe6305-95d5-4daf-9a33-9ab6941e0f25
NRC Publications Archive
Archives des publications du CNRC
This publication could be one of several versions: author’s original, accepted manuscript or the publisher’s version. / La version de cette publication peut être l’une des suivantes : la version prépublication de l’auteur, la version acceptée du manuscrit ou la version de l’éditeur.
Access and use of this website and the material on it are subject to the Terms and Conditions set forth at Novel Quality Control Methodologies to Assess Semi-Solid Aluminum Produced with the Seed Process
NOVEL QUALITY CONTROL METHODOLOGIES TO ASSESS SEMI-SOLID ALUMINUM PRODUCED WITH THE SEED PROCESS
H. Blanchette and D. Bouchard
Aluminium Technology Centre 501, Boul. Université, Chicoutimi, QC, Canada, G7H 8C3 [email protected]
A. Lemieux
Arvida Research and Development Centre 1955, Mellon Blvd., P.O. Box 1250
Jonquière, QC, Canada, G7S 4K8
Z. Zhang
Université du Québec à Chicoutimi (UQAC) 555, Boul. Université,
Chicoutimi, QC, Canada, G7H 2B1
ABSTRACT
This paper describes quality control methodologies for the production of semi-solid A356 aluminum slugs with the SEED process. A methodology based on destructive tests carried out with an apparatus measuring the force to slice the slugs is presented. The force measurements were correlated with the solid phase morphologies of the slugs and were validated against a non destructive methodology that consisted in monitoring the temperature evolution of crucibles to produce the slugs and the drained metal. Results from the destructive and non destructive methodologies are compared and discussed.
INTRODUCTION
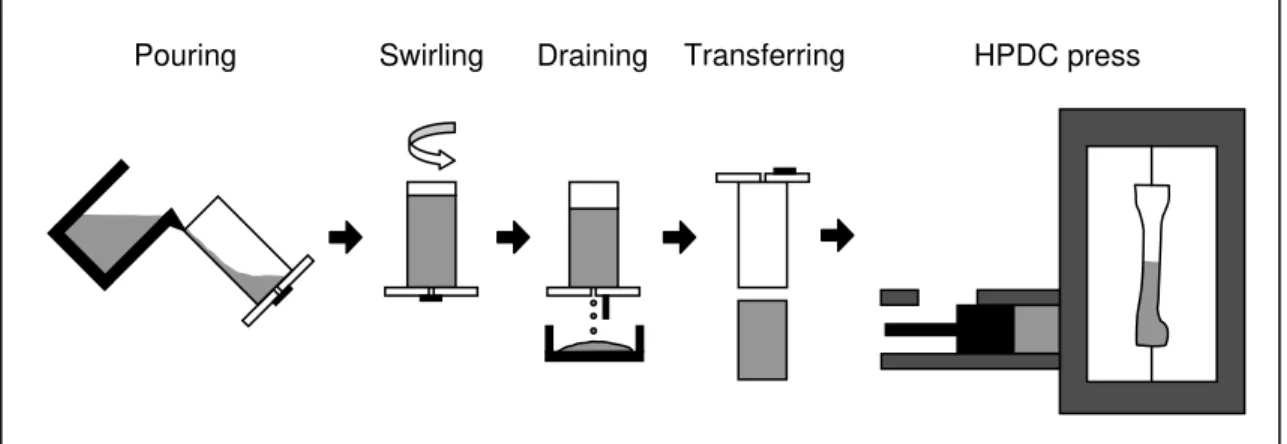
The discovery more than thirty years ago that semi-solid metals with globular structures had low apparent viscosities [1] has led to the development of new casting technologies. With aluminum alloys, thixocasting was utilized until recently but it is now being supplanted by rheocasting [2]. There are presently several rheocasting variants, either in production or in development, and they mainly differ in the mechanisms utilized to cool and promote the globular structure of the semi-solid aluminum [2]. Among them is a technology based on the Swirled Enthalpy Equilibration Device (SEED) that is jointly developed by Alcan International Limited, the owner of the patent [3], and the Aluminium Technology Centre of the National Research Center of Canada. The technology distinguishes itself by its simplicity and versatility [4] and is schematically described in Figure 1. It involves: A) Pouring a liquid aluminum alloy against the wall of a crucible to nucleate primary alpha grains, B) Swirling of the crucible to produce a quasi thermal equilibrium with the partially solidified aluminum, C) Draining of some liquid aluminum to further increase the solid fraction, D) Transferring the semi-solid slug to a high pressure die casting (HPDC) press to produce a component of desired shape.
Transferring
Pouring Swirling Draining HPDC press
Figure 1 – Schematic illustration of the SEED rheocasting technology
A requirement to obtain high integrity rheocast components is that the semi-solid slugs must be produced in a consistent and standardized manner. Deviations originating for example from the liquid metal cleanliness or in the slug preparation steps may be an eventual source of castings defects. Process quality control systems must thus be designed to ensure that the slugs will meet the desired requirements. This was also an important issue in thixocasting where the reheating procedure of the pre-cast billets often led to a lack of feedstock uniformity [5-8]. In this case, temperature monitoring [5,6] and indentation tests [7,8] have been used to control quality.
In this study, different methodologies were evaluated to determine if they could detect intentionally imposed deviations in the feedstock preparations steps of the SEED
process. Non-destructive tests were performed by monitoring the temperature evolution of the crucible and the drained liquid metal. These were complemented by destructive tests that consisted in measuring the force required to slice the semi-solid slugs. Correlations of these results with the primary phase morphologies of the slugs were also carried out.
THEORY
An important feature of the SEED process is the heat absorbed by the crucible. A finite crucible mass will absorb a finite amount of heat from the poured liquid aluminum and one can thus select a crucible that only partially solidifies the aluminum. As the crucible absorbs heat, its temperature evolution can be affected by various process parameters such as the initial temperature and mass of the aluminum, the initial mass and temperature of the crucible, the presence or absence of a coating at the interface between the crucible and the aluminum, etc. In principle, the temperature evolution of the crucible for a slug produced under a set of desired standard parameters should produce a desired standard response or ‘signature’. This temperature response should also be distinct from that obtained when the process parameters have deviated and produced a slug that does not meet the requirements.
Another feature of the SEED process is the draining of some of the liquid aluminum. For a desired standard set of process parameters, the evolution in the mass of drained liquid metal should differ to that obtained when deviations in the production of the slug have occurred. Lastly, the ‘consistency’ of a slug should vary depending on whether it was produced under standard conditions or not. Thus, the force required to slice a slug should provide indications on the conformity of the parameters under which it was produced.
The consistency of a slug is mainly affected by the amount and morphology of the solid phase. The rapid cooling of the liquid aluminum that occurs when it is poured on the wall of the crucible (see Figure 1) causes a large number of primary alpha grain nuclei to be generated. Equiaxed dendrites then form from these grain nuclei but swirling of the crucible contributes to their fragmentation and the solidified structure evolves from rosettes to spheroids through a ripening process similar to the one described by Flemings et al. [9]. The parameters of the SEED process can be adjusted to vary the amount and morphology of the solidified phase and, consequently, the force required to slice the slugs. Metallographic examinations of water quenched slugs were thus performed in this work to establish the correspondence between the force measurements and the microstructures.
Slugs produced under the set of standard conditions were known from previous work to meet the feedstock requirements for HPDC. However, deviations in these conditions need to be detected if they occur and it needs to be verified that they produce measurable differences in temperature, mass and force before considering implementing them in a quality control system. To this effect, a statistical analysis was used to
determine 95 % confidence intervals in these measured responses. The intervals for the mean response value, μ, were based on the Student’s t-distribution and expressed as [10]: n s t x n s t x− α/2,n−1 ≤μ ≤ + α/2,n−1 Equation 1
Where x is the sample mean, tα/2,n-1 is the percentage point of the t distribution where
025 . 0 2 / =
α (for a 95% confidence interval in the two tailed distribution) and with n-1
degrees of freedom, where is the samples size and n s is the sample standard deviation.
Table 1 lists the values of t0.025,n-1 for n between 1 and 10.
Table 1 – Percentage points of the t distribution used in the calculation of the 95 %
confidence interval [10] n-1 α/2 = 0.025 n-1 α/2 = 0.025 1 12.706 6 2.447 2 4.303 7 2.365 3 3.182 8 2.306 4 2.776 9 2.262 5 2.571 10 2.228 EXPERIMENTAL
A schematic illustration of the set-up to produce the slugs and perform the measurements is shown in Figure 2. Two type K surface thermocouples were positioned against the external crucible wall at heights of 63 mm and 127 mm and a balance was placed underneath the crucible to monitor the mass of the drained metal. The tests were all carried out with the A356 alloy and with crucibles that had a diameter of 80 mm, a height of 250 mm and a fixed wall thickness. The internal wall of the crucibles also had a proprietary coating. The production of the semi-solid slugs under standard process parameters was the following: Ingots of A356 aluminum were melted in an electrical resistance furnace to a temperature of 680°C. Approximately 2.5 kg of metal was ladled from the furnace with a spoon and cooled to a temperature of 645°C. The aluminum was then poured into a crucible at 25°C and to a level of 195 mm, which corresponded to a mass of 2.2 kg ± 40 g. After the pouring operation, the crucible was swirled during 45 s. This was followed by a 10 s rest after which liquid aluminum was drained from the bottom (see Figure 2) for a period of 45 s. Once this cycle was completed, the slug was transferred to the slug cutter and sliced longitudinally at a cutting tool velocity of 70 mm/s. The cutter was equipped with a load cell that enabled the slicing force to be measured. Finally, the sliced slug was quenched in water for metallographic evaluation. Temperature, mass and force measurements were recorded with a data acquisition system at a frequency of 100 Hz.
0 Semi-solid slug Balance Crucible Metal drained Load cell Type K thermocouples 127 mm height 63 mm height
Slug production Slug cutter
Figure 2 – Schematic of the experimental set-up. Temperature and mass measurements were performed during the slug preparation. The slugs were then transferred to the
slicing unit for the force measurements.
The effect of deviations in the pouring temperature of the aluminum, the mass of the poured aluminum, the initial temperature of the crucibles and the thickness of the coating at the internal crucible wall were investigated. Table 2 lists how these were varied with respect to the standard process parameters. Typically, 10 tests were carried out to determine the confidence intervals in the measured responses with the standard process parameters and 5 for the nonstandard conditions.
Table 2 – Experimental conditions Process parameters Standard
conditions
Modified conditions
Pouring temperature (˚C) 645 630 665 A356 alloy poured (kg) 2.2 2.0 2.4
Crucible initial temperature (˚C) 25 45 Coating thickness (μm) standard -50% +50%
RESULTS AND DISCUSSION
Figure 3 illustrates the temperature evolution of the external wall of the crucible at a height of 127 mm and for three different aluminum pouring temperatures. It is noticed that a rapid rise in temperature occurs during which the crucible absorbs most of the heat from the aluminum. The temperature then stabilizes, indicating that the crucible and the aluminum are at, or are nearly at, thermal equilibrium. The 95 % confidence interval for the standard pouring temperature of 645°C is shown in the hatched grey zone. The pouring temperature of 630°C was detected as it lies outside this interval. This is however not the case for the aluminum poured at 665°C. For clarity, only the average temperature evolutions are shown for the measurements at 630 and 665°C but their confidence intervals had similar magnitudes to that obtained at 645°C. Due to the probabilistic nature of the statistical analysis, a pouring temperature of 630°C may thus be undetected. 0 200 400 600 0 20 40 60 80 10 Time (s) Temperature (°C) 665°C 630°C 95% confidence interval of standard case (645°C) 0
Figure 3 – Effect of the pouring temperature of the aluminum on the crucible wall temperature at a height of 127 mm
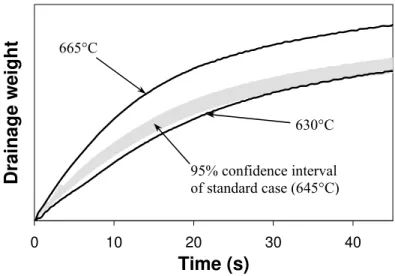
Figures 4 and 5 respectively illustrate the evolution of the drained liquid aluminum and the slicing force of slugs produced at the standard temperature of 645°C and the two nonstandard temperatures of 630 and 665°C. In these two graphs, the results for the slugs produced at 665°C are outside the confidence intervals of the standard temperature but the results at 630°C are just at the limits of the confidence intervals and would therefore often be undetected. The larger amount of drained metal for the curve at 665°C is considered to be caused by the lower solid fraction in the slug. In Figure 5, the larger slicing force for the curve at this temperature is considered to be caused by a larger proportion of dendrites as the results to follow will show. Graphs similar to those depicted in Figures 3, 4 and 5 were generated for variations in the masses of poured aluminum, initial crucible temperatures, and thickness of the internal crucible coating.
The ability of the three methodologies to detect these process variations are summarized in Table 3. 0 10 20 30 40 Time (s) D rai nage w e ight 665°C 630°C 95% confidence interval of standard case (645°C)
Figure 4 – Effect of pouring temperature on the evolution of the drained metal.
0 5 10 15 20 25 30 35 0 20 40 60 80 100 120 Position (mm) Force (N) 665°C 630°C 95% confidence interval of standard case (645°C)
Figure 5 – Effect of pouring temperature on the force to slice the slug. The slug was sliced from top to bottom and the initial position refers to the top
Table 3 – Summary of the experimental results
Non-destructive evaluations Destructive evaluation Crucible wall temperature
Modified parameters 63 mm 127 mm Drained mass Force α-grain morphologies 630 – – nd nd g + r Pouring temperature (°C) 665 + nd + + d + r 2.0 nd – – + r + d A356 alloy poured (kg) 2.4 nd nd + nd g + r Crucible initial temperature (°C) 45 + nd + nd g + r -50% nd nd + nd g + r Coating thickness (µm) +50% nd – nd + r + d
– : below standard response, + : above standard response, nd : not detected,
g = globules, r = rosettes, d = dendrites, predominant morphology put in first
The examination of Table 3 teaches that among the three methods used to detect the process deviations, the measurement of the drained metal was the most reliable. This was followed by the temperature and the force measurements. In addition, the combination of the temperature and mass measurements succeeded at detecting all the process deviations. Also listed in Table 3 are the structures (dendrites, rosettes or globules) that were observed from the metallographic examinations of the quenched samples. The results show that the force measurements can be a useful tool to determine optimal production parameters for the semi-solid aluminum since they can quickly assess the state of the grain morphologies. Examples of these morphologies are provided by the photomicrographs in Figure 6. In some instances, the rapid cooling during quenching of the samples produced internal cracks and the examination of their interfaces provided structures with the depth of field shown in Figure 7.
Tpouring = 665°C Tcrucible = 45°C Standard conditions
A B C
Figure 6 – Grain morphologies of quenched samples observed with an optical microscope at 50X showing: a) dendrites, b) rosettes, c) globules.
200µm 200µm
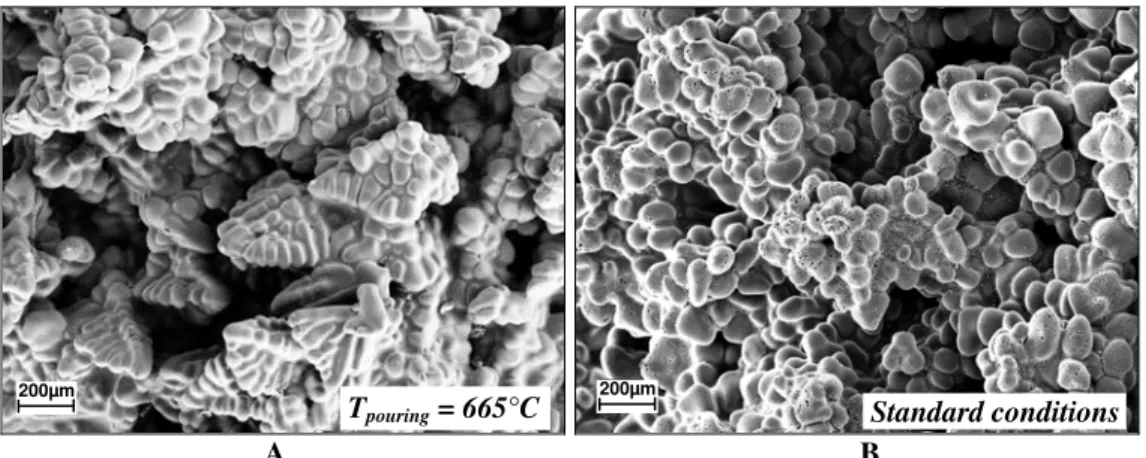
Tpouring = 665°C Standard conditions
A B
Figure 7 – Grain morphologies of quenched samples observed with a scanning electron microscope showing: a) dendrites at 60X, b) globules at 80X
The relationship between the grain structures and the slicing force is illustrated in Figure 8. It is seen that the force decreased according to the ripening state of the grains (dendrites → rosettes → globules).
0 10 20 30 0 25 50 75 100 Position (mm) Force (N)
Mostly dendrites and some rosettes (Tpouring = 665°C)
Mostly globules and some rosettes (Tpouring = 630°C)
Mostly rosettes and some globules (Tcrucible = 45°C)
Figure 8 – Slicing force as a function of slug position for different grain morphologies In Figures 5 and 8, it is seen that the maximum slicing force was typically detected at approximately 15 mm from the top surface of the slug. In principle this should have been measured at or closer to the surface since, due to exposure to the ambient conditions, the outermost layer of the slug had a higher solid fraction than the bulk. In addition, a ‘ripple’ in the force was often observed and this may have been caused by a readjustment in the velocity of the cutting tool as the slicing of this higher resistance layer was completed. The metallographic examination of the longitudinal sections of the slugs also revealed that aside from this outermost top layer, the microstructures were quite uniform. Therefore, the decrease in force as the slug was
being sliced may have been caused by an increase in the shear rate at the interface between the cutting tool and the slug. Since the semi-solid aluminum is pseudoplastic, this shear rate increase would yield a decrease in the apparent viscosity and thus a decrease in the force. Work is presently carried out to improve the slicing apparatus with different mechanical and electronic components to test these hypotheses. As far as the measurements of the crucible temperatures and the drained metal masses are concerned, additional work is being conducted to implement these approaches to an on-line process monitoring system to insure that slugs are produced under desired parameters.
CONCLUSIONS
Force measurements performed on semi-solid slugs provided valuable information on the grain morphology of the solid aluminum phase. This novel approach could therefore be a useful tool to quickly determine the optimal process parameters to produce slugs with the desired grain morphology. Additionally, the drained metal weight and crucible wall temperature measurements confirmed the impact of modified process parameters on the grain morphology.
ACKNOWLEDGMENTS
This work was funded by the Chaire industrielle sur la solidification et la métallurgie de l’aluminium (CISMA) of Université du Québec à Chicoutimi (UQAC) and the Aluminium Technology Centre (ATC). Technical assistance from Martin Bouchard and Gilles Lemire, from UQAC, as well as Hélène Grégoire and Christina Del Vasto from ATC are acknowledged. The authors are grateful to Alcan International Limited for allowing the publication of this work.
REFERENCES
1. D.B. Spencer, Ph.D. Thesis, Massachusetts Institute of Technology, Cambridge, MA, 1971.
2. S.P. Midson, “Rheocasting Processes for Semi-Solid Casting of Aluminum Alloys”, Die Casting Engineer, Vol. 50, No. 1, 2006, 48-51.
3. D. Doutre, G. Hay, P. Wales, “Semi-Solid Concentration Processing of Metallic Alloys”, US Patent, No. 6,428,636, 6 August 2002.
4. J. Langlais, A. Lemieux, D. Bouchard and C. Sheehy, “Development of a Versatile Rheocasting Technology”, Proceedings of the SAE 2006 World Congress & Exhibition, Detroit, USA, 2006, to be published.
5. S. Midson, V. Rudnev, R. Gallik, “The Induction Heating of Semi-Solid aluminum Alloys”, Proceedings of the 5th International Conference on Semi-Solid Processing of Alloys and Composites, Golden, USA, 1998, 497-504.
6. A. Bendada, K.T. Nguyen, C.A. Loong, “Application of Infrared Imaging in Optimizing the Induction Heating of Semi-solid Aluminum Alloys”, Proceedings of Advanced Sensor for Metals Processing (CIM 1999), 1999, 331-342.
7. H. Müler-Späth, D. Bernhard, P.R. Sahm, “The Use of a Dynamic Penetration Method for the Characterization of Semi-Solid Alloys”, Proceedings of the 5th International Conference on Semi-Solid Processing of Alloys and Composites, Golden, USA, 1998, 713-720.
8. R. Bigot, V. Favier, C. Rouff, “Characterisation of Semi-solid Material Mechanical Behaviour by Indentation test”, Journal of Materials Processing Technology, Vol. 160, 2005, 43-53.
9. M.C. Fleming, J. Yurko, R. Martinez, “Semi-solid forming: our understanding today and its implications for improved processes”, Solidification Processes and Microstructures: A Symposium in Honor of Wilfried Kurz as held at the 2004 TMS Annual Meeting; Charlotte, NC, USA, 2004, 3-14.
10. D.C. Montgomery, “Introduction to Statistical Quality Control”, 5th edition, John Wiley & Sons, New York, NY, USA, 1990, 262-265 and 679.
![Table 1 – Percentage points of the t distribution used in the calculation of the 95 % confidence interval [10] n-1 α /2 = 0.025 n-1 α /2 = 0.025 1 12.706 6 2.447 2 4.303 7 2.365 3 3.182 8 2.306 4 2.776 9 2.262 5 2.571 10 2.228 EXPERIMENTAL](https://thumb-eu.123doks.com/thumbv2/123doknet/14176789.475476/5.918.292.622.438.568/table-percentage-points-distribution-calculation-confidence-interval-experimental.webp)