HAL Id: hal-00866412
https://hal.archives-ouvertes.fr/hal-00866412
Preprint submitted on 30 Sep 2013HAL is a multi-disciplinary open access archive for the deposit and dissemination of sci-entific research documents, whether they are pub-lished or not. The documents may come from teaching and research institutions in France or abroad, or from public or private research centers.
L’archive ouverte pluridisciplinaire HAL, est destinée au dépôt et à la diffusion de documents scientifiques de niveau recherche, publiés ou non, émanant des établissements d’enseignement et de recherche français ou étrangers, des laboratoires publics ou privés.
Sub-Saharan African Cotton Policies in Retrospect
Claire Delpeuch, Antoine Leblois
To cite this version:
Claire Delpeuch, Antoine Leblois. Sub-Saharan African Cotton Policies in Retrospect. 2011. �hal-00866412�
C.I.R.E.D.
Centre International de Recherches sur l'Environnement et le Développement
UMR
8568
CNRS
/
EHESS
/
ENPC
/
ENGREF
/
CIRAD /
M
ETEOF
RANCE45 bis, avenue de la Belle Gabrielle
F-94736 Nogent sur Marne CEDEX
Tel : (33) 1 43 94 73 73 / Fax : (33) 1 43 94 73 70
www.centre-cired.fr
DOCUMENTS DE TRAVAIL / WORKING PAPERS
No 28-2011
Sub-Saharan African Cotton Policies
in Retrospect
Claire Delpeuch
Antoine Leblois
Sub-Saharan African Cotton Policies in Retrospect
Abstract
Calls for liberalizing cash crop sectors in sub-saharan Africa have been voiced for decades. Yet, the impact of reforms remains elusive in empirical studies. This paper offers new opportunities to solve this problem by creating precise and consistent market organisation indices for 25 African cotton markets from 1961 to 2008. The aggregation of scores reveals interesting trends: markets are not more competitive today than in the late 1990s, 50% of production still originates from markets with fixed prices and reforms are giving rise to a new type of regulated markets with mixed ownership both in East and West Africa.
Keywords : Cotton sector, Africa, Liberalization.
-
Politiques nationales dans le secteur du coton africain (1961-2008)
Résumé
La libéralisation des secteurs agricoles de nombreuses économies africaines du sud du Sahara a été encouragée par les institutions internationales, à l’instar d’autres régions dépendantes de l’aide internationale, ces dernières appelant à une modernisation et à une amélioration des performances par le biais des mécanismes concurrentiels. Les travaux analysant l’impact de ces réformes ont cependant souvent des difficultés à en identifier un impact clair. Dans ce papier, nous construisons une série d'indicateurs d'organisation des marchés qui permet d'analyser en détails l’évolution de ces réformes dans le secteur du coton pour 25 pays Africains lors des cinquante dernières années. La mise en perspective à l’échelle du continent permise par cette nouvelle base de données révèle deux principaux résultats. Premièrement il semble que ces réformes aient surtout donné lieu à diverses formes intermédiaires de marché régulés, détenus à la fois par des capitaux publics et privés. Deuxièmement, les secteurs cotonniers ne sont pas (beaucoup) plus compétitifs que dans les années 90, puisque la moitié de la production reste issue de marchés où les prix sont fixés.
1
SUB-SAHARAN AFRICAN COTTON POLICIES IN RETROSPECT
CLAIRE DELPEUCH* &ANTOINE LEBLOIS†
[email protected] [email protected]
Working Paper - January, 27, 2010
Comments and additional information are very welcome
Abstract
Calls for liberalizing cash crop sectors in sub-saharan Africa have been voiced for decades. Yet, the impact of reforms remains elusive in empirical studies. This paper offers new opportunities to solve this problem by creating precise and consistent market organisation indices for 25 African cotton markets from 1961 to 2008. The aggregation of scores reveals interesting trends: markets are not more competitive today than in the late 1990s, 50% of production still originates from markets with fixed prices and reforms are giving rise to a new type of regulated markets with mixed ownership both in East and West Africa.
* Groupe d‟Economie Mondiale (GEM), Sciences Po Paris
2
1. INTRODUCTION
Cotton is a key crop in sub-saharan Africa (SSA): it is a major source of foreign currency for a number of countries, the primary cash-crop for millions of rural households and one of the only export products for which the continent‟s market share in global trade has increased over the past decades (Boughton et al., 2003; Baffes, 2009b). Being grown mainly by smallholders, it is believed to play a key role for development and poverty reduction (Badiane et al., 2002; Moseley and Gray, 2008).
Since the late 1980s, Africa‟s „white gold‟ as it is sometimes called has been at the centre of a harsh debate on how best its production can be encouraged and, particularly, on the role governments should play in this process. Indeed, in many countries, markets have historically been organised around public or para-public companies enjoying a monopoly on cotton transformation and export and, especially in west and central Africa (WCA), on related activities such as input provision and transport (these companies are referred to in the literature as boards or parastatals in the WCA context). However, starting in the late 1980s and, increasingly since the mid-1990s, reforms have been adopted in a large number of countries. The nature of reforms has widely varied across countries and regions, ranging from far-reaching market and price liberalizations to only very marginal adjustments.
Because reforms have not always yielded the expected impacts and because several countries are still considering different reform options, the institutional puzzle remains unsettled. As a result, the literature on cotton sector reforms has dramatically expanded over the past decade. While in the 1980s and 1990s it was prospective and consisted mainly of recommendations, numerous retrospective assessments have been performed over the past few years. Reform processes have however been studied mainly on a case-by-case basis (notable exceptions being Goreux et al., 2002; Araujo-Bonjean et al., 2003; Tschirley et al., 2009 and 2010; Delpeuch et al., 2010), and concentrate on a small number of countries. Moreover, policy changes have often been studied only shortly after their implementation and, while institutional and regulatory changes are sometimes described in detail, most of the existing literature primarily evaluates the impact of these changes rather than characterises them.
3
This paper thus aims at giving a full panorama of how market organisation has evolved in all SSA cotton producing countries from the early 1960s, that is, before the independence of many countries in the region, to the present time. We refer to „market organisation‟ to describe both market structure and the nature of ownership, as well as the regulatory framework, understood as the set of rules which govern market entry, pricing, and all aspects of cotton production, transformation and sales. Based on an extensive review of the literature, we compile indices describing the evolution of market organisation in 25 countries from 1961 to 2008.1 This enables us to make two contributions to the literature.
First, by computing average degrees of competition, private ownership and price intervention at different sub-regional levels, we verify whether the trends in cotton market organisation identified in the literature hold when expanding the sample of countries under consideration and the study period. With a series of nuances, we confirm key findings for the different periods up the late 1990s: markets were indeed initially more integrated in WCA; they became overwhelmingly integrated across all SSA during the 1970s and 1980s and were then significantly disintegrated in a number of countries, mainly in ESA, in the early to mid-1990s. This confirmation of trends and patterns suggests that cotton policies were very uniform at the sub-regional level. However, our results for the later post-reform period significantly alter the conclusions commonly accepted in the literature. Indeed, we find that what we call the „disintegration‟ trend of the 1990s, that is the combination of both increased participation of the private sector and greater competition, was not the start of a process as it is often claimed to be. Indeed, it has not been followed by other countries in the following decade: while, this first series of reforms has been followed by a second series of reforms, the latter have led to the creation of hybrid markets with mixed ownership and regulation but no competition. Besides, we find that liberalization has even been reversed in a number of marginal producing countries. As a result, markets are increasingly diverse across SSA but competition remains limited: over fifty percent of total production still originates from non-competitive countries where prices are fixed.
Second, expanding the information available to the largest possible array of countries and reporting key policy or institutional changes with precise time indications, and in a consistent manner for
4
25 countries, brings new opportunities for quantitative empirical work on the link between market structure and performance in African cotton sectors or the political economy of cotton policies.
The paper is organised as follows. In section 2 we comment on the methodology adopted to review cotton policies: we outline the criteria chosen to characterise cotton markets and reforms and describe our sources of information. In section 3, we identify patterns and trends in cotton sector organisation at the SSA level and for sub-groups of countries. We conclude in section 4.
2. METHODOLOGY:CREATING INDICES
2.1 Characterising cotton markets
Building on the literature assessing the links between market organisation and performance, we have identified a number of questions that we use as guidelines to characterise markets and describe their evolution.2 We focus on identifying episodes of market integration (which we understand as moves towards reduced competition, increased state ownership and price intervention) and episodes of market disintegration (which we understand, conversely, as moves towards more competition and private ownership as well as no price intervention). The works by Tshirley et al. (2009 and 2010) were particularly helpful to do so as they rest on a typology of cotton markets against which a number of performance indices are examined.
To understand how market organisation has evolved, it is important to recall that market organisation in SSA cotton markets is closely related both to the SSA rural context and to the specific requirements of cotton production (Poulton et al., 2004). Indeed, farmers need costly inputs (fertilizers, pesticides, herbicides and sometimes seeds) – especially in West and Central Africa where agro-climatic conditions are less favourable. They however face strong cash constraints as credit markets are almost non-existent in rural areas. As a result, production occurs almost exclusively through interlinked transactions whereby inputs are provided on credit by the ginning companies.3 Changes in market organisation have specific implications in such a context of imperfect markets and prevalence of linkages between input and output markets. This is all the more the case that formal contract enforcement
5
institutions are typically absent in many countries of SSA
among other reasons because of the oral
nature of many arrangements, the geographical dispersion of agents and the weakness of
judiciary systems (Delpeuch et al., 2010; Poulton et al., 2004).
Competition is believed to influence performance through its impact on the share of the world price received by farmers, which in turn impacts the area under cultivation and the amount of effort that farmers put into production. Yet, competition is also expected to impact the scope for side-selling, where farmers sell their cotton to other buyers at harvest, instead of to the company that has pre-financed their inputs. This in turns impacts the sustainability of inputs credit systems and thus ultimately yields and areas under cultivation (Delpeuch et al., 2010; Poulton et al., 2004). In addition, competition is believed to influence firms‟ efficiency through the creation of cost minimization incentives, or, conversely, the suppression of economies of scale or the introduction of new transaction costs (Delpeuch et al., 2010). Finally, Larsen (2003) and Poulton et al. (2004) have identified a strong link between competition and companies‟ ability to coordinate on quality issues as, for example, avoiding mixing of seed varieties in different regions or enforcing strong quality requirements.
Another key aspect of market organisation is price fixation: are producer prices determined by the market, are indicative prices announced by the government, or are prices fixed?Indeed, fixed prices that apply throughout the year and the country (i.e. pan-territorial and pan-seasonal prices) have been heralded as a risk mitigation and spatial redistribution instrument (Araujo-Bonjean et al., 2003). They however discourage production from the most productive farmers, and conversely encourage production by less efficient farmers. Besides, price fixation by the government most often results in (implicit) taxation or, alternatively, in unsustainable subsidies (Baffes, 2009b).
Finally, the nature of ownership is expected to impact efficiency. First, private sector involvement in ginning and cotton-related activities is indeed often seen as improving efficiency through the removal of soft budget constraints, excessive employment or political interference in management (Baffes, 2009b). Second, good performance is sometimes attributed to the involvement of colonial enterprises or their
6
counterparts after independence (referred to as ex-colonial institutions) – either directly or through lagged effects of past interventions (Tschirley et al., 2009). In this perspective, we thus also report colonial ties.4
2.2 Sources and information compilation
As much as possible, we attempted to answer the above questions with „objective‟ information such as official law and regulation documents or reports of international organisations. The latter are indeed more comparable across countries and time than interview- or survey-based information (Conway et al., 2005). However, we used information emanating from the local and international press, the literature5 and interviews for two reasons. First, objective information sources were not available for all the countries under scrutiny and, second, this enabled us to account for the fact that poor rule enforcement and/or informal rules also impact market organisation.6 For example, establishing the actual degree of competition of a market ideally requires information not only on the number of firms active in the market and their respective market shares, but also on their strategic behaviour and on the degree of ownership concentration behind firms with different names. Similarly, the role of regulatory bodies is sometimes difficult to assess without knowing the context in some detail. Based on such additional information, we report the date of effective changes, rather than the date of the official decisions underlying these changes when they differ.
When compiling the information, we refrained from using composite indices to be as transparent as possible. In this respect, our indices are different from those in Giuliano and Scalise (2009), the only other agricultural market regulation indices that we are aware of. In that paper, government intervention in cash crop markets is given a score between one and four.7 Alternatively, in this paper, (i) different indices are reported for the different dimensions of market organisation that we identified in the above section (competition, ownership and price intervention) and (ii) degrees in each of these dimensions are reported as separate dummy variables rather than scores. For example, in terms of competition, four dummy variables indicate whether the market is monopolistic, regulated, moderately competitive or strongly competitive. Doing so allows us identifying a number of policy trends that would not appear otherwise.
7
3. COTTON POLICIES IN SSA1960-2009
3.1 Cotton policies in the literature
Comparative descriptions of the evolution of cotton policies across SSA are rare. On the one hand, comparative studies are concerned with the impact of market organisation and therefore do not focus on characterising their evolution and, on the other hand, detailed historical reviews of institutional changes are most often country-specific. What is more, while numerous studies look at the historically biggest producers in Eastern and Southern Africa (ESA) (Mozambique, Tanzania, Uganda, Zambia and Zimbabwe) and in WCA (Benin, Burkina Faso, Chad and Mali); countries where production has declined over the last decade (such as Nigeria, the Ivory Coast and Sudan) or smaller producers (such as Kenya, Senegal, Madagascar or Togo) are rarely examined. Aggregating the findings of these studies however allows raising a number of key findings, which can be summarized as follows:
In the 1960s, market integration and public ownership were higher in WCA than in ESA. In the immediate post-independence era, however, very little change occurred in WCA, while, in ESA, nationalisations led to increased market integration (Delpeuch, 2009; Isaacman and Roberts, 1995).
Starting in the late 1980s, and increasingly since the mid-1990s, the privatisation and liberalisation of all the cotton sub-sectors were advocated by the World Bank (WB) and the International Monetary Fund (IMF) with the objective of strengthening their competitiveness, ensuring their financial sustainability and allowing a fair sharing of the profits between producers and ginners
(Badiane et al., 2002)
. Such reforms were adopted rapidly in a number of countries, mainly in ESA, with diverging results ranging from significant upsurges in the degree in competition – for example in Tanzania (Poulton, 2009) to the creation of almost duopolistic markets – for example in Zambia or Zimbabwe at some points in time (Brambilla and Porto, 2009; Poulton and Hanyami-Mlambo, 2009). Everywhere, the state stepped out of ownership.8
Resistance to market reforms has been much stronger in WCA. While some privatization has taken place, markets have been liberalized only very partially and prices remain fixed to a large extent. Regional monopsonies or systems of administrative allocation of production among buyers have been adopted by a number of countries (Baffes, 2009a; Delpeuch, 2009).
Tschirley et al. (2010) give the most up-to-date and documented comparative evaluation of the latest policy trends. They find that the post-reform period is characterised by increasing diversity across countries in terms of market organisation and regulatory arrangements and increasing variability over time. Second, they establish that the general dynamic is mostly towards increased competition, with (i) reforms foreseen in non-reforming countries and (ii) a tendency of moderately competitive markets to become increasingly competitive. They however note that voluntary policy moves have been undertaken in a limited number of countries in order to explicitly limit competition in strongly competitive markets (Tschirley et al., 2010).
3.2 1960s-1980s: An era of market integration
To describe average market organisation at different points in time, we compute annually (i) the number of countries per level of competition, per degree of private sector ownership and per pricing system as well as (ii) the share of production emanating from each of these groups of countries. Graphs are drawn first at the SSA level (figure 1), but also differentiate between WCA and ESA (figures 2 and 3, respectively) as well as between former French and British colonies (figures 4 and 5).
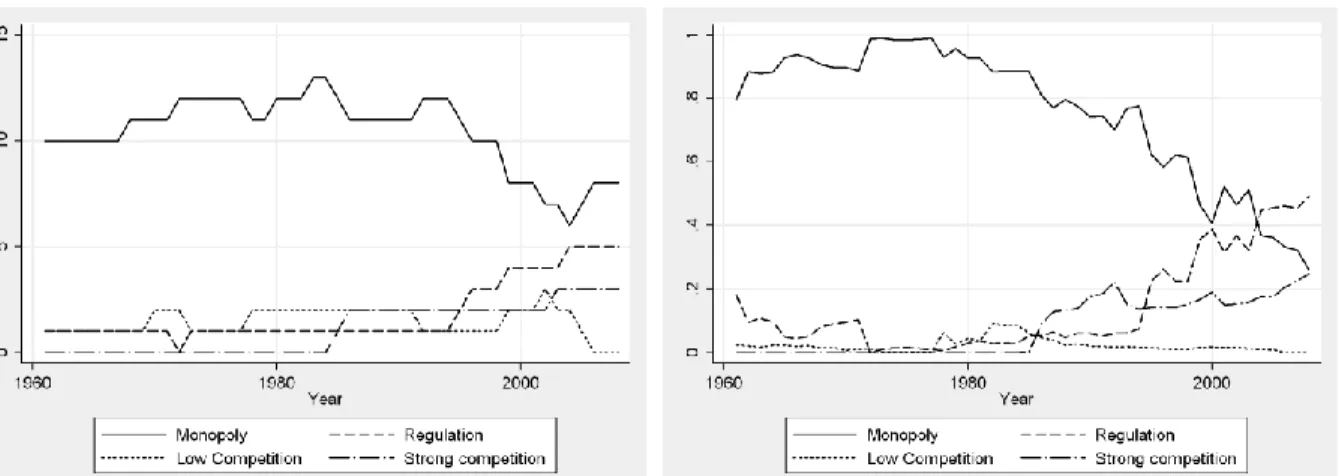
As pictured in figure 1, market organisation varied across SSA in the early 1960s although over half the countries already had monopolistic markets (figure 1-A) and no private ownership (figure 1-C).
In WCA, competition was absent in almost 90 percent of markets, and a majority were monopolistic (figure 2-A). The Democratic Republic of the Congo, the Gambia and Togo were the only countries where cotton sectors were not monopolistic but regulated or moderately competitive and where some private ownership was allowed. Prices were fixed everywhere, except in Togo (figure 2-E).
9
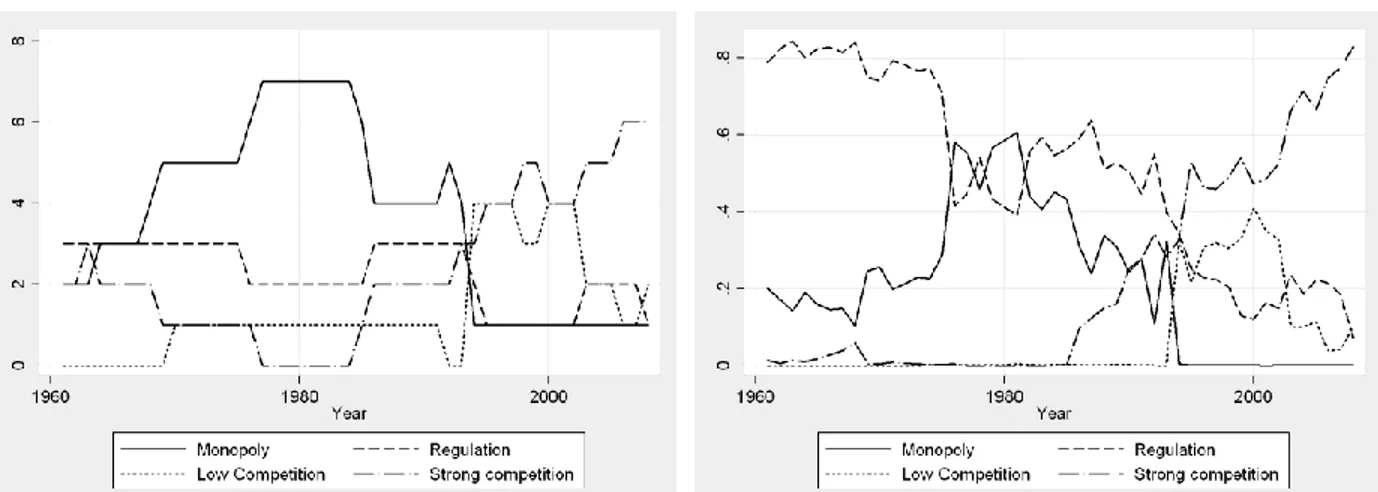
In ESA, by contrast, over three markets out of four were competitive at the beginning of our study period (figure 3-A) and only two were monopolistic (Malawi and Madagascar). Private ownership was also much higher in ESA than in WCA: it was null only in the two monopolistic markets and the Sudan (figure 3-C). Prices were fixed in about half the countries: Madagascar, Malawi, the Sudan, Tanzania and Uganda (figure 3-E).
Figures 4 and 5 illustrate how differences in market integration across regions in fact directly reflect on colonial policies: market integration was almost complete in all former French colonies, including in ESA (figure 4) and much less important in former British colonies, including those of WCA (figure 5).
However, looking at average market organisation in terms of production shares originating from different types of markets gives a somewhat different picture. During the 1960s and the 1970s, competitive markets accounted only for a marginal share of production in ESA and in ex-British colonies as a whole (figure 3-D and 5-D) and production overwhelmingly originated from countries where prices were fixed (figures 2-F and 4-F). Differences between ESA and WCA, or ex-French and British colonies were thus less marked than might be thought of when looking at markets only.
As shown in figure 3, market organisation remained very stable in WCA after the independences (that is from the mid to late 1960s to the late 1980s), and even more so in former French colonies (figure 4).8 Conversely, changes were important in ESA: competition declined and regulated markets were transformed into monopolies while public ownership increased very significantly. By the early 1980s, almost three markets out of four were monopolistic and entirely public in ESA (figures 3-A and 3-C).9 As soon as the mid-1970s prices were fixed everywhere but in Mozambique, where the prices announced were only indicative (figure 3-E).
While broadly confirming the patterns identified in the literature (namely market uniformity within SSA sub-regions and a higher initial degree of integration in WCA), our indices highlight the fact that market organisation quickly became similar in WCA and in ESA. Between the late 1970s and the mid-1980s, markets were, on average, as integrated in ESA as they were in WCA. Besides, our indices
10
suggest that the commonly used distinction between WCA and ESA should not be understood as a geographical distinction but rather as a shortcut denomination for colonial ties.
3.3 Late-1980s-early 2000s: different reform paths
Going back to figure 1 shows how cotton market organisation in SSA began to change in the mid-1980s, with a drastic acceleration of reforms in the mid-1990s. The number of monopolistic and publicly owned markets indeed continuously declined until the mid-2000s (figures 1-A and 1-C). Prices were also liberalized in a number of countries, although the decrease is less important and stopped in the mid-1990s (figure 1-E). This difference between market reform and price reform reflects the fact that the decrease in the number of publicly-owned monopolistic markets resulted from two different waves of reform: a first wave which gave rise to privately operated and competitive markets where prices were liberalized, and a second wave, which gave rise to hybrid markets characterized by mixed ownership, regulation and continued price fixation. This can be seen in the parallel increase of the number of regulated and competitive markets as well as that of entirely and only partially privately operated markets in figure 1-A and 1-C. Trends in terms of market share (figures 1-B, 1-D and 1-F) are relatively similar. We document more precisely the timing and the places where the different types of reforms took place by looking at sub-regional levels.
Changes were indeed very different in ESA and in WCA, or rather in former British colonies and in former French colonies. Indeed, contrary to common beliefs, the first breakthrough occurred in WCA and not in ESA, with the liberalisation of markets and prices in a number of non-French WCA countries in the mid-1980s (the Democratic Republic of the Congo in 1978, Nigeria in 1986 and Ghana in 1985). This first wave of liberalisation continued a decade later in ESA as illustrated by the huge shifts in trends in the mid 1990s in figure 3. By 1995, markets were completely privatised and liberalised in all the former British colonies of the region: Kenya (1993), Malawi, Uganda, Zambia, Zimbabwe (1994) and Tanzania (1995). Competition and prices thus remained constrained only in Madagascar and Mozambique (respectively former French and Portuguese colonies) and Madagascar was the sole country
11
where the cotton sector remained monopolistic and purely state-owned. Production shares followed similar trends: in the mid-1990s, the shares of monopolistic and regulated markets dropped sharply (to almost nothing in the late 1990s) to the benefit of competitive markets (figure 3-B). Similarly, the shares of production emanating from publicly-owned markets and from markets with fixed prices shrank drastically at the same time (figure 3-D).
In contrast, in non-Anglophone WCA, reforms have been much more recent and much more restricted in scope: the number of monopolies has declined only gradually, and to the benefit of regulated markets, not to the benefit of competitive markets (figures 2-A and 2-B). Public ownership has also declined, with an acceleration of this trend in the late 1990s, but very few markets have become fully operated by private agents (figures 2-C and 2-D).10 Prices have not been liberalised (figures 2-E and 2-F). The most important changes occurred in Niger and Guinea Bissau, where parastatals were privatised (in 1989 and 2000) before competition was introduced (in 1998 and 2002). Competition however remained limited, except in Niger, where it was re-enforced by new entry after 2003. Elsewhere, the government remained a majority shareholder or markets remained monopolistic (or both, in countries where market organisation was not challenged at all, such as Mali and Cameroon). In Benin, Togo, the Ivory Coast and Burkina Faso, private investors were allowed to enter ginning (in 1995, the late 1990s, 1999 and 2003) yet governments remained major shareholders of the former parastatals that continued to operate, competition remained strictly constrained and price fixation was not challenged. Finally, the Central African Republic, Guinea, Senegal and Madagascar all privatised their parastatals (in 1990, 2000, 2003 and 2004), but continued to guarantee their monopoly position (or failed to attract competitors in the Central African Republic). As a result, by the end of the 1990s, the private sector was operating in only about half the markets of WCA and competition remained restrained in over three countries out of four. About 80 percent of production continued to originate from markets where prices were fixed.
Regarding the “structural adjustment” period, our results again broadly confirm the key result found in the literature, namely that of prompter and deeper reforms in ESA. The nuance identified in the preceding section however still holds: patterns again strongly reflect colonial origin rather than geography
12
(as illustrated by comparing figures 2 and 3 with figures 4 and 5). This observation suggests a strong path-dependence of institutional history.
3.4 Since the early-2000s: The end of disintegration?
The changes observed during the structural adjustment period led to some of the conclusions reached in Tschirley et al. (2010): a clear trend towards more competition and, as result, greater diversification of market organisation. In what follows, we highlight a mitigation of the disintegration trend and thus even greater diversity in market organisation. Two phenomena contribute to this evolution.
First, competition has overall ceased to increase since the early 2000s. To make this clearer, in figure 6, we graph the number of countries and their share of production according to whether markets display any level of competition (i.e. moderate or strong) or none (i.e. being monopolistic or regulated). In SSA, figure 6-A shows that the combined number of monopolistic and regulated markets has increased anew in the first half of the 2000s and is back to level of the mid-1990s. This is also true in ESA (figure 6-E) and in WCA (figure 6-C), where a small decline in the late 1990s has been completely offset already. Liberalisation attempts have indeed been rapidly reversed in Mozambique (in 2000), Guinea Bissau (in 2004) and the Democratic Republic of the Congo (in 2006). Regulation was also re-introduced in Uganda (between 2003 and 2008). Similar patterns appear in terms of market share: the share of non competitive markets has increased over the first half of the 2000s and is back, today, to its level of late 1990s in ESA and in WCA (figures 6-D and 6-F). What is more, within the competitive markets of ESA, the degree of competition has fluctuated (figures 3-A).
Second, we also observe a partial reversal of the privatisation trend in WCA: the private sector does not operate anymore in the Central African Republic (since 2007), Gambia (since 1996) and Guinea (since 2008). An apparent difficulty to re-regulate is worth noting. Fifteen to twenty years after reforms were initiated, situations seem far from stable: since the mid-2000s, the reform processes have even been reversed in one way or another in about half the countries under consideration.
13
Building on our country-case studies, we find that the observations described above are the result of three types of market integration: state driven and private sector driven regulation and indirect re-integration caused by market exit.11 In some cases, several of these trends have been at work simultaneously or successively. However, it appears that, in WCA, market exit is the primary explanation for increasing state ownership or declining competition while state driven and private sector driven regulation have been the main drivers of re-integration in ESA. Indeed, market re-integration in WCA largely reflects the collapse of cotton production in marginal producing countries where private agents have exited the sector.12 Conversely, fluctuations in the degree of competition in Zambia and Zimbabwe have resulted from reinforced regulation of the ginning sector in Zimbabwe (Poulton and Hanyami-Mlambo, 2009) and informal cooperation by the two biggest firms in Zambia, in an attempt to limit the scope for side-selling (Brambilla and Porto, 2009).
As a result of this re-integration trend and of the limited scope of reforms in WCA, we find that, on average, cotton markets in SSA remain largely publicly-owned and little competitive: only nine countries out of the 25 under consideration have achieved some level of competition and over half of total SSA production still originates from markets where prices are fixed (figures 6-A and 1-E). 13
What is more, according to some analysts, even the most competitive African cotton markets would be far from perfectly competitive – especially when the scope of reforms is put into perspective with the more general institutional and political context of the countries examined (Coocksey, 2004; Van de Walle, 2001). Looking at the cotton sector in Tanzania, supposed to be amongst the most competitive in SSA, Larsen (2005) reports that private agents have to obtain licences from the marketing board and other administrations to enter the different segments of the cotton sector.
Finally, we observe that the recommendations formulated to countries where reforms have not been adopted or implemented yet are increasingly cautious and context-specific. Privatisation is seen as insufficient or even undesirable under certain conditions and competition as having to be controlled in certain market contexts (Baghdadli et al., 2007). Hence, while Baffes (2005) advocated further privatisation of the parastatals in WCA as well as further liberalisation of all sub-sectors, Tschirley et al.
14
(2009 and 2010) conclude that no market sector type seems to have performed so well that it can be considered best under all circumstances.14
Maybe as a consequence, countries where markets have barely evolved over the past three of four decades (Mali and Cameroon) seem to envision reforms that would lead to regulated rather than competitive markets.
4. CONCLUSION
The subject matter of this paper is to offer a comprehensive view on cotton market organisation and regulation evolution all over sub-saharan Africa. Notwithstanding a series of nuances, we find that the trends in policy evolution identified in the literature broadly hold when expanding the sample of countries under consideration in the pre-reform period and in the aftermath of reforms. This suggests that cotton policies were relatively uniform at the sub-regional level. However, our findings for the last decade significantly alter the conclusions commonly accepted. We find that the disintegration of markets engaged with reforms in some countries in the 1990s was not pursued by other countries in the following decade. We even find a series of examples where privatisations and liberalisation have simply been reversed. While cotton sectors are commonly described as moving towards increased disintegration, we show that trajectories are in fact less linear. Of course, this is not to say that reforms have failed everywhere. However, while this paper does not intend to comment on the desirability of reforms, it describes the difficulty of achieving true competition, and the frequent de facto re-involvement of the states.
This finding is crucial when it comes to explaining the performance of markets post-reforms or the determinants of policy choices. Because they provide comparable information for 25 countries over 46 years, our indices offer promising opportunities for future quantitative empirical work. Indeed, analysing the impact or the causes of reforms at the sector level, with detailed information on their pace and their scope might help solve the difficult identification of supply response in the African context (Kheralla et al., 2002) or the determinants of different policy choices among countries with relatively similar economic contexts and histories.
15
Finally, our findings also point to the crucial need for additional research into the modalities of state intervention in African agricultural markets. Indeed, there are reasons to believe that what we observe for cotton reforms could be similar for the reforms of other cash crops.
16
Figure 1. Market organisation in SSA (1961-2008)
1-A Nb of countries by d° of competition in SSA 1-B Production share by d° of competition in SSA Competition is „ strong‟ if many firms compete on prices and „limited‟ when 2 or 3 firms with a large combined market share exert price leadership. „Regulation‟ implies that firms operate as regional monopsonies or that supply is administratively allocated.
1-C Nb of countries by d° of ownership in SSA 1-D Production share by d° of ownership in SSA
1-E Nb of countries by price system in SSA 1-F Production share by price system in SSA SSA includes Benin, Burkina Faso, Cameroon, Central African Republic, Chad, Democratic Republic of the Congo, Gambia, Ghana, Guinea, Guinea-Bissau, Ivory Coast, Kenya, Madagascar, Malawi, Mali, Mozambique, Niger, Nigeria, Senegal, Sudan Togo, Uganda, United Republic of Tanzania, Zambia and Zimbabwe.
17
Figure 2. Market organisation in WCA (1961-2008)
2-A Nb of countries by d° of competition in WCA 2-B Production share by d° of competition in WCA Competition is „ strong‟ if many firms compete on prices and „limited‟ when 2 or 3 firms with a large combined market share exert price leadership. „Regulation‟ implies that firms operate as regional monopsonies or that supply is administratively allocated.
2-C Nb of countries by d° of ownership in WCA 2-D Production share by d° of ownership in WCA
2-E Nb of countries by price system in WCA 2-F Production share by price system in WCA WCA includes Benin, Burkina Faso, Cameroon, Central African Republic, Chad, Democratic Republic of the Congo, Gambia, Ghana, Guinea, Guinea-Bissau, Ivory Coast, Mali, Niger, Nigeria, Senegal and Togo.
18
Figure 3. Market organisation in ESA (1961-2008)
3-A Nb of countries by d° of competition in ESA 3-B Production share by d° of competition in ESA Competition is „ strong‟ if many firms compete on prices and „limited‟ when 2 or 3 firms with a large combined market share exert price leadership. „Regulation‟ implies that firms operate as regional monopsonies or that supply is administratively allocated.
3-C Nb of countries by d° of ownership in ESA 3-D Production share by d° of ownership in ESA
3-E Nb of countries by price system in ESA 3-F Production share by price system in ESA ESA includes Kenya, Madagascar, Malawi, Mozambique, Sudan, Uganda, United Republic of Tanzania, Zambia and Zimbabwe. Source: compilation by the authors.
19
Figure 4. Market organisation in Former French Colonies (FFC) (1961-2008)
4-A Nb of countries by d° of competition in FFC 4-B Production share by d° of competition in FFC Competition is „ strong‟ if many firms compete on prices and „limited‟ when 2 or 3 firms with a large combined market share exert price leadership. „Regulation‟ implies that firms operate as regional monopsonies or that supply is administratively allocated.
4-C Nb of countries by d° of ownership in FFC 4-D Production share by d° of ownership in FFC
4-E Nb of countries by price system in FFC 4-F Production share by price system in FFC Former French colonies include Benin, Burkina Faso, Cameroon, Central African Republic, Chad, Guinea, Ivory Coast, Madagascar, Mali, Niger, Senegal and Togo.
20
Figure 5. Market organisation in Former British Colonies (FBC) (1961-2008)
5-A Nb of countries by d° of competition in FBC 5-B Production share by d° of competition in FBC Competition is „ strong‟ if many firms compete on prices and „limited‟ when 2 or 3 firms with a large combined market share exert price leadership. „Regulation‟ implies that firms operate as regional monopsonies or that supply is administratively allocated.
5-C Nb of countries by d° of ownership in FBC 5-D Production share by d° of ownership in FBC
5-E Nb of countries by price system in FBC 5-F Production share by price system in FBC Former British colonies include Gambia, Ghana, Kenya, Malawi, Nigeria, Sudan, Uganda, United Republic of Tanzania, Zambia and Zimbabwe. Other countries include the Democratic Republic of the Congo, Guinea-Bissau and Mozambique.
21
Figure 6. Competition in African cotton markets (1961-2008)
6-A Nb of competitive countries in SSA 6-B Production share of competitive countries in SSA Countries are considered competitive if markets have achieved „ strong‟ or „limited‟ competition
6-C Nb of competitive countries in WCA 6-D Production share of competitive countries in WCA
6-E Nb of competitive countries in ESA 6-F Production share of competitive countries in ESA Source: compilation by the authors.
22
Table 1. Market organisation indices
Indices Description
Degree of competition
Strong competition Several firms compete on prices to purchase cotton from farmers
Limited competition 2 or 3 firms enjoy a large combined market share & exert price leadership Regulation Several firms operate but no competition because of regional monopsonies or
administrative allocation of supply among them
Monopoly One company buys cotton from farmers & sells cotton lint Ownership 15
No private capital Private investors are not allowed to enter ginning
Some private capital Both the public and the private sector are active in ginning Only private capital The state does not intervene at all in ginning
Col. institution as a monopoly A colonial institution is the sole ginner Ex-col. institution majority
shareholder An ex-colonial institution remains the majority shareholder in the ginning sector Ex-col. institution shareholder An ex-colonial institution retains shares (any) in the ginning sector
Producers shareholders Producers have shares (any) in some of the ginning companies Price fixation
Fixed prices Prices are fixed pan-territorially and pan-seasonally
Price indication An indicative (non-binding) buying price is announced at the start of the season Free market price Prices fluctuate according to local supply and demand
Controls
French colony once The country was a French colony once (any time) British colony once The country was a British colony once (any time)
CFDT once The CFDT has operated as a ginning monopoly (any time) British board once A British Board has operated as a ginning monopoly (any time) Other or no colonizer The country never was a French or a British colony.
23
ENDNOTES
1
These countries include Kenya, Madagascar, Malawi, Mozambique, Sudan, Uganda, United Republic of Tanzania, Zambia and Zimbabwe in ESA and Benin, Burkina Faso, Cameroon, Central African Republic, Chad, Democratic Republic of the Congo, Gambia, Ghana, Guinea, Guinea-Bissau, Ivory Coast, Mali, Niger, Nigeria, Senegal and Togo in WCA. According to FAO statistics, 32 countries produced over 1000 tons of cotton at some point between 1961 and 2009. However, we still have not found sufficient information to document our indices for the following countries: Angola, Burundi, Botswana, Ethiopia, Somalia, South Africa and Swaziland.
2
Given the large geographical coverage of the paper, it concentrates only on the production of seed cotton and its transformation into cotton lint; the production of by-products, oil and cakes, is not addressed in what follows.
3
Among current significant producing countries, Tanzania is the only country where this is not the case at all
4
Several empirical studies also recognise the potential importance of producers‟ collective ownership in the ginning companies, which is often coupled with participation in sector management. Ownership by producers‟ organisation is thus also captured by a dummy variable in our database. However, it is not commented upon in what follows, which concentrates on key patterns and trends. The dataset also contains information on a series of control variables, which will be useful in the context of quantitative work, but which we do not exploit in this paper (see Table 1 in the annex).
5
Among these studies, see in particular, Kaminski (2009); Savadogot and Mangenot (forthcoming) on Burkina; Minot and Daniels (2005); Gergely (2009a) on Benin; Gergely (2009b) on Cameroon; Gafsi and Mbetid-Bessane (2002) on the Central African Republic; Mbetid-Bessane et al. (2010); Azam and Djimtoingar (2004) on Chad; and Makdissi and Wodon (2004) on the Ivory Coast; Tefft (2003); Vitale and Sanders (2005) on Mali; Larsen
(2006)Poulton and Hanyani-Mlambo (2009) on Mozambique; Dercon (1993); Gibbon (1999); Cooksey (2004a and 2004b); Baffes (2004); Larsen (2006); Poulton (2009) on Tanzania; Lundbæk (2002); Poulton and Maro (2007); Baffes (2004 and 2009a) on Uganda; Brambilla and Porto (2008); Kabwe and Tschirley (2009) on Zambia; Boughton et al. (2003) on Zimbabwe as well as Araujo-Bonjean et al. (2003); Goreux (2003); Bourdet (2004); Baffes (2009) on
WCA and Tschirley et al. (2009) on SSA.
6
For clarity, we quote country-specific sources only in the country-case summaries (available upon request).
7
Their database contains information for the major cash crop in 88 developing countries from 1960 to 2003.
8
The increase in the number of monopolistic markets with public ownership and fixed prices in figure 2-A, 2-C and 2-E is not due to shifts in market organisation but to the emergence of new producing countries (Ghana in 1968, Gambia in 1970, Guinea in 1983 and Guinea Bissau in 1983).
9
Production shares followed similar trends, however, noteworthy is the existence of a time-lag between the peak of production emanating from monopolistic and publicly-managed sectors, which both occur in the late 1970s, and the share of such markets, which continued to increase, respectively, until the mid and late 1980s. Similarly, while the number of regulated and mixed ownership markets has remained relatively stable from the 1960s to the mid-1980s, their market shares have significantly declined. Interesting patterns in terms of performance are therefore to be explored.
10
Note that companies have been privatised in 2009, i.e. after the end of our study period, in Madagascar and Senegal.
11
This suggests that the degree of competition in competitive markets can decrease as a result of voluntary impulses, as noted by Tschirley et al. (2010), but also as a result of non-voluntary evolutions in countries where cotton
production collapses.
12
Similar issues arise in bigger producing countries too. In Burkina Faso, for example, the state has re-increased its ownership share in the ex-parastatal to over 65 percent because the French private investor has refused to engage in the needed recapitalisation.
13
The reversal of the re-integration trend might be even more significant than indicated by our indices. Indeed, regulatory bodies and policies are being created and implemented in a number of countries, the impact of which remains difficult to estimate and thus is not taken into consideration in our indices (for example the Cotton Development Authority in Kenya). Besides, we have found indications that public spending through subsidies seems to be increasing in a number of countries.
14
The somehow limited completeness of reforms achieved in reforming countries might have participated in the softening of reform recommendations, on the grounds of realism.
15
24
REFERENCES
ARAUJO BONJEAN, C., J.-L. COMBES andP.PLANE (2003) Preserving vertical Co-ordination in the West African Cotton Sector. Working Paper 200303,CERDI
AZAM ,J.-P. AND N.DJIMTOINGAR (2004)Cotton, War and Growth in Chad (1960-2000). Prepared as a component of the African Economic Research Consortium Collaborative Research Project
Explaining Africa’s Growth Performance.
BABIN,P.(2009)Dynamiques socioéconomiques au sein des exploitations agricoles des bassins cotonniers de l‟Afrique de l‟Ouest, SNV/IRAM, Ouagadougou and Paris.
BADIANE, O., D. GHURA, L. GOREUX and P. MASSON (2002) Cotton Sector Strategies in West and Central Africa. World Bank Policy Research Working Paper No. 2867.
BAFFES, J. (2009a) The Cotton Sector Of Uganda. Africa Region Working Paper Series No. 123.
BAFFES, J. (2009b) Benin, Burkina Faso, Chad, Mali, and Togo. In K. Anderson and W.A. Masters, eds.,
Distortions to Agricultural Incentives in Africa. Washington DC: World Bank
BAFFES, J. (2005) The “Cotton Problem”. World Bank Research Observer, 20, pp. 109-144.
BAFFES, J. (2004) Tanzania‟s Cotton Sector: Reforms, Constraints and Challenges. Development Policy
Review, 22 (1), pp. 75-96.
BAGHDADLI, I, H. CHAIKHROUHOU and G. RABALLAND (2007) Strategies for Cotton in West and Central Africa. Enhancing competitiveness in the “Cotton-4”. World Bank Working Paper No. 108.
BOUGHTON, D., D. TSCHIRLEY, B. Zulu, A. OSORIO OFIÇO and H. MARRULE (2003) Cotton Sector Policies and Performance in Sub-Saharan Africa: Lessons Behind the Numbers in Mozambique and Zambia. Presented at the 25th International Conference of Agricultural Economists, August 16-22, Durban.
BOURDET, Y. (2004) A tale of Three Countries – Structure, Reform and Performance of the Cotton Sector in Mali, Burkina Faso and Benin. Sida Country Economic Report 2004:2.
BRAMBILLA, I. and G. PORTO (2009) Market Structure, Outgrower Contracts and Farm Output. Evidence from Cotton Reforms in Zambia. Mimeo.
CONWAY, P., V. JANOD and G. NICOLETTI (2005) “Product Market Regulation in OECD Countries: 1998 to 2003”, OECD Economics Department Working Papers, No. 419.
COOKSEY,B.(2004)Marketing reform? The rise and fall of agricultural liberalisation in Tanzania. In F. Ellis and H.A. Freeman, eds., Rural Livelihoods and Poverty Reduction Policies. London: Routledge.
DELPEUCH, C. (2009) “A short analytical history of cotton institutions in West Africa”, GEM Working Paper.
DELPEUCH,C.,A.VANDEPLAS andJ.SWINNEN (2010)Revisiting the “Cotton Problem”: A Comparative Analysis of Cotton Reforms in Sub-Saharan Africa. Paper prepared for presentation at 3
rd
AAAE & 48
th
A.E.A.S.A Conference (Cape Town, September 19-23).
DERCON, S. (1993) Peasant Supply Response and Macroeconomic policies: Cotton in Tanzania. Journal
of African Economies, 2 (2), pp. 157-194.
GAFSI M. And E. MBETID-BESSANE (2002) Les producteurs de coton face à la libéralisation de la filière : le cas centreafrique, Les Cahiers d’Outre-Mer, 220.
GERGELY,N.(2009a)“The Cotton Sector Of Benin.” Africa Region Working Paper Series No.126. GERGELY,N.(2009b)“The Cotton Sector Of Cameroon.” Africa Region Working Paper Series No.125. GIBBON, P. (1999) Free Competition Without Sustainable Development? Tanzanian Cotton Sector
Liberalisation, 1994/95 to 1997/98. The Journal of Development Studies, 36 (1), pp.128-150. GIULIANO, P. and D. SCALISE (2009) The Political Economy of Agricultural Market Reforms in
Developing Countries. The B. E. Journal of Economic Analysis and Policy, 9(1), article 33.
GOREUX L. and J. MACRAE (2003) Reforming the Cotton Sector in Sub-Saharan Africa (SSA). World Bank Africa Region Working Paper Series No. 47.
25
GOREUX, L. (2003) Réformes des filières cotonnières en Afrique subsaharienne. Ministère des Affaires Etrangères.
ISAACMAN, A. and R. ROBERTS, eds. (1995) Cotton, colonialism and social history in Sub-Saharan
Africa. Portsmouth : Heinemann ; London : James Currey.
KAMINSKI, J., D. HEADEY and T. BERNARD (2009) Institutional reform in the Burkinabè cotton sector and its impacts on incomes and food security: 1996-2006. IFPRI Discussion Paper No. 920.
KABWE, S.and D. TSCHIRLEY (2007) Farm Yields and Returns to Farmers From Seed Cotton: Does Zambia Measure Up? Michigan State University International Development Collaborative Policy Briefs No. ZM-FSRP-PB-26.
LARSEN, M. (2005) Market Coordination and Social Differentiation: A Comparison of Cotton-Producing Households in Tanzania and Zimbabwe. Journal of Agrarian Change, 6 (1), pp. 185-205.
LARSEN, M. (2003) Quality Standard-Setting in the Global Cotton Chain and Cotton Sector Reforms in Sub-Saharan Africa. Institute for International Studies, IIS/Gl. Kongevej Working Paper 03.7 MAKDISSI, P. and Q. WODON (2004) Price Liberalization and Farmer Welfare Under Risk Aversion:
Cotton in Benin and Ivory Coast. Université de Sherbrooke, Département d‟Economie, Working Paper No. 04-09.
MBETID-BESSANE,E., K. DJONDANG and M. HAVARD (2010) Impacts des changements de politique dans un contexte de crise mondialisée sur les acteurs des filières cotonnières d‟Afrique centrale, Cahiers
agricultures, 19 (1), pp. 21-27.
MCRAE, J. (2003) Etude comparative sur l‟impact de la libéralisation du secteur cotonnier en Afrique Subsaharienne. 2ème Partie : Les études pays. Ministère des Affaires Etrangères.
MINOT, N. AND L. DANIELS (2005) “Impact of global cotton markets on rural poverty in Benin”.
Agricultural Economics, 33(3), pp. 453-466.
MOSELEY,W.G. AND L.C.GRAY,eds.(2008)Hanging by a Thread. Cotton, Globalization and Poverty in Africa. Athens: Ohio University Press.
POULTION, C. AND B.HANYANI-MLAMBO (2009)The Cotton Sector of Zimbabwe. World Bank Africa Region Working Paper No. 122.
POULTON, C. and W. MARO (2007) Multicountry Review of the Impact of Cotton Sector Reform in sub-Saharan Africa: Tanzania Country Study. Prepared for the World Bank (mimeo).
POULTION,C.(2009) “The Cotton Sector of Tanzania.”Africa Region Working Paper Series No. 127, March.
TEFFT, J. (2003) Mali‟s White Revolution: Smallholder Cotton from 1960 to 2003. Presented at the InWEnt, IFPRI, NEPAD, CTA conference Successes in African Agriculture, December 1-3, Pretoria.
TSCHIRLEY, D., C. POULTON N. GERGELY, P. LABASTE, J. BAFFES, D. BOUGHTON and G. ESTUR. 2010. Institutional Diversity and Performance in African Cotton Sectors. Development Policy Review, 28 (3), pp. 295-323.
TSCHIRLEY, D., C. POULTON and P. LABASTE, eds. (2009) Organisation and Performance of Cotton
Sectors In Africa. Learning from Reform Experience. Washington DC: The International Bank for
Reconstruction and Development /The World Bank.
VAN DE WALLE, N. (2001) African Economies and the Politics of Permanent Crisis, 1979-1999. Cambridge: Cambridge University Press.
VITALE, J. D. and H. SANDERS (2005) Estimating the Impacts of Liberalization in West Africa: The Malian Case. Presented at the American Agricultural Economics Association Annual Meeting, July 24-27, Providence.
WORLD BANK (2004) Benin. Cotton Sector Reforms: A poverty and Social Impact Analysis. Report No. 29951-BJ.