Applicability of the Inclusive Wealth Index as a Measure of
Sustainable Development for the Kingdom of Saudi Arabia
by
Anna Turskaya
M.Eng., University of Oxford (2012) MBA, College des Ingenieurs (2014)
Submitted to the Institute for Data, Systems, and Society in partial fulfillment of the requirements for the degree of
Masters of Science in Technology and Policy Program at the
MASSACHUSETTS INSTITUTE OF TECHNOLOGY
September 2017
Massachusetts Institute of Technology 2017. All rights reserved.
Author... Certified by. MASSACHS ITUT OF TECHNOLOGY
FEB 28 7018
LIBRARIES
ARCHIVES
Signature redacted
I
...
Institute for Data, Systems, and Society
--- August 10, 2017
"Signature
redacted,
Professor Emeritus of Civil, E
Ceprtified by
... Kenneth Strzepek
Research 9SifentistMIT Joint Program avir mental, and Architectural Engineering, University of Boulder at Colorado
J /Thesis
Supervisor
Signature redacted
. . . .
... .
-Olivier L. de Weck Professor of Aeronautics and Astronautics and Engineering Systems Co-Director, Center for Complex Engineering Systems at KACST and MIT Thesis Supervisor
Accepted by ...
Signature redacted
Munther Dahleh Director, Institute for Data, Systems, and Society
-
kl - /X11-11
.
Applicability of the Inclusive Wealth Index as a Measure of Sustainable
Development for the Kingdom of Saudi Arabia
by
Anna Turskaya
Submitted to the Institute for Data, Systems, and Society on August 12, 2017, in partial fulfillment of the
requirements for the degree of
Masters of Science in Technology and Policy Program
Abstract
Following UNEP's global assessment of nations' sustainable development in 2012 and 2014, the Kingdom of Saudi Arabia's Inclusive Wealth Index (IWI) growth per capita has been negative. This study evaluates the extent to which the Inclusive Wealth Index is applicable to the nation. The study evaluates the method and makes new contributions for Saudi Arabia
by adding components that had been omitted in the initial assessment, such as fisheries and
minerals. The stocks for the fossil fuels had been changed to represent technically recoverable reserves, addressing the current paradox of increasing reserves. The global database sources are replaced with the local Saudi for 1999 until 2013. As a result, the new IWI is found to be closer to the 2014 report in absolute numbers and in comparable in the relative figures to the 2012 report, representing a still negative, unsustainable growth. The second part of the study looks at adapting the Inclusive Wealth Index to a subnational level, revealing large regional discrepancies between the Eastern Province and the Central regions, such as Mecca, Riyadh and Medina.
Thesis Supervisor: Kenneth Strzepek
Title: Research Scientist, MIT Joint Program
Professor Emeritus of Civil, Environmental, and Architectural Engineering, University of Boulder at Colorado
Thesis Supervisor: Olivier L. de Weck
Title: Professor of Aeronautics and Astronautics and Engineering Systems Co-Director, Center for Complex Engineering Systems at KACST and MIT
Acknowledgments
First and foremost, I cannot express my gratitude at the fortune of having two most inspi-rational supervisors, in the skies and on the ground -Prof de Week and Prof Strzepek. Prof de Week for daring visions and stern support, for taking that backpack from me and letting me explore, and Prof Strzepek for teaching me to pursue economic science at large and in detail, for contextualizing sustainability. Thank you both for being exceptional mentors on this journey and for your patience.
My gratitude goes to my colleagues at KACST who contributed to the efforts over
the past two years, as well as KACST for financial sponsorship of my work. Especially my heartfelt thanks goes to Ms. Katherine Paras for guiding and supporting me around
KACST. And, of course, to Sarah and Aziz, my greatest lab-mates!
A big thank you to the TPP administration, to Barbara, Ed and Dr. Frank Field. Thank
you, for the advice, guidance and your incredible sense of humor!
I would also like to thank Prof Ashford, for teaching me how to ask uncomfortable
research questions about the search of sustainability, from my very first day at MIT. Thank you to Dr. Munloz for an accelerated course on the Inclusive Wealth Index and for helping to frame this work. It was truly a pleasure working with you!
Finally, a big thank you to my friends, for celebrating being young and knowledge-hungry in Boston; and to my mother, Elena, for her unconditional love and support from across the world. To Orly for always being there with the kindest and best advice on life. To Mikhail and Raisa Korsunsky for their wisdom and keeping their doors open for me for the last 28 years. Et grand merci A toi, mon ami, pour ta patience et l'amour. Onwards we go!
Contents
1 Introduction: Sustainable Development in the Kin
1.1 Problem Introduction . . . .
1.2 Research Questions and Goals . . . .
1.3 Structure and Approach . . . .
2 Measuring Sustainability
2.1 Definitions of Sustainability . . . . 2.2 Metrics of Sustainability . . . .
2.3 Conclusion . . . .
3 Inclusive Wealth Index: Theory and Methodology
3.1 Theoretical Foundations . . . .
3.2 Three Capitals: Natural, Human, and Produced . .
3.2.1 Natural Capital . . . .
3.2.2 Produced Capital . . . .
3.2.3 Human Capital . . . .
3.3 Applying theory to practice . . . . 3.4 Conclusion . . . .
4 Inclusive Wealth Index for the Kingdom of Saudi
4.1 What does IWI 2012 and 2014 say about KSA? . . 4.2 Adapting methodology and data for Saudi Arabia
4.2.1 Natural Capital . . . . 4.2.2 Human Capital . . . . 4.2.3 Produced Capital . . . .
gdom of Saudi Arabia
. . . . . . . . . . . . . . . . . . . . . . . . Arabia
4.3 Sensitivity . . . . 4.3.1 Elasticity of the parameters 4.3.2 MinMax analysis of IWI . 4.3.3 Volatility . . . . 4.4 R esults . . . . 4.4.1 Natural Capital . . . . 4.4.2 Human Capital . . . . 4.4.3 Produced Capital . . . . 4.4.4 National Inclusive Wealth Index 4.5 Conclusion . . . ...
5 Subnational Sustainable Development: opment Indices 5.1 Europe . . . . 5.2 East Asia . . . . 5.3 North America . . . . 5.4 Middle East . . . . 5.5 Conclusion . . . .
6 Regionalizing IWI for KSA
6.1 Methodology Adaptations . . .
6.1.1 Natural Capital . . . . .
6.1.2 Human Capital . . . . .
6.1.3 Produced Capital . . . .
6.2 Regional Inclusive Wealth Index
6.2.1 Regional Natural Capital
6.2.2 Human Capital . . . . .
6.2.3 Produced Capital . . . .
6.2.4 Overall IWI . . . .
6.3 Conclusion . . . .
Results
7 Using Inclusive Wealth Index for policy-making Arabia 55 55 56 56 57 58 61 61 63 65
Rationalization of National
Devel-67 67 68 69 70 72 73 73 74 77 77 80 80 83 85 87 91
in the Kingdom of Saudi 93
7.1 V ision 2030 . . . 93
7.2 Insights into Regionalization of the Index . . . 94
7.3 Questions of Interdependency of Resources: Water . . . 95
7.4 Questions on Sovereignty of Wealth . . . 97
7.5 C onclusion . . . . 98
8 Summarizing Conclusions and Future Research 101 8.1 C onclusion . . . 101
8.2 Future Research . . . 103
List of Figures
1-1 Gross Domestic Product (PPP in 2001 USD) and Humand Development In-dex across the years. Source: World Bank[7] and UN Human Development In d ex [19] . . . 18 1-2 Saudi Population: past and future projections. Source: World Bank[7] . . . . 19
2-1 Global Overview of the GDP growth in 2016. Source: International Mone-tary Fund, World Economic Outlook (April 2016). Available at : IMF Data Mapper, http://www.imf.org/external/datamapper [181 . . . . 24 2-2 Global Overview of the HDI in 2016. Source: Human Development Report
2016. Available at:
http://hdr.undp.org/en/content/human-development-index-hdi [19] . . . 26
2-3 Global Overview of the Ecological Footprint for the world in 2016. Source:
Global Footprint Network. Available from: http://www.footprintnetwork.org/countries [2 0 ] . . . 2 7 2-4 Global Overview of the Happy Planet Index in 2016. Source: Happy Planet
Index: 2012 Report. Available from: http://neweconomics.org/2012/06/happy-planet-index-2012-report [211 . . . 28 2-5 Global Overview of the Growth in the Inclusive Wealth Index and the
Inclu-sive Wealth Index per capita by 2014. Adapted from UNEP IncluInclu-sive Wealth R eport 2014.[9] . . . . 29
3-1 Percentage change of IWI for Europe. Source: Inclusive Wealth Report 2014,
p .56 [9] . . . 4 2
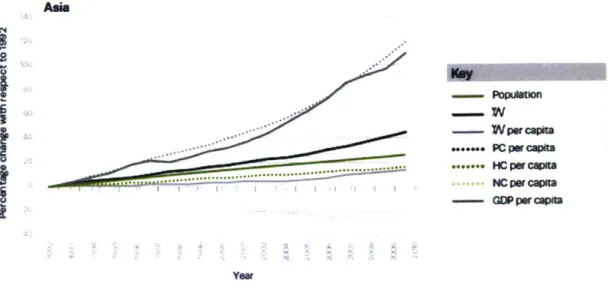
3-2 Percentage change of IWI for Asia. Source: Inclusive Wealth Report 2014, p.
4-1 The Inclusive Wealth Index results for Saudi Arabia from Inclusive Wealth
R eport 2012 [8] . . . ..
4-2 The Inclusive Wealth Index results for Saudi Arabia from Inclusive Wealth
R eport 2014 [91 . . . .
4-3 The Inclusive Wealth Index per capita results for Saudi Arabia from Inclusive
W ealth Report 2012[8] . . . ..
4-4 The Inclusive Wealth Index per capita results for Saudi Arabia from Inclusive
W ealth Report 2014 [91 . . . ..
4-5 Recalculating the reserves' depletion. Example for oil. . . . ..
4-6 Saudi Labour Force Participation variation with time . . . .. 4-7 Mortality in Saudi Arabia variation with time . . . .. 4-8 Saudi Population variation across the age cohorts . . . .. 4-9 Elasticity of the parameters of IWI . . . .. 4-10 Min and max range of values for the total IWI . . . ..
4-11 Trajectories of the 1000 oil prices simulations for 1990 until 2008, modeled using GBM. Source: Inclusive Wealth Report 2014, p.2 1 3 [91 . . . .
4-12 Recalculating the IWI using 3 year average over 20 years average . . . . ... 4-13 Recalculations of the Agricultural Wealth using Saudi data and adapted methodology, compared with the results from the Inclusive Wealth Reports
2012 and 2014.[8,[91 All are normalized to USD (2005) . . . ..
4-14 Recalculating the Fossil Fuels Wealth using Saudi data and adapted method-ology, compared with the results from the Inclusive Wealth Reports 2012 and
2014.[8],[9] All are normalized to USD (2005) . . . ..
4-15 Calculations of the Minerals Stocks Capital . . . .. 4-16 The Fisheries stocks Capital . . . .
4-17 Recalculations of the forests stocks using Saudi data and adapted methodol-ogy, compared with the results from the Inclusive Wealth Reports 2012 and
2014.[8],[9] All are normalized to USD (2005) . . . ..
4-18 Human Capital calculations in comparison with Inclusive Wealth Reports 2012
and 2014.[8],[91 All are normalized to USD (2005) . . . ..
4-19 Produced Capital results in comparison with Inclusive Wealth Reports 2012
4-20 Recalculating the IWI and its rates . . . 63
4-21 Recalculating the IWI per capita and its rates . . . 63
4-22 Comparison between the IWI calculations for Saudi Arabia from the Reports of 2012 [8], and 2014 [9] and this study . . . . 64
4-23 Comparison between the IWI per capita calculations for Saudi Arabia from the Reports of 2012 [8], and 2014 [9] and this study . . . . 65
5-1 Regional Competitiveness Index results across Europe. Source: Regional Competitiveness Index 2013 [60] . . . . 68
5-2 NLDI values produced for the provinces of the Saudi Arabia and the provinces of the Netherlands in 2006, with their average values (dashed line). Based on the data from National Centers for Environmental Information of National Oceanic and Atmospheric Administration.[66], [69] . . . . 71
6-1 An example of locations search. Source: International Atomic Agency[51] . . 75
6-2 Night-lights over Saudi Provinces in 2006. Image rendered using ArcMAP 10 softw are . . . . 79
6-3 Overview of the Natural Capital by regions . . . . 80
6-4 Map of the Natural Capital by regions without and with Fossil Fuels for 2013 81 6-5 Natural Capital by regions, 1999-2013 . . . . 81
6-6 Natural Capital without Fossil Fuels, 1999-2013 . . . . 82
6-7 Human Capital by regions, 1999-2013 . . . . 83
6-8 Maps Human Capital Variation for the Saudi and Expats Capitals and their changes between 1999 and 2013 . . . 84
6-9 Overview of the Human Capital by regions, 1999-2013 . . . . 84
6-10 Overview of the Produced Capital by regions, 1999-2013 . . . 85
6-11 Produced Capital by regions, 1999-2013 . . . . 86
6-12 Map of the Produced Capital variation and changes in the Produced Capital, between 1999 and 2013 . . . 86
6-13 IW I by regions . . . . 87
6-16 Inclusive Wealth breakdown per capita . . . . 88
6-17 Comparison between the IWI calculations for Saudi Arabian regions in abso-lute changes: IWR2012, IWR2014 and IWI-KSA.[8,[9] . . . 88
6-14 Inclusive Wealth breakdown across the provinces, 1999-2013 . . . . 89
6-15 Inclusive Wealth per capita breakdown across the provinces, 1999-2013 . . . . 90
6-18 Comparison between the IWI per capita calculations for Saudi Arabian
re-gions in absolute changes. IWR2012, IWR2014 and IWI-KSA.[8],[9] . . . 91
7-1 Historical overview of the crops production of Saudi Arabia. Source: FAO [30] 97 7-2 Estimation of the water use for the crops using the Water Footprint modelling
data. Source: 'The green, blue and grey water footprint of crops and derived crop products. Vol 1.' [23] . . . 97
List of Tables
2.1 Overview of Sustainability metrics . . . . 23
3.1 Key variables and data sources used in the measurement of Agricultural Cap-ital stocks in IW R2014 [9] . . . . 36 3.2 Key variables and data sources used in the measurement of Fossil Fuels
Cap-ital stocks in IW R2014 [9] . . . 39
3.3 Key variables and data sources used in the measurement of Minerals Stocks in IW R 2014 [91 . . . 39
3.4 Key variables and data sources used in the measurement of Fisheries stocks in IW R 2014 [9] . . . 39
3.5 Key variables and data sources used in the measurement of Produced Capital stocks in IW R2014 [9] . . . . 41
3.6 Key variables and data sources used in the measurement of Human Capital stocks in IW R2014 [9] . . . . 42
4.1 Key variables and data sourced used in the measurement of Agricultural Cap-ital stocks . . . 49 4.2 Key variables and data sourced used in the measurement of Fossil Fuels
Cap-ital stocks . .. .. . . . .. . . .. . . . .. . . . . . 50
4.3 Key variables and data sourced used in the measurement of Minerals Stocks 51
4.5 Key variables and data sourced used in the measurement of Forests Stocks . 52
4.4 Key variables and data sourced used in the measurement of Fisheries Stocks 53
4.6 Key variables and data sourced used in the measurement of Human Capital Stocks . . . .. .. . . . .. . 53
6.1 Key variables and data sourced used in the measurement of Agricultural Cap-ital stocks for Regional Level . . . . 74
6.2 Variables used for Minerals information and their sources . . . . 76 6.3 Key variables and data sourced used in the measurement of Human Capital
C apital Stocks . . . . 77
6.4 Key variables and data sourced used in the measurement of Produced Capital C apital Stocks . . . 78
Chapter 1
Introduction: Sustainable
Development in the Kingdom of
Saudi Arabia
1.1
Problem Introduction
Historically, the Kingdom of Saudi Arabia (KSA) has always been centrally governed. Since
1970, the government has been issuing National Plans, which are 'blueprints of reforms',
sets of forward-looking policies.[1] Particularly, the last two Plans, the Ninth (2010-2014)[2] and the Tenth - Vision 2030[3] - have been calling for diversification of the economy. Vision 2030, in particular, supports the continued shift of the economy away from its dependence on the vast oil reserves. For instance, the Kingdom plans for non-oil exports' share of GDP to increase from 15% to 50% by 2030.[4]
The metric that the Kingdom is notably using for its development is Gross Domestic Product (GDP). The Kingdom's GDP growth rate has been on average around 4% over the past ten years, oscillating between 0.2% (2013) and 10% (2011)1-1[5], which follows the trend of oil prices quite closely. However, the GDP growth rate as a measure tells us little about the sustainable development of a country. Figure 1-1 shows an increase of the Human Development Index, however, that too shows only a facet of development and alone it does not answer the question of the substitutability of the progress.
fea-Trends in Gross Domestic Product and Human Development Index 1 1.8 X 0.9 1.6 c 0.8 1.4 0.7 01.2 0 E 0.6 0.5 00.8 CU 0.4 . 0.6 c0.3 E 0.2 0.4 0.1 0.2 0 0 0
- HDI - GDP, PPP (constant 2011 international $)
Figure 1-1: Gross Domestic Product (PPP in 2001 USD) and Humand Development Index across the years. Source: World Bank[7] and UN Human Development Index [19]
sibility of high economic growth is threatened by the underdevelopment of social and physical infrastructure, according to A. San.[6] The problem could be exacerbated in the light of
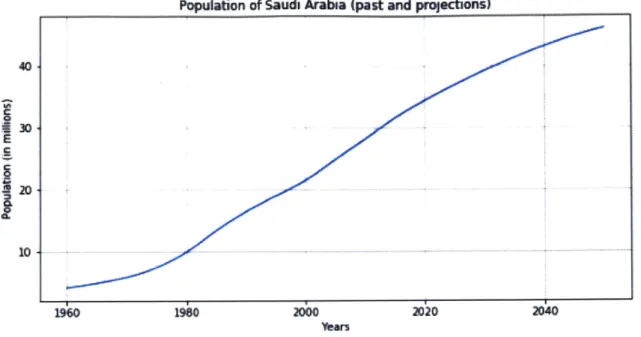
Saudi Arabia's rapidly growing population. The annual population growth rate has been between of 2 and 3%, which will result in a 50% increase in the population from its current levels by 2040, (see fig.1-2). This demographic transition will naturally lead to an associated increase in demand for resources such as potable water, energy, transportation services, as well as employment and social support systems, such as hospitals and universities.
The National Plans have always been sets of forward-looking policies for the development of the country. However, there are a number of concerns about using GDP as a metric for capturing economic development. In order to support the population and the country's stability, it is in the government's interest to ensure the development is sustainable: with a strong economic base but also with an equal support for its social and environmental resources. In the recent governmental calls for accountability and stricter auditing in all sectors, introducing a measure of the sustainable development could be an important tool.
Population of Saudi Arabia (past and praj.ctions)
40-
120-10 19q0 1960 2000 2020 2040 VearsFigure 1-2: Saudi Population: past and future projections. Source: World Bank[7
1.2
Research Questions and Goals
The focus of this thesis is the application of the Inclusive Wealth Index (IWI) as a metric for sustainable development. There have been two global IWI assessments done in the past, in 2012 and 2014.[8],[9] However, for its application in policy-making on either national or subnational level by the Saudi government, there is a question of whether a global-scale metric is relevant and suitable as a basis for decision-making. This thesis explores this issue
by attempting to answer the following research questions:
1. Is IWI an appropriate metric for Sustainable Development analysis?
2. If so, to what extent is the globally estimated IWI an appropriate metric for the Kingdom of Saudi Arabia?
3. If it appropriate, how can the IWI be used for policy making when it is a
backward-looking metric, capturing the past?
Finally, the Kingdom of Saudi Arabia is a large country with different regions holding various resources. Therefore, the objective of this research is to introduce a subnational spatial dimension to the metric to allocate the resources. The final question is therefore:
4. For a large country such as KSA, to what extent could the IWI metric be applied regionally?
1.3
Structure and Approach
This thesis is divided into three major parts, spanning seven chapters. Part I presents an overview of the various sustainability metrics (Chapter 2), the underlying theory and methodology for the IWI (Chapter 3) and the relevance of the results of the existing global assessments done in 2012 and 2014 for KSA, before concluding with the results of the updated assessment on the national level (Chapter 4).
Part II is an investigation of the fourth research question, providing an overview of literature on regionalizing the global development indices (Chapter 5), and revision of the methodology to overcome any data sparsity issues on the Saudi subnational scale (Chapter
6).
Part III discusses the application of IWI for the policy-making specifically in the King-dom (Chapter 7) and addresses the third and fourth research questions.
Finally, Chapter 8 draws conclusions from the study, makes recommendations for policy-making, and proposes new questions for future work.
Chapter 2
Measuring Sustainability
In September 2015, all 193 member states of the United Nations adopted the 17 Sustainable
Development Goals (SDGs) as a successor to the Millennium Development Goals agreed
on in 2005. The SDGs include 169 specific targets, cutting across the three dimensions of development: economic, social and environmental. The agreement is non-binding. However, despite this diplomatic effort, the high number of SDGs and specific objectives reflect the complexity of such an agreement. Sustainability as such, is a concept hard to define, let alone to measure due to its multifaceted nature. This chapter provides an overview of the concepts involved in the definition, and a list of the most popular metrics currently in use for the governments to capture sustainable development progress.
2.1
Definitions of Sustainability
Historically, the concept of sustainability has been a challenge to capture and define. The most frequently quoted definition is from the Brundtland Commission's report: Sustainable
development is the kind of development that meets the needs of the present without compro-mising the ability of future generations to meet their own needs.[11] The definition suggests
that the Commission mostly expects that the future generations will have no less of the means to meet their needs than we as the current generation do, leaving the debate open on the issues of intergenerational justice. For instance, it implies that the current generation should leave as much of the 'productive' base as it had itself inherited. However, there is no mention as to how this productivity base could be measured. The Nobel Prize winner, Robert Solow in his 1991 speech entitled "Sustainability: An Economist's Perspective " puts
forward that sustainability needs to be defined as the societal outcomes that allow future generations to be at least as well off as people are today, which agrees with the Brundtland definition. It is not that sustainability requires saving specific resources; in fact, it is that there is sufficient capital, a combination of human, physical and natural, to maintain the living standards of today. [12]
This definition has been extended further: Ashford and Hall [13j differentiate it to four dimensions through the Global System for Sustainable Development (GSSD):
" Economic production & consumption, whereby economic production and consumptions
do not threaten ecological systems,
" Ecological configuration, whereby ecological systems exhibit balance and resilience,
" Governance & Politics, whereby governance models reflect participation and
respon-siveness,
" Institutions & Performance, whereby institutions demonstrate adaptation and feed-back
Within the scientific and policy-making communities, there is a fundamental debate on whether to follow strong or weak notions of sustainability. For strong sustainability there cannot be any depreciation in the stock of Natural Capital, because the Human Capital cannot substitute the life-support systems of the planet of the Natural Capital.[141 Strong sustainability implies that non-renewable resources cannot be depleted. By contrast, weak sustainability allows for one capital depletion to replace another capital of equal value, i.e. Human Capital can substitute for Natural Capital.
2.2
Metrics of Sustainability
Table 2.1 provides a summary of most popular metrics in chronological order in the domain of sustainability, such as Gross Domestic Product, Human Development Index, Ecological
Footprint, Happy Planet Index, Adjusted Net Savings and Inclusive Wealth Index. Below is
Table 2.1: Overview of Sustainability metrics
Economic domains Environmental domains
Inter-Social domains generational aspects
Consumption,
Gross Investment,
Domestic Governmental
Product Spending, Exports
and Imports
Human Gross National Life expectancy
Development Index at birth,
Index schooling
Ecological Production, Materials and
Footprint Import-exports, Energy flows
consumption
Happy Planet Ecological Experience
Index Footprint Well-being, Life
Expectancy Agriculture,
National Forests, Oceans,
Adjusted Net Accounting Energy and
Savings aggregates: emissions, Water Population
savings, depletion, and sanitation,
and degradation Environment and
health
Fossil Fuels, Life expectancy,
Inclusive Gross Capital Agriculture, Schooling,
Wealth Index Formation Forests, Fisheries, Mortality rates, Captured
Minerals Population
Gross Domestic Product
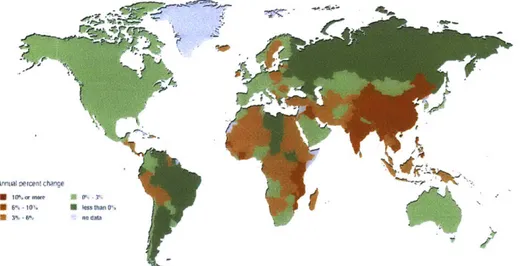
Initially introduced in the 1930s, the Gross Domestic Product (GDP) stays as one of the most popular - although as we argue below - controversial measures of the sustainable development. Global Overview of the GDP growth is presented in fig. 2-1. The GDP is captured by the following equation:
GDP = C+I+G+(X-M),
where C is consumption, I is investments, G is government expenditure, X is exports, and M is imports. This equation captures the flow of goods and services through the markets' transactions. However, even the chief architect of the measure, Simon Kuznets, is said to have warned "against equating its growth with well-being."[151 GDP takes account of the economic activities, many of which do not advance "real" economic development. Much of the literature on development argues that using the GDP as the sole metric prioritizes the gross revenue of a country at the expense of profitability, efficiency, sustainability, or flexibility.
116]
Annual oercent change
*:10% or awe 0%,1
S 6% -1 al. Imes than 0%
S 3% -6% -na da
Figure 2-1: Global Overview of the GDP growth in 2016. Source: International Mon-etary Fund, World Economic Outlook (April 2016). Available at : IMF Data Mapper, http://www.imf.org/external/datamapper [18]
In fact, as Constanza et al. further point out, "increased crime, sickness, war, pollution, fires, storms, and pestilence are all positive for GDP because they increase the economic activity". [16] One of the most remarkable examples is the aftermath of the Deepwater Horizon oil spill in 2010. Despite the destruction of jobs and the environment, the event's contribution
to the local GDP was, in fact, positive, showcasing the danger of using this metric for sustainability. The GDP also does not capture the nature of the economy. Saudi Arabian GDP's average growth of 5-6% over the last ten years is comparable to that of South Korea, for instance. However, the primary driver for the growth has been the vast oil reserves, whereas South Korea's was its manufacturing industry. In the first case the natural resources (oil) are being depleted; in the second they are sustained. The GDP does not capture any of these aspects.
Human Development Index
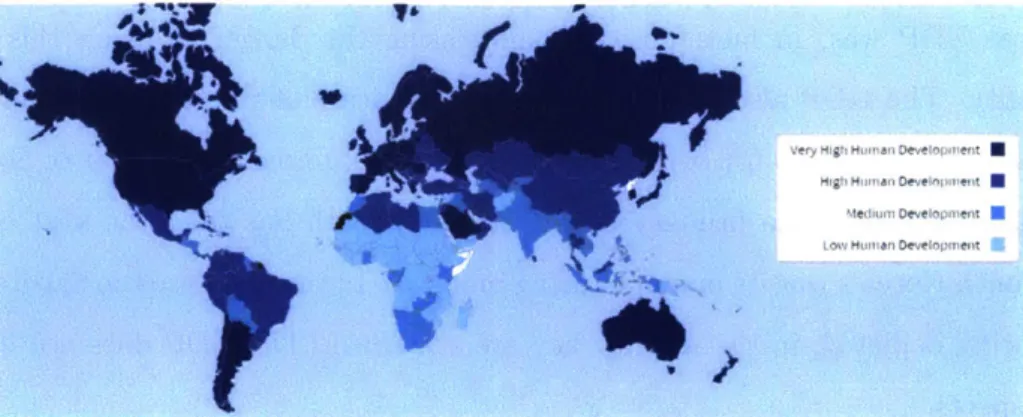
The emphasis of the Human Development Index (HDI), a metric devised in 1990, is people, as the name suggests. The human capital is identified as a critical determinant of growth and poverty alleviation, highlighted by the United Nations Millennium Development Goals and the Sustainable Development Goals.[17] It is assessed annually and in the 2016, among the the highest-scoring countries were Canada, the USA, Australia, and Saudi Arabia. Among the lowest human development indices was most of the Sub-Saharan Africa, Syria and Papua-New Guinea (see fig. 2-2)
HDI comprises three components (Table 2.1): life expectancy at birth, expected and mean years of schooling, and Gross National Income based on purchasing power parity. These three are thought to contribute to a long and healthy life, knowledge and a decent standard of living.[19]
The index then allows us to rank the countries annually. However, whereas this indicator is designed to complement GDP, it fails to take into account the population size, or the state of natural resources in a country. Therefore, it may not be a sufficient metric for measuring sustainable development.
'Yb
High Human Develnpment
Medium Development
tovi Human Development
Figure 2-2: Global Overview of the HDI in 2016. Source: Human Development Report 2016. Available at: http://hdr.undp.org/en/content/human-development-index-hdi [19]
Ecological Footprint
Unlike the HDI, the Ecological Footprint, created in 1992, captures the elements of environ-ment and economic activities.[20] Fundaenviron-mentally, it has been designed to measure demand on and supply of nature at a particular moment on a national, regional or municipal level
(see fig.2-3).
The supply and demand refer to the dynamics of a regional biocapacity, which is mea-sured by the rates of resources consumption, waste generation, waste absorption, and re-source generation (see Equation 2.1). The former two are measured as energy, settlement, timber and paper, food and fiber, and seafood. The latter two are measured in the car-bon demand of various land coverages: built-up, forests, croplands, pastures, and fisheries. The units for the measures are global hectares, whereby one global hectare is the average productivity of all biologically productive areas on earth in a given year.
EFc = EFp + (EF - EFE) (2.1)
where EFc is the ecological footprint of consumption, which indicates the consumption of biocapacity by a country' (or region') inhabitants.
EFp is the ecological footprint of production, which looks at the consumption of bioca-pacity resulting from production processes, within a given geographic area, such as country or region. This measure mirrors the GDP
(EFI-EFE) is the net ecological footprint of trade that indicates the use of biocapacity within international trade.
EcologicalFoUtprint of consumption eccaina blocapacity BIcapacy sxceods Ecological Footprint of consumpten >150 % 0 -50%
100- 150% = S -100 %
50- 100 % 1 150 %
0 50% >150%
Figure 2-3: Global Overview of the Ecological Footprint for the world in 2016. Source: Global Footprint Network. Available from: http://www.footprintnetwork.org/countries/ [20]
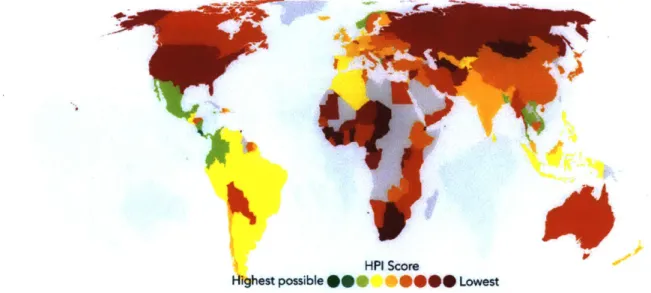
Happy Planet Index
Created in 2006, the New Economics Foundation's Happy Planet Index looks at the human well-being and the environmental impact. [21] The Happy Planet Index is measured in global hectares per capita. Its equation is as follows:
HPI = Wellbeing * Life expectancy * Inequality of outcomes (2.2)
Ecological Footprint
where Wellbeing is captured by surveys collected by the Gallup World Poll on "How satisfied
the residents of each country say they feel with life overall, on a scale from zero to ten. [22] Life Expectancy is an average number of years a person is expected to live in each country
based on data from the UN.
Inequality of outcomes measures the inequalities between people within a country based
on life expectancies and happiness perceptions. Inequality of outcomes is expressed as a percentage
Ecological footprint is the average impact that each resident of a country places on the
HPI Score
Hfghest possible 104*
*090
LowestFigure 2-4: Global Overview of the Happy Planet Index in 2016. Source: Happy Planet In-dex: 2012 Report. Available from:
http://neweconomics.org/2012/06/happy-planet-index-2012-report [21]
look at any economical impact and population size. Furthermore, the index is only available for the year 2012, due to limitation in the data availability. The overview of the global results is given in fig. 2-4.
Adjusted Net Savings
Also known as G enuine Savings, Adjusted Net Savings (2014)[23] -introduced in 2014 - looks at the changes in annual wealth, and the total amount of natural, human-made, and human capitals. It monitors whether the depletion of natural capital, such as minerals or forests, is compensated for by investment in other assets, such as human capital or infrastructure. [241
By definition, the Adjust Net Savings is net investment in produced capital minus net
depre-ciation of natural capital plus the investment in human capital (education). [25] This metric follows the sustainable development goals, as well as the UN Millennium goals.
However, this metric assumes a constant population, and as the population has grown in all countries, it is unclear how the findings could be interpreted. Furthermore, by capturing a global set, the size of the sample is so large for these particular calculations, that the limitations in data compelled the authors to ignore changes in a number of potentially important capital assets, such as fossil fuels.[26]
Inclusive Wealth
The United National Environmental Program (UNEP) provided a new methodology, based on Nobel Prize Economist Kenneth Arrow's work on the Inclusive Wealth (IW) theory. In 2010 Kenneth Arrow et al. developed a theoretical framework for assessing whether economic growth is compatible with sustaining well-being over time.[26] This framework integrates natural, human, and reproducible capitals, as well as population growth, technological and health aspects. The largest deviation from the Adjusted Net Savings is the emphasis on the IW on the intergenerational aspect of sustainable development. The wealth creation for the current generation should not be occurring at the cost of the future generation. In other words, by sustainable development we mean a pattern of societal development along which
(intergenerational) well-being does not decline. [26],[27]
Growth in Inclusive Wealth Index
Growth in Inclusive Wealth Index per capita M>,1 0 <_1
M tol [ no data M- to O
Figure 2-5: Global Overview of the Growth in the Inclusive Wealth Index and the Inclusive Wealth Index per capita by 2014. Adapted from UNEP Inclusive Wealth Report 2014.[9]
The IW focuses on the three main categories of capital for which relatively good global data is available. A nation's capital asset include natural capital (e.g. oil resources, land), produced capital (e.g. infrastructure, equipment, factories) and human capital (e.g.
edu-cation, population). The Produced Capital essentially represents the entirety of the list of capital assets: accumulation of reproducible, or otherwise known as "manufactured" capital. Human capital is not transferable without cost from one person to another, because educa-tion is a means as well as an ends carrying an intrinsic worth, as the authors of the report point out. Finally, the Natural Capital refers to stocks of nature which produces a range of ecosystem services
A note needs to be made about the research on social capital (from governance to
performance), mentioned above in the four categories by Ashford and Hall[13]. In this IW Framework, the social capital, such as institutions, culture, and religion, are treated as enabling assets: they enable the allocation of goods and services. The present discounted value of social well-being as a function of the current stocks of capital assets acts as the social capital in the allocation of resources.[28] The creators acknowledge that the IWI may also be suffering from the lack of data for practical policy-making, but they also allude to the case of GDP. Often when the government is missing data necessary for GDP, it nonetheless continues to use the GDP for economic policymaking.
Currently, the Inclusive Wealth looks only at the historical data. The Inclusive Wealth
Report 2012 focused on the 20 countries from 1990 until 1998 whereas the Inclusive Wealth Report 2014looked at 140 countries between 1990 and 2014, by studying the Index at a
specific time and its growth (see fig. 2-5).
2.3
Conclusion
The above section provides insight into factors of sustainability, followed by an overview of the most commonly used metrics. Sustainable development needs to include environmental, social, and economical aspects, as well as the intergenerational aspect. This review finds that GDP may not be sufficient because it does not capture the elements necessary for sustainable development, and in fact can show false positives, i.e. for the Deep Horizon incident in 2010. The trio of the Human Development Index, Ecological Footprint and the
Happy Planet Index tend to cover only two of the three domains of the environment, social
and economy at a time. The Human Development Index fails to capture the environmental aspects; the Ecological Footprint falls short of capturing the social domains, and the Happy
There are only two measures from the list that incorporate elements from all three of these aspects: the Adjusted Net Savings and the Inclusive Wealth Index. However, unlike the Adjusted Net Savings, the Inclusive Wealth Index captures the intergenerational aspect needed for sustainable development. The next chapter studies the Inclusive Wealth Index in greater detail before investigating how to apply it to the Kingdom of Saudi Arabia.
Chapter 3
Inclusive Wealth Index: Theory and
Methodology
The methodology used for the Inclusive Wealth Reports 2012 and 2014 (IWR 2012 and IWR 2014 respectively[8],[9]) is adapted by UNEP's Pablo Mufioz from the work on "Sustainability and the Measurement of Wealth" by Kenneth Arrow, Partha Dasgupta and others (2010) [26]. The methodology below describes the underlying theory and the methodology used in those reports.
3.1
Theoretical Foundations
Let us begin with defining sustainable development as a pattern of societal development
along which intergenerational well-being does not decline.
Therefore, the intergenerational well-being V(t) is
V(t) = j U(C(t))e--(T-t-)]d7, > 0 (3.1)
where C(t) denotes a vector of consumption flows at time t and 6 is the discount rate,
U(C(t)) is utility (the satisfaction that one enjoys from consuming goods and services) flow
at time T. The flow of goods and the services can vary from material goods to services nature provides (including. among others, aesthetic gratification or spiritual values).
In order to get the criterion for sustainability, we first do a substitution in Equation 3.1 using the Equation 3.2 to specify intergenerational well-being at t, V(t), and a set of vector
stocks of capital assets at time t and M, representing evolution of the political economy.
V(t) = V(K(t), M, t) (3.2)
Using the chain rule, the Equation 3.1 could be differentiated with respect to time, giving us the criterion for sustainability discussed in the previous chapter, here below in 3.3.
LV
dV(t) =
+
[AV(t)/AKj(t))(dKj(t)/dt]
>0
(3.3)
In order to capture intergenerational well-being for a unit change in the respective capital asset, we define the shadow prices to represent the marginal value contribution,. This is a small change in V(t), denoted by AV(t); and a small change in the capital asset i at time t denoted by AKi(t) in Equation 3.4 below.
Pi(t) =A (t)
for
all i (3.4)To measure the Inclusive Wealth, we take the shadow price of time as
Q(t):
Q(t)
=
AV(t)/At
(3.5)
Therefore, Q(t) measures the shadow price of time as a result of change in social well-being caused by exogenous changes (e.g. changes in international trade prices, over which there is no control). Inclusive Wealth treats time as a surrogate for such exogenous events.
The aggregate index of a country's stock of capital assets can be constructed using the shadow prices as weights. Therefore, the IWI is calculated using Equation below 3.6
W
=Q(t)t + YPi(t)Ki(t)
(3.6)
Where P(t) is the shadow prices of capital assets Ki(t).In order to formalize the relationship between changes in the Inclusive Wealth at constant prices and intergenerational well-being, let A represent the changes in Equation 3.7:
AV(t) - [A t) At +
>
KA(I)] AK (t) (3.7)V(t)
=
Q(t)At + E Pi(t) AKi(t)
Equation 3.8, therefore, shows that changes in well-being are equivalent to changes in wealth (Equation3.7), and this change is equal to the change in the capital asset base, otherwise known as the productive base of a nation. The authors of the Inclusive Wealth Report make a point that the Inclusive Wealth's productive base does not rely solely on the natural systems, but also on a critical level of human and produced capital for the human well-being, as well as for maintaining the levels of these for the present and future generations.
The practical applications of the Equation 3.8 are described below in Section 3.2.
3.2
Three Capitals: Natural, Human, and Produced
The three capitals are Natural, Human and Produced Capitals, which are described in detail below. The general methodology that the IWI follows consists of multiplying a stock by its average price and its rental ratel, as per the equation below (3.9).
Wealth of Resourceti = Stockti - Priceti - Rental Ratei (3.9)
and where the resources are being used in a particular year, t, the stocks are then to be defined by the following expression:
Stockt1 = Stockt + Productiont (3.10)
3.2.1 Natural Capital
Within the IWI model, the natural capital (local ecosystems, biomes, subsoil resources) refers to stocks of nature that are inputs to production, e.g. oil, minerals. These are assumed to be benefits for the human well-being. Natural Capital comprises the following sub-capitals: Agriculture, Fossil Fuels, Minerals, Fisheries, and Forests. Below we discuss how the IWR2012 and IWR2014 treated these sub-capitals.
Rental Rates are defined as "Economic rent is an excess payment made to or for a factor of production over the amount required by the property owner to proceed with the deal"[57]
Agricultural land: Crops and Pastures
Following the general form,given by Equation 3.9, the stocks for agricultural capital are measured in land quantity (separated for crops and pastures), The average global prices using the FAO data (see Table 3.1), and the rental prices found using a proxy from the Global Trade Assessment Project.[29]
Table 3.1: Key variables and data sources used in stocks in IWR2014 [9J
the measurement of Agricultural Capital
Data Variables Sources used
in IWR Quantity of crops FAO [301
produced
Price of crops produced FAO [30]
Rental Rate GTAP [29]
Harvested area in crops FAO[301
Discount rate assumed at
5%
Permanent crops land FAO[301 area
Permanent pasture land FAO [30] area
The average rental price per hectare is defined as follows:
159
RPAj
=A
RjkPjkQjkk=1
(3.11)
where R, P,
Q
are the rental rate of crop k for the j year, price per amount of crops and quantity of production of crop k respectively. A is the area of the harvested crops. "159" refers to the number of crops provided by the FAO.In order to calculate wealth of the hectare (Wha), the following Equation was used:
RPA
-Whaj - = 3
(1+r)t
where r is the discount rate. Therefore, the average wealth values per hectare ( Wha) over
the years of study, y are the following :
Y
Wha = Wha (3.13)
j=1
From Equation 3.13, the total wealth in cropland (WCL) can therefore be derived as:
WCLij = Whai - CLAij (3.14)
where CLA is the physical amount of total cropland area in year
j.
As such, the WCL is the total wealth of cropland in the corresponding year for the country. Similarly, the pasture lands' capital, WPLij is then found by:WPLij = Whai . PLAij (3.15)
where PLA is the physical amount of total pastures land area in year
j.
Fossil Fuels: Oil, Natural Gas, Coal
The methodology for the fossil fuels followed both the general Equations 3.9 and 3.10. One should also note that as a resource is depleted, the rental rate is expected to rise and the capital gains are expected to increase. However, with the increasing scarcity of the resource, the real wealth of the residents would depend on whether the resources are consumed or sold.
In order to calculate the wealth of the fossil fuels, as per the Equations 3.9 and 3.10, the estimates of oil and natural gas consumption, extraction, and proven reserves are taken from the Statistical Review of World Energy and US Energy Information Agency, listed in table 4.2. Proven reserves are the known quantity that is economically recoverable given current technology. Arrow et al. make a note that the estimates for the reserves are the best to the knowledge at a given time and with the improvements in technology, these could be changed.[26] This, however, is not reflected in the IWR2012 and IWR2014.[8],[9]
Minerals
The IWR 2012 and 2015 use the minerals reserves from the US Geological Survey (USGS)
(see Table 3.3). The choice of the minerals is limited to ten: bauxite, copper, gold, iron, lead, nickel, phosphate, silver, tin, and zinc. Stocks were calculated using Equation 3.10.
Fisheries
Fisheries are an asset described in detail in IWR2012. The wealth of fisheries was estimated for only four countries: Australia, Canada, South Africa and the United States due to data scarcity (see Table 3.4). For these countries, 12 species of fish were identified for Australia,
9 for Canada, 10 for South Africa and 80 for the USA. The prices were then found using the Sea Around Us Project[36, which helped to estimate representative prices per ton. These
prices were then averaged over time and multiplied by the fisheries' rental rate. Finally, using Equation 3.10, the total value of the stocks was estimated by multiplying the prices
by the total stock of biomass.
Forests
Forests can be thought of a resource in a dual way: forests for timber and forests for other uses have a value for their ecological services over time. The timber assets are estimated using the density of timber per area. The price was estimated for a weighted average price of industrial round-wood and fuel-wood.
The average rental price over the whole time was estimated using the following steps. First, a conversion for the annually estimated values from current to constant prices using country-specific GDP deflater, then the regional rental rates for time using Bolt et al. [311 (here assumed to be constant). As such, the methodology from Equation 3.9 applied to the proxies above would give the information for the timber wealth of a country.
This contribution was estimated with the following formulation:
T
ESWt =
j
Pt(Qtrt)e-6tdt (3.16)where ESW is ecosystem service wealth, 3 is the discount rate, assumed to be 5%, T is the planning horizon, assumed to be infinite, t is the year studied, Pt is the marginal contribution of the ESW flow to inter-temporal economic welfare,
Q
is the total forest area excludingTable 3.2: Key variables and data sources used in the measurement of Fossil Fuels Capital stocks in IWR2014 [9]
Variables Data Sources used in IWR
Reserves EIA [32]
Production EIA [32]
Prices BP [33]
Rental Rate GTAP [29]
Table 3.3: Key variables and data sources used in the measurement of Minerals Stocks in IWR2014 [9]
Variables Data Sources used in IWR
Reserves USGS [34]
Production US GS [34]
Prices USGS [34]
Rental Rate GTAP [29]
Table 3.4: Key variables and data sources used in the measurement of Fisheries stocks in IWR2014 [9]
Variables Data Sources used in IWR
Fishery stocks Richard et al. [35]
Value of capture fishery SAUP[36]
Quantity of capture SAUP [36], Sumalia et al.
fishery [37]
cultivated forest, and r is the fraction of the total forest area to obtain benefits. The product between Q and r therefore gives the area of the forest in question. The IWR study, using the overview of literature, takes the portion of the whole asset area to be 10%.
3.2.2 Produced Capital
The original method for the Inclusive Wealth proposed by Arrow et al.[26J, makes a careful distinction between the stocks of reproducible capital owned by investors outside of a specific country and stocks owned by the residents. The IWI considers the second type of the stocks. The proposed method is to take estimates of net holdings of international assets from the balance of payment and other IMF data. Arrow et al.[26] note that in developing countries there is little data on accumulated stocks of foreign assets and liabilities.
Reproducible Capital, otherwise known as the Manufactured Capital, is calculated using an approach originally developed by Harberger (1978), the Perpetual Inventory Method(PIM). The initial state of the economy was assumed to be in a steady-state, maintaining the capital-output ratio constant.
k = (3.17)
Where,k is the capital-output ration, I is investment, y is the output of the economy, and
y is depreciate rate of the capital, assumed to be 4%. The ratio was then multiplied by
the output of the economy of the studied country to get a first estimate of the produced capital stock in the initial period, KO. The first estimates were in the 1970s, with the reasoning to minimize errors within the period of studies, as by the 1990s the stocks would have depreciated and be less than 20% of its original value. The PIM allows capturing of the dynamics of the produced capital accumulation by studying the yearly changes in investment. The corresponding formula developed by the authors of the report then becomes the equation below:
t
Kt = (1 - 6)tKo + E Ij(1 - 6)t3 (3.18)
j=1
Table 3.5: Key variables and data sources used in the measurement of Produced Capital stocks in IWR2014 [9]
Data Sources used in Variables
IWR
UN Statistics Division
Investment
[38]
Depreciation rate assumed 4% [39]
Assets lifetime assumed indefinite
3.2.3
Human Capital
Basing the work on the theory of Arrow et al.[26] and Klenow and Rodriguez-Clare[40], the report sets the human capital to be made up of the following components: the life attainment, population, and the shadow price of working, as per Equation 3.19 below. The methodology used for the IWI first calculates human capital per individual, composed of
Edu, which is the educational attainment function which is an equivalent of the average
years of schooling per person, and p, which is the additional compensation over time, fixed at 8.5%. The 2014 report uses a population old enough to be engaged in education, starting from the age of 5, whereas IWR2012 looks at the population that had obtained a basic level of education at the age of 15. The data sources for these calculations are listed in Table 3.6.
Human Capital = e Edu-p -Population(15+Edu) T e6'tdt
STt=
The integral in equation above is the shadow price per unit of human capital with f, the average labor compensation, the T, discounted sum of the wages a person would receive over the expected number of working years. The total number of years working is calculated using age-gender participation rates and mortality rates.
Table 3.6: Key variables and data sources used in the measurement of Human Capital stocks in IWR2014 [9]
Variables Data Sources used in IWR Educational attainment Barro and Lee [41]
Population by age, UN Population Division [43] gender, time
Mortality rates by age, WHO [44] gender, time
Labor Force rates by age, ILO [45] gender, time
Market rate of interest Klenow and Rodriguez-Clare [40]
Discount rate assumed 8.5%
Employment ILO [45], Conference Board [46]
Feenstra et al. [39], UN Statistics Division [43], Compensation of Conference Board [46], OECD [47], Lenzen et
Employees al.[48],
3.3
Applying theory to practice
Let us study the example of a few regions: Europe in fig.3-1 and Asia in fig.3-2.
I
S-
W
... ... r cap . HC pW CP ... NC PWrCBPU -- ampffrowft 20 YewrFigure 3-1: Percentage change of IWI for Europe. Source:
p.56[9]
-Popw
-Wprcput
Ywa
Figure 3-2: Percentage change of
IWI
for Asia. Source: Iriclusive Wealth Report 2014, p. 56. [9]Examining figure3-1 the population is growing steadily, but as the Natural Capital per
capita is declining, the increase in the Human and Produced Capitals per capita compensates
for the decline. Therefore, the overall IWI per capita is positive. The IWI per capita in Asia is positive, as similarly the decline in the Natural Capital per capita is secured by the sufficient increases in the Produced and Human Capitals per capita. In both cases, the IWI per capita follows the GDP and shows that the development of both regions can be considered sustainable.
3.4
Conclusion
The Inclusive Wealth Index is a comprehensive, appropriate metric for sustainable devel-opment that takes into account social, economic and environmental aspects, as well as the inter-generational concept, based on the soft sustainability principles. However, the authors do warn of the limitations and have made a number of assumptions to capture rental rates. These tend to hamper the calculations and may prove to be even harder for developing and transitioning countries. Furthermore, as the authors acknowledge, there may be caveats in the state of knowledge over some resources, such as oil. These resources are environmentally intrinsic, because given the evolving state of art of technologies, we may not know the true value of the quantities available at a particular time.
Chapter 4
Inclusive Wealth Index for the
Kingdom of Saudi Arabia
Having presented the methodology and underlying theory for the IWI in detail in the chapter
3, this section looks at applying this methodology specifically to Saudi Arabia. The prime
research question is to what extent is the global IWI metric applicable to the Kingdom. To answer it, we revisit the results from the reports of 2012 and 2014 and adapt, where possible, the data sources and methods discussed in the previous chapter to the country. The final section then draws comparisons between the two approaches, the global database and the national KSA data.
4.1
What does IWI 2012 and 2014 say about KSA?
To date, there has been two global assessments of the IWI performed by the UN, in the
Inclu-sive Wealth Report 2012 (IWR2012) and the IncluInclu-sive Wealth Report 2014 (1WR2014).[8],[9.
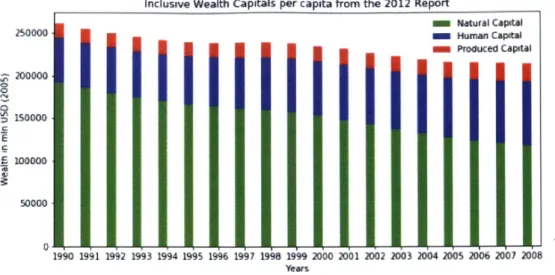
Saudi Arabia's total IWI measured in million USD (2005) in 2008 was 7 946 619 according to IWR 2012; 7 469 646 according to IWR 2014 (figs.4-1 and 4-2). The natural capital in both cases is slowly decreasing, produced capital staying at almost constant levels and the human capital increasing steadily (figs. 4-1 and 4-2). However, if the IWI is studied per
capita (figs. 4-3 and 4-4), the growth of the IWI is negative, due to the population growth
outpacing the Capitals' growth. Therefore, according to the 1W theory, Saudi Arabian's development is not currently sustainable. This is a concern for the policy-makers. As the IWR calculations had been done using the data and methods adapted for the global use,
this section looks if the results will be similar using Saudi data. Therefore, we are revisiting the method and data to be made more relevant to the Saudi context.
Inclusive Wealth index from IWR2012
4000000 430D000 2000000 1000000 0. 1990 1991 1992 1993 1994 1995 1996 1997 19" 1999 2000 201 2002 Yeas 2003 2004 2005 2006 2007 2008
Figure 4-1: The Inclusive Wealth Index results for Saudi Arabia from Inclusive Wealth
Report 2012 [81
Inclusive Wealth Capitals from the 2014 Report 7000000- 60O000-M 5000000 LIn S400000 3000000 2000000 1000000 I Natural Capital - Human Capital Produced Capital 190 1995 200 Years 2005 2010
The Inclusive Wealth Index results for Saudi Arabia from Inclusive Wealth
Report 2014
[91
- Natural Capital m Human Capital Produced Capital Figure 4-2: I'
'
IInclusive Wealth Capitals per capita from the 2012 Report 2 0 Natural capital m Produced Capital S200000 S150000 S100000 50000 S1990 1991 1992 1993 1994 1995 1994 1997 1998 1999 2000 2001 2002 2003 2004 2005 2006 2007 2008
Figure 4-3: The Inclusive Wealth Index per capita results for Saudi Arabia from Inclusive
Wealth Report 2012[81
Inclusive Wealth Capitals per capita from the 2014 report
350000 200000 1250000
~2D0000
E s wwo f-100~100000,
50000. 0 iiisNatural Capitaliiii Hum~an Cap"ta
11 Produced Captal
19k 1991 19k
Ywas
1993
Figure 4-4: The Inclusive Wealth Index per capita results for Saudi Arabia from Inclusive


![Table 3.2: Key variables and data sources used in the measurement of Fossil Fuels Capital stocks in IWR2014 [9]](https://thumb-eu.123doks.com/thumbv2/123doknet/14027495.457853/39.918.238.638.171.419/table-variables-sources-measurement-fossil-fuels-capital-stocks.webp)