HAL Id: hal-02668658
https://hal.inrae.fr/hal-02668658
Submitted on 31 May 2020
HAL is a multi-disciplinary open access
archive for the deposit and dissemination of
sci-entific research documents, whether they are
pub-lished or not. The documents may come from
teaching and research institutions in France or
abroad, or from public or private research centers.
L’archive ouverte pluridisciplinaire HAL, est
destinée au dépôt et à la diffusion de documents
scientifiques de niveau recherche, publiés ou non,
émanant des établissements d’enseignement et de
recherche français ou étrangers, des laboratoires
publics ou privés.
cerasiforme in the evolutionary history of tomatoes
(Solanaceae)
Nicolas Ranc, Stephane Munos, Sylvain Santoni, Mathilde Causse
To cite this version:
Nicolas Ranc, Stephane Munos, Sylvain Santoni, Mathilde Causse. A clarified position for Solanum
lycopersicum var. cerasiforme in the evolutionary history of tomatoes (Solanaceae). BMC Plant
Biology, BioMed Central, 2008, 8, pp.130. �10.1186/1471-2229-8-130�. �hal-02668658�
Open Access
Research article
A clarified position for solanum lycopersicum var. cerasiforme in the
evolutionary history of tomatoes (solanaceae)
Nicolas Ranc
1, Stéphane Muños
1, Sylvain Santoni
2and Mathilde Causse*
1Address: 1INRA, UR1052, Unité de Génétique et d'Amélioration des Fruits et Légumes, Montfavet 84 143, France and 2INRA, UMR 1097 Diversité et Adaptation des Plantes Cultivées, Montpellier 34602, France
Email: Nicolas Ranc - Nicolas.Ranc@avignon.inra.fr; Stéphane Muños - Stephane.Munos@avignon.inra.fr; Sylvain Santoni - Sylvain.Santoni@supagro.inra.fr; Mathilde Causse* - Mathilde.Causse@avignon.inra.fr * Corresponding author
Abstract
Background: The natural phenotypic variability present in the germplasm of cultivated plants can be linked to molecular polymorphisms using association genetics. However it is necessary to consider the genetic structure of the germplasm used to avoid false association. The knowledge of genetic structure of plant populations can help in inferring plant evolutionary history. In this context, we genotyped 360 wild, feral and cultivated accessions with 20 simple sequence repeat markers and investigated the extent and structure of the genetic variation. The study focused on the red fruited tomato clade involved in the domestication of tomato and confirmed the admixture status of cherry tomatoes (Solanum lycopersicum var. cerasiforme). We used a nested sample strategy to set-up core collection maximizing the genetic diversity with a minimum of individuals.
Results: Molecular diversity was considerably lower in S. lycopersicum i.e. the domesticated form. Model-based analysis showed that the 144 S. lycopersicum var. cerasiforme accessions were structured into two groups: one close to the domesticated group and one resulting from the admixture of the S. lycopersicum and S. pimpinellifolium genomes. SSR genotyping also indicates that domesticated and wild tomatoes have evolved as a species complex with intensive level of hybridization. We compiled genotypic and phenotypic data to identify sub-samples of 8, 24, 32 and 64 cherry tomato accessions that captured most of the genetic and morphological diversity present in the entire S. lycopersicum var. cerasiforme collection.
Conclusion: The extent and structure of allelic variation is discussed in relation to historical events like domestication and modern selection. The potential use of the admixed group of S.
lycopersicum var. cerasiforme for association genetics studies is also discussed. Nested core
collections sampled to represent tomato diversity will be useful in diversity studies. Molecular and phenotypic variability of these core collections is defined. These collections are available for the scientific community and can be used as standardized panels for coordinating efforts on identifying novel interesting genes and on examining the domestication process in more detail.
Published: 20 December 2008
BMC Plant Biology 2008, 8:130 doi:10.1186/1471-2229-8-130
Received: 7 August 2008 Accepted: 20 December 2008 This article is available from: http://www.biomedcentral.com/1471-2229/8/130
© 2008 Ranc et al; licensee BioMed Central Ltd.
This is an Open Access article distributed under the terms of the Creative Commons Attribution License (http://creativecommons.org/licenses/by/2.0), which permits unrestricted use, distribution, and reproduction in any medium, provided the original work is properly cited.
Background
Advances in molecular marker development and in genome mapping have resulted in high-density molecu-lar-marker linkage maps in crops, and have provided tools for dissecting the genetic variation of complex traits. Map-based strategies were successfully used for the positional cloning of genes that underlie Quantitative Trait Loci (QTL) [1-3]. Despite the success of these strategies, gene discovery is still limited to those loci that have large effects upon quantitative variation [4].
Over the last few years, there has been renewed interest in the study of naturally occurring variation in crop genetic collections. Motivations for such studies are (i) to use nat-ural allelic diversity for the evaluation of gene function, (ii) to find new genes or new alleles involved in specific aspects of plant physiology or development and (iii) to try to understand the molecular basis of adaptation to local environments [5]. Association genetics or linkage disequi-librium studies test for a statistical association between genotypes at a marker locus and the phenotypes in a set of unrelated individuals [6]. Polymorphisms of interest are detected in a large range of genetic backgrounds. The extent of linkage disequilibrium (LD), the non-random association of alleles at two or more loci, is a sample spe-cific property and depends on the biological model stud-ied. In contrast to the situation in multigenerational pedigrees, LD in natural populations is not broken artifi-cially and we need to overcome this restriction.
The primary obstacle to successful association studies or linkage disequilibrium (LD) mapping is the nature of the genetic structure of populations [7]. The presence of sub-groups with different allele frequencies, within the popu-lation studied, can lead to spurious associations. Domestication of most of modern crops occurred between 10,000 and 5,000 years ago and shaped the allelic frequencies distribution among plant populations. Knowledge about genetic structure can aid in inference of evolutionary history like domestication [8].
The large sample size to be analyzed constitutes another constraint in diversity studies, whereas studying a subset might be more efficient if this sample spans the full range of variation [9]. The first challenge in molecular diversity analysis is thus to sample core collections that better fit the range of morphological and genetic variations found in the global collection. For example, Single Nucleotide Polymorphism (SNP) candidate markers, discovered in a small number of accessions, can be easily genotyped on a larger sample for diversity analysis and association map-ping. Several methods have been proposed for construct-ing core-collections. Some of these take advantage of molecular markers [10] and seem to perform better when used for sampling autogamous plants [11]. The genetic
structure of a core collection has to be checked to avoid spurious correlation between molecular polymorphisms and traits in association studies.
Tomato (Solanum lycopersicum, formerly Lycopersicon
escu-lentum) emerged as a model species for the study of fleshy
fruited plants because of the extent of genetic and genomic resources available [12,13]. The large range of phenotypic variation and large collections of genetic resources available for crops are prerequisites for using an association strategy. The cultivated tomato is highly auto-gamous and shows a large range of morphological diver-sity but low genetic diverdiver-sity compared to other Solanum relatives [14]. This can be explained by successive bottle-necks: (i) domestication associated with isolation of the crop from the Andes (centre of diversity) to Central Amer-ica, (ii) transfer of few cultivars to the Mediterranean basin by conquistadors in the 16th century and (iii)
mod-ern breeding [15]. Cherry tomato, i.e. S. lycopersicum var.
cerasiforme (S. l. cerasiforme), is the expected ancestor of
the domesticated form. In its native Andean region, wild and feral forms can be found and S. l. cerasiforme is also described as highly invasive [16]. Cherry tomato acces-sions are also found as landraces from temperate to sub-artic regions. In Coastal Ecuador and Peru, S.
pimpinellifolium, genetically close to S. lycopersicum and
strictly wild, is found growing in sympatry with tomato landraces and cherry tomato (and also with S. peruvianum and S. hirsutum, two green-fruited species). Wild and feral
S. l. cerasiforme (i.e. cherry type) exhibit two
allozyme-diversity patterns: one similar to the allozyme-allozyme-diversity pattern exhibited by cultivated tomato and another one similar to the wild S. pimpinellifolium allozyme-diversity pattern [17]. Based on isozymes, S. l. cerasiforme acces-sions also show an outcrossing rate comparable to the rate of outbred species [18]. Rick and Holle (1990) suggest that tomato should have undergone natural introgres-sions from wild and feral accesintrogres-sions. Moreover, Nesbitt and Tanksley [19] demonstrated that, around the fw2.2 locus, the S. l. cerasiforme genome is a mosaic between S.
lycopersicum and S. pimpinellifolium genomes due to
fre-quent hybridizations between the two species. This is evi-dence of frequent hybridizations in this autogamous complex of species. The admixture hypothesis of S. l.
cerasiforme has never been tested on the whole genome
and would be further evidence of a natural high rate of hybridization. Moreover, S. l. cerasiforme and S.
pimpinel-lifolium are involved in the domestication of tomato but
the process remains to be clarified.
Molecular markers like simple sequence repeat (SSR) markers have often been used to clarify genetic structure in plants [20-25]. In tomato several studies used SSR markers but focused only on wild relatives [26,27] or on elite germplasm [28,29]. No study used a broad sample of
cultivated, landraces, and wild accessions. The goal of the present study is to clarify the domestication process of tomato and to confirm the admixture status of S. l.
cerasi-forme. To achieve this goal we analyzed the genetic
struc-ture of a genetic resource collection, that includes predominantly S. l. cerasiforme accessions, and we com-pared this to the genetic structure of S. lycopersicum and S.
pimpinellifolium. We assessed the amount of genetic
diver-sity in the collection and sampled nested core collections of wild and cultivated tomato that will be used in future diversity studies. For this purpose we used a set of 20 SSR markers dispersed over the genome to survey the genetic diversity present in a sample of 360 accessions.
Results
Microsatellite diversity
The Microsatellite markers used (table 1) revealed differ-ent diversity patterns in the total collection including green fruited species, S. cheesmaniae (N = 20) and red-fruited accessions (N = 340) (table 2). SSR markers revealed 2 to 26 different alleles and an average of 12.45 alleles per locus. This mean dropped to 3 alleles per locus when rare alleles (i.e. with a frequency lower than 0.05) were removed. In the red-fruited tomatoes group, the average allele number per locus was NA = 7.7 but was equivalent to the total collection when removing rare alle-les (NA = 3.3). The average expected heterozygosity over all loci was 0.496 with large variation among loci (SD = 0.225). Rare heterozygous genotypes were found for all loci in the total collection (HO > 0) but were distributed across individuals.
A much higher genetic diversity was found in wild S.
pimp-inellifolium (HE = 0.58) than in the cultivated S.
lycopersi-cum (HE = 0.25) (table 3). The observed heterozygosity was also higher for S. pimpinellifolium (HO = 0.0591) than for S. lycopersicon (HO = 0.0098). The reason for these het-erozygosity patterns could be the difference in the repro-ductive regime between S. pimpinellifolium accessions and
S. lycopersicum. The S. l. cerasiforme exhibited an
interme-diate pattern of diversity. Genetic structure of the sample
The genetic structure in the red-fruited accession sample was analyzed with the model-based clustering algorithm implemented in the Structure2.0 software (see Methods section for details). To avoid redundancy in the collection, we kept only one individual when several accessions were identified with the same SSR fingerprint at all loci. Hence, 23 individuals (18 S. lycopersicum and 5 S.
pimpinellifo-lium) were removed. Thus, we detected the genetic
struc-ture of a sample of 318 accessions. Because S. l. cerasiforme genome was described as a mosaic between S. lycopersicum and S. pimpinellifolium genomes, all the red-fruited acces-sions were used as a broad sample. S. cheesmaniae and S.
galapagense accessions have not taken part in the
domesti-cation process of tomato and were not included in this analysis.
The Evanno et al. (2005) correction of the Structure2.0 outputs was used (Figure 1). The first peak of ΔK, for K = 2, corresponded to the presence of two main clusters and a potential sublevel of clustering was suggested by the sec-ondary peak of ΔK, for K = 4. The classification of acces-sions into clusters by the model-based method was used to study the sublevel clustering of the red-fruited tomato sample. For all Kopt, memberships were consistent
between all runs.
For Kopt = 2, clustering divided the total sample into two
groups. Group 1 consisted of the main part of S.
pimpinel-lifolium (Table 4) with 20 accessions from S. l. cerasiforme
whereas group 2 consisted of the main part of S.
lycopersi-cum and of the S. l. cerasiforme samples. Group 1
repre-sented the 'wild' part of the sample whereas group 2 represented the 'domesticated' part of the sample. This classification accounted for 35% (p < 0.000001) of the total genetic variance; individuals within group accounted for 51% (p < 0.000001) of the total variance and the var-iance within individuals explained five percent (p < 0.000001) of the total variance. When individuals were assigned with a minimal membership of 70% into a cor-responding cluster, twenty three percent (i.e. 35 individu-als) of the S. l. cerasiforme accessions was in admixture between 'wild' and 'domesticated' groups.
For Kopt = 4, the group 1 divided into subgroups A and B and the group 2 divided into subgroups C and D. When individuals with a membership lower than 70% were not taken into account, the hierarchical AMOVA indicated that 37% (p < 0.000001) of the variance was due to vari-ation among groups, 13% (p < 0.000001) of the variance was due to variation among subgroup within groups and 45% (p < 0.000001) of the variance was due to variation among individuals within subgroup (only five percent (p < 0.000001) was due to variation within individual). Pair-wise estimates of FST indicated a high degree of differenti-ation between the four clusters with values ranging from 0.21 between clusters C and D to 0.64 between clusters A and D (Table 5).
The cluster A consisted of moderate to large fruited indi-viduals with a large part of S. lycopersicum accessions, whereas cluster B consisted of small fruited accessions with the cherry type accessions representing the main part of this subgroup. The 'wild' group was divided into the cluster A and B; both consisted of S. l. cerasiforme and S.
pimpinellifolium accessions. When individuals were
assigned with a minimal membership of 70% into a cor-responding cluster, individuals were found in admixture
Table 1: Characteristics of microsatellite loci Locus name Motif Linkage groupa Map positiona (cM) Primer sequences (5'- 3')
SSR599 [TCATTA]2[TCA]6 9 103.00 GGATTTCTCATGGAGAATCAGTC
TCCCTTGATCTTGATGATGTTG SSR111 [TC]6[TCTG]6 3 73.90 TTCTTCCCTTCCATCAGTTCT TTTGCTGCTATACTGCTGACA SSR14 [ATA]9 3 162.50 TCTGCATCTGGTGAAGCAAG CTGGATTGCCTGGTTGATTT SSR248 [TA]21 10 35.00 GCATTCGCTGTAGCTCGTTT GGGAGCTTCATCATAGTAACG SSR52 [AAC]9 7 3.00 TGATGGCAGCATCGTAGAAG GGTGCGAAGGGATTTACAGA SSR150 [CTT]7 1 115.50 ATGCCTCGCTACCTCCTCTT AATCGTTCGTTCACAAACCC SSR117 [TC]11 1 138.00 AATTCACCTTTCTTCCGTCG GCCCTCGAATCTGGTAGCTT SSR66 [ATA]8 2 25.00 TGCAACAACTGGATAGGTCG TGGATGAAACGGATGTTGAA SSR136 [CAG]7 11 11.00 GAAACCGCCTCTTTCACTTG CAGCAATGATTCCAGCGATA
SSR578 [AAC]6[ATC]5 6 44.00 ATTCCCAGCACAACCAGACT
GTTGGTGGATGAAATTTGTG SSR47 [AT]14 6 6.50 TCCTCAAGAAATGAAGCTCTGA CCTTGGAGATAACAACCACAA SSR594 [TCT]8 8 55.00 TTCGTTGAAGAAGATGATGGTC CAAAGAGAACAAGCATCCAAGA SSR22 [AT]11 3 99.00 GATCGGCAGTAGGTGCTCTC CAAGAAACACCCATATCCGC SSR327 [AAT]7 8 22.50 TCAGGATCAGGAGCAGGAGT TGGACTTGTTCCATGAACCC SSR593 [TAC]7 4 15.00 TGGCATGAACAACAACCAAT AGGAAGTTGCATTAGGCCAT SSR26 [CGG]7 2 77.50 CGCCTATCGATACCACCACT ATTGATCCGTTTGGTTCTGC SSR45 [AAT]14 7 80.00 TGTATCCTGGTGGACCAATG TCCAAGTATCAGGCACACCA SSR20 [GAA]8 12 37.00 GAGGACGACAACAACAACGA GACATGCCACTTAGATCCACAA
SSR70 [AT]20 9 42.00 TTTAGGGTGTCTGTGGGTCC GGAGTGCGCAGAGGATAGAG
SSR188 [AT]11 4 135.50 TGCAGTGAGTCTCGATTTGC
GGTCTCATTGCAGATAGGGC
a Linkage group and map position are based on the tomato EXPEN 2000 map http://www.sgn.cornell.edu/.
Table 1: Characteristics of microsatellite loci (Continued)
Table 2: Microsatellite diversity detected in the total collection and in the red fruited subgroup
Locus name NA a NA, P b HE c HO d
total red-fruited total red-fruited total red-fruited total red-fruited
SSR599 6 4 1 1 0.117 0.023 0.011 0.002 SSR111 14 8 4 5 0.654 0.615 0.033 0.029 SSR14 11 9 4 4 0.621 0.603 0.036 0.035 SSR248 25 18 7 8 0.899 0.888 0.067 0.050 SSR52 5 2 1 1 0.070 0.012 0.003 0.000 SSR150 10 6 2 2 0.294 0.220 0.022 0.021 SSR117 13 6 3 3 0.533 0.478 0.050 0.038 SSR66 8 4 3 3 0.421 0.363 0.017 0.024 SSR136 8 6 4 3 0.457 0.396 0.036 0.029 SSR578 6 2 2 2 0.372 0.309 0.008 0.009 SSR47 26 25 3 3 0.725 0.710 0.046 0.048 SSR594 13 5 2 3 0.517 0.463 0.042 0.032 SSR22 17 9 2 3 0.580 0.532 0.061 0.047 SSR327 14 5 2 2 0.275 0.219 0.039 0.021 SSR593 9 6 2 5 0.574 0.537 0.047 0.038 SSR26 2 2 2 2 0.452 0.425 0.017 0.018 SSR45 20 14 5 5 0.795 0.776 0.081 0.062 SSR20 4 3 3 3 0.334 0.281 0.031 0.021 SSR70 21 17 5 5 0.848 0.832 0.069 0.065 SSR188 17 3 3 3 0.386 0.324 0.025 0.015 Mean (SD) 12.45 7.7 3 3.3 0.496 (0.225) 0.4503 (0.2442) 0.037 (0.022) 0.0303 (0.0178)
between intra-specific groups but most admixture acces-sions were inter-specific admixes (Table 6).
Groups 1 and 2 were considered as main samples and analyzed separately using the same hypothesis. The opti-mum number of sublevel populations within the groups 1 and 2 was two, which is consistent with the Kopt of 4 for the whole sample. Classification of individuals in each cluster was consistent with results based on Structure2.0 outputs of the total sample. For Kopt = 4, there were differ-ences between individual's memberships and species clas-sification (Figure 2). Some individuals were misclassified. We also analyzed the genetic structure of each species sep-arately (see Additional file 1: Determination of Kopt for each species) and the memberships of individuals was consistent with clustering found in the whole red-fruited tomato sample. Individuals previously found in admix-ture clustered in independent groups.
The pattern of genetic diversity within the subdivision was analyzed (Table 6). The two 'wild' clusters presented the highest HE but subgroup A had a low value of HE com-pared to subgroup B. The numbers of statistical pairwise comparisons for non random association of alleles (Table 6) are homogeneous among subgroup A, C and D but much higher for subgroup B and for the 'wild' and 'domesticated' admixed part of S. l. cerasiforme. The clus-tering allowed linkage disequilibrium to decrease in each subgroup compared to the whole sample.
The first axis of Principal Coordinate Analysis of the red-fruited tomatoes separated 'wild' S. pimpinellifolium from 'domesticated' S. lycopersicum (Figure 3). The second axis separated subgroups A and B on one hand and subgroups C and D on the other hand. The S. l. cerasiforme accessions were divided among subgroups B and the admixed clus-ter. The interspecific admixed group showed a continuum between 'wild' and 'domesticated' clusters.
Sampling of the Core collection
Core collections of S. l. cerasiforme accessions were built using the Maximization or M strategy algorithm imple-mented in MStrat software v.4.1. Analyses were first per-formed on all cherry tomato accessions only (144 accessions). Before sampling the core collections, the whole sample was analyzed to compare two sampling strategies. We also determined the size of the smallest sub-set that captured all molecular and phenotypic alleles present in the whole sample. Both molecular and pheno-typic data were used for these analyses. The phenopheno-typic quantitative variables were split into 5 classes of equal dimension (see Methods). Random and M sampling strat-egies were compared. SSR allelic richness (number of alle-les captured if sampling a core collection of n individuals) was calculated for each core collection size. The 20 SSR alleles were used both as markers, to implement the M and random strategy, and target variables, to compare these two strategies (Figure 4a). The difference between the random and M curves indicated that the M strategy performed better in sampling a core collection for the S. l.
cerasiforme sample. The optimal size for the core
collec-tion, obtained at the plateau of the M curve, was reached for 37 S. l. cerasiforme accessions.
Table 3: Pattern of genetic diversity inferred from simple sequence repeat markers among tomato species.
sample number of individual Total number of alleles specific allele numbera HE b H O c S. lycopersicum 130 88 6 0.2479 0.0098 S. lycopersicum var.cerasiforme 144 99 6 0.3816 0.0370 S. pimpinellifolium 66 130 13 0.5781 0.0591 total red-fruited sample 340 154 - 0.4503 0.0300
a specific alleles are identified when they are found only in one sample. b expected heterozygosity, c observed heterozygosity
Determination of Kopt following the method of Evanno et al
Figure 1
Determination of Kopt following the method of Evanno et al. (2005). The rate of change of the posterior probability of the data given the number of clusters is plotted against K, the number of clusters. ΔK was calculated as |L"(K)|/s[Pr(x|k)] (see Materials and Methods). The first peak (K = 2) corresponds to the optimum number of clusters. The secondary peak (K = 4) indicates a sublevel clustering.
0 50 100 150 200 250 300 350 400 450 500 0 1 2 3 4 5 6 7 8 9 10 Δ K K
The phenotypic diversity captured when sampling only with SSR alleles is shown in figure 4b. The plateau of the M curve was reached for 51 individuals and a weak differ-ence in performance between the two strategies was observed.
When both molecular and phenotypic data were used as marker variables (i.e. to sample the core collection), the M strategy showed higher performance in sampling proce-dure than a random strategy and gave an optimal size of 51 individuals (figure 4c). Finally, core collections were sampled using both molecular and morphological data. To define the final core collection, accessions were classi-fied by the number of times they were sampled in the fif-teen replicates and the most frequently sampled accessions were chosen.
Four nested core collections composed of 8, 24, 32 and 64
S. l. cerasiforme accessions were sampled (see Additional
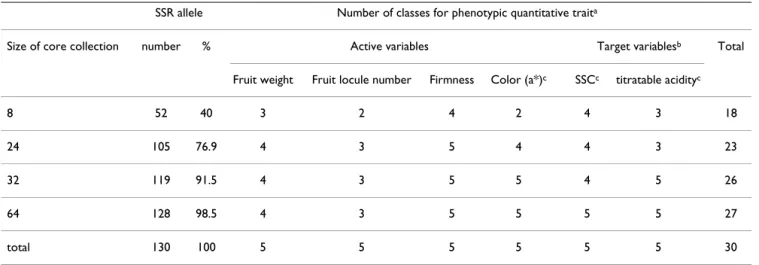
file 2: Cerasiforme and mixed core collections). Fourty to 98% of SSR alleles were captured when accession's number increased from 8 to 64 (table 7). The number of phenotypic classes captured, increased from 18 (60% of the classes from the S. l. cerasiforme sample) to 27 (90% of the classes from the S. l. cerasiforme sample) when acces-sion's number increased from 8 to 64. The 64 accession sample did not show any genetic structure when it was analyzed with the model-based method.
For fruit weight (FW), soluble solid content (SSC) and titratable acidity (TA), the core collection of 64 accessions best represented the phenotypic variability of the global sample even though extreme phenotypes were not repre-sented (Figure 5). The sample consisting of 32 accessions seemed to be the best compromise because of its small number of accessions and its representativeness.
To complete representativeness of these core collections, ten accessions from S. lycopersicum, two accessions from S.
pimpinellifolium and four wild related accessions (S. ches-maniae, S. habrochaites, S. pennellii and S. chmielewskii)
were added to each of the core collections to constitute mixed interspecific core collections. The core collection of 64 accessions was also completed with seven other acces-sions from S. lycopersicum and eight accesacces-sions from S.
pimpinellifolium also sampled separately using 20 SSR
alle-les and 12 morphological traits with the M strategy.
Discussion
Previous studies on the genetic structure of tomato collec-tions focused on cultivated accessions [29,30] or on the relationship between cultivated and wild relatives [26,27] but did not use a broad sample of wild and cultivated tomatoes with S. l. cerasiforme as the main sample. SSR markers have already been shown to be useful for genetic analysis in studies focusing on inferring interspecific rela-tionships or confirming SSR reliability for genetic map-ping [26,28,31-34].
Differences were observed among SSR markers. For exam-ple, a higher number of alleles was identified in the two-base motif markers compared to other three-two-base or com-plex motif markers (P-value = 0.039). A significant differ-ence was observed between the number of alleles with AT-rich motifs and non AT-AT-rich motif markers (P-value = 0.032). Two base AT-rich motif markers also displayed higher expected heterozygosity. This kind of SSR marker might be useful for inferring fine relationships between close accessions. Because of the higher mutation rate in
Table 4: Species classification among clusters described by Structure2.0 based on maximal individual-membership for each cluster.
species Kopt = 2 Kopt = 4
Pop1 Pop2 popA PopB PopC popD
S. lycopersicum 1 112 1 0 23 89
S. lycopersicum var. cerasiforme 20 124 13 10 78 43
S. pimpinellifolium 58 3 21 35 3 2
Number of pairs of loci in LD (# of comparisons)a 158(189) 87(189) 62(152) 143(189) 74(135) 58(189)
a Pairs of markers were considered in significant LD using the threshold p-value < 0.001.
Table 5: Subgroup pairwise FST for Kopt = 4
popA popB popC
popA 0.00000
popB 0.23358 0.00000
popC 0.57111 0.39977 0.00000
popD 0.64958 0.48797 0.21444
Individuals were clustered corresponding to their maximal membership. All comparisons were significant (p < 0.001)
the AT-rich motif markers, some misevaluation might occur because of homoplasy (i.e. alleles identical in terms of state but not by descent) for distant individuals [35]. SSR markers with lower mutation rates with three-base or complex motifs are more reliable markers for inferring interspecific relationships.
SSR markers had between two and 26 different alleles in the total collection (including eighteen wild green-fruited accessions, one S. galapagense and one S. cheesmaniae accessions) and the allele number decreased between one and five alleles when looking in the red-fruited tomato
sample and only for allelic frequency higher than 5%. The pattern of genetic diversity inferred from SSR alleles also showed an important decrease in diversity (i.e. expected heterozygosity) when comparing S. pimpinellifolium and S.
lycopersicum accessions. Furthermore, the observed
hetero-zygosity is lower than expected for all species due to the reproductive regime of red-fruited accessions, but also to the way genetic resources were maintained. The red-fruited accessions are mainly autogamous (except a few highly allogamous S. pimpinellifolium accessions) and the green fruited accessions are mainly self-incompatible (except S. chmielewskii and S. neorickii which are self-com-patible) [27]. The decrease of allele number and diversity in red fruited accessions is probably due to the restriction of allogamy. The drop in diversity between the wild and domesticated species has been previously described [14,16,17] and was explained by successive bottlenecks starting from domestication and continuing with modern breeding of S. lycopersicum. This species presents a high selfing rate which hampers restoration of genetic diversity lost during domestication. S. pimpinellifolium showed higher diversity because of its wild status (weak anthropic restriction in the effective population size compared to domesticated species) and because it benefited from inter-crossing. In fact, partial allogamous populations of S.
pimpinellifolium were described in Northwestern Peru.
While they migrated away from that territory, selection has favored self pollination [36]. The higher rate of observed heterozygosity shown by S. pimpinnellifolium is thus a residue of intercrossing from allogamous acces-sions.
Table 6: Individual clustering, allelic diversity and proportion of loci in linkage disequilibrium in the four clusters inferred using Structure2.0 (n = 318)
Group 1: 'wild' Group 2: 'domesticated' 'wild/domesticated' Admixed Number of individuals in each cluster Subgroup A Subgroup B AB Admixed Subgroup C Subgroup D CD Admixed S. lycopersicuma 1 0 0 16 81 12 3 cerasiformea 3 6 1 59 19 22 34 S. pimpinellifoliuma 13 30 7 1 0 0 10 total 17 36 8 76 100 34 47 NA b 2.9 6.2 2.8 4.15 3.4 3.3 4.7 HE c 0.3275 0.5960 0.3852 0.2816 0.2245 0.2772 0.4595 LD (number of comparison) 23/135 135/190 16/90 36/119 25/152 80/119 83/152
a Individuals were classified in a cluster if their membership for this cluster was higher than 70%. a number of individual in each cluster. b allele
number. c Expected heterozygosity
Classification of individuals using Structure2.0 according to the previous classification into species
Figure 2
Classification of individuals using Structure2.0 accord-ing to the previous classification into species. The dis-tribution of the individuals to different clusters by the model-based method is indicated by the color code in the legend box. S. lycopersicum S. lycopersicum var. cerasiforme S. pimpinellifolium popD popC popA popB
All red-fruited plants used are progenies from com-patible accessions where seeds are produced through self-pollination. Because of the inbred nature of most acces-sions, only one plant was used for genotyping. The amount of diversity in this sample is thus underestimated. There is a bias when analyzing observed heterozygosity on artificially self-pollinated accessions but the residue of intercrossing observed testifies to ancestral intercrossing. The estimation of observed heterozygosity should be done on the initial population (from prospecting) to assess the intercrossing rate of these populations. How-ever, the homozygosity of accessions will help in dissect-ing the genetic bases of agronomical traits usdissect-ing diversity studies.
S. l. cerasiforme showed an intermediate amount of genetic
diversity between S. lycopersicum and S. pimpinellifolium. This particular position has already been described using allozymic variation [17] and both patterns of genetic var-iation close to S. pimpinellifolium and S. lycopersicum were encompassed. Cherry type tomatoes, found in coastal Peru or Ecuador and which were described as feral, wild, or used as cultivated landraces, may have played an important role in the evolution of domesticated tomato [37]. This variety characterized by morphological traits like fruit size and seed weight spans a genetic continuum between 'wild' and 'domesticated' forms of the crop. Cur-rent results suggest that this group of S. l. cerasiforme evolved through hybridization between S. lycopersicum
Principal Coordinate Analysis of the Eulycopersicon sample with Structure2.0 clustering information
Figure 3
Principal Coordinate Analysis of the Eulycopersicon sample with Structure2.0 clustering information. The 'red-fruited' sample did not contain S. cheesmaniae accessions. The subdivision of the collection assuming Kopt = 2 separates group 1 (triangle) and group 2, (square) accessions. When assuming Kopt = 4, large fruited accessions: subgroup D (black square) and small-size fruit accessions: subgroup C (white square) are divided. For wild accessions, subgroup A (white triangle) and sub-group D (black triangle) were divided. 'Wild'/'domesticated' admixed accessions are represented by grey diamonds. Intra-spe-cific admixed accessions are not identified. Inertia values are 22.09% and 4.84% for factorial coordinates axes 1 and 2, respectively. -0 ,5 -0 ,4 -0 ,3 -0 ,2 -0 ,1 0 0 ,1 0 ,2 0 ,3 -0 ,3 -0 ,2 -0 ,1 0 0 ,1 0 ,2 0 ,3 0 ,4 0 ,5 0 ,6 0 ,7
and S. pimpinellifolium. The wild and feral parts of S. l.
cerasiforme accessions, which have been described as
highly invasive, adapted rapidly thanks to the increase in genetic variance, new gene interactions, masking or unloading of deleterious recessive alleles, or the transfer of favourable genes [38].
Genetic structure was highlighted by the model-based method developed by Pritchard et al., (2000) for human genetics. This method performed better than clustering methods based on pairwise genetic distance because only a modest number of loci was used [6]. The higher level of genetic structure allowed most of the S. lycopersicum and a part of S. l. cerasiforme accessions to be assigned to a
'domesticated' group and most of the S. pimpinellifolium to the 'wild' group. The other part of the cherry tomato sam-ple was classified in an admixture position, which is con-sistent with the distance-based method. The subdivision of the 'domesticated' group in large and small fruit size accessions is consistent with the results of van Berloo et al. (2008) with AFLP markers. These authors found higher differences between cherry versus beef and round toma-toes than between round and beef tomatoma-toes themselves. Homozygosity creates departure from Hardy-Weinberg equilibrium which is one of the hypotheses to apply the model-based method. This limitation was overcome using haploid genotypes. Simulations showed that domi-nant markers can give results as accurate as codomidomi-nant
Comparison of efficiency of random and maximization (M) sampling strategy in S. l. cerasiforme sample (n = 143 accessions)
Figure 4
Comparison of efficiency of random and maximization (M) sampling strategy in S. l. cerasiforme sample (n = 143 accessions). Score, which represents allelic richness, is plotted against size of core collection. The efficiency of the M strategy is represented by a straight line and the random strategy is represented by a dashed line. A. Core collections were sampled with alleles from 20 SSR loci and were cross validated by the same alleles. B. Core collections were sampled with alle-les from 20 SSR loci and were cross validated by allealle-les from twelve phenotypic data split in 5 classes. C. Core collections were sampled with alleles from 20 SSR markers and twelve phenotypic data and were cross validated by the same alleles.
0 50 100 150 200 250 300 350 0 25 50 75 100 125 150 0 50 100 150 200 250 300 0 25 50 75 100 125 150 0 10 20 30 40 50 60 0 25 50 75 100 125 150
A
B
Scor
e
Scor
e
Core size
Core size
Scor
e
Core size
C
markers [39]. We can thus validate our clustering though genotypes were coded in haploid setting. However, cau-tion must be exerted when interpreting biological signifi-cance of the clustering because results are sensitive to the type of genetic marker used, the number of loci scored, the number of population sampled and the number of indi-vidual typed in each sample.
No relationship between the geographical origin and genetic structure was found within the wild group. Geo-graphic distributions of genetic variability were high-lighted for S. pimpinellifolium across coastal Peru and Ecuador, using isozyme markers [36]. Regional distribu-tion of isozyme allelic variants and morphological traits for S. l. cerasiforme was also described [17,18]. This could be explained by differences in property for markers used. Allozyme markers and morphological traits may be under selective constraint in natural populations in contrast with SSR markers which are usually described following the neutrality hypothesis. Moreover, the results cited above, were obtained for offspring directly collected from natural populations. We employed a different approach using highly inbred plants: diversity patterns were com-pared among clusters and not among natural popula-tions. The SSR markers presented in this study should be genotyped for natural populations of S. pimpinellifolium or
S. l. cerasiforme to elucidate the correlation of geographical
and genetic structures.
The lower amount of diversity and the highest number of alleles in LD in the subgroup A could be explained by reproductive isolation with a high frequency of short-style flowers in the original population (data not shown). This trait is characteristic of strictly autogamous tomato acces-sions [16,40]. This morphological change, that favors
self-ing over outcrossself-ing, could also explain the genetic structure [41]. The higher genetic diversity of subgroup C in the 'domesticated' groups could be due to a more ancient and less drastic genetic bottleneck caused by domestication. The drop in genetic diversity in subgroup D is likely due to modern selection which focused on yield and fruit size. The interspecific admixed cluster pre-sented high value of diversity index which is inconsistent with highly autogamous and domesticated forms but con-firmed the hypothesis of frequent recombination between cultivated S. lycopersicum and wild S. pimpinellifolium. These results suggest a two-step selection for fruit size dur-ing domestication of tomato from S. pimpinellifolium to S.
lycopersicum. A first step may have allowed selection of
cherry type with moderate fruit size probably with fixa-tion of autogamy. The human migrafixa-tion may have resulted in transfer of cultivated tomato from the Andes to Central America with selection for larger fruit size. In Mex-ico, tomato reached a fairly advanced stage of domestica-tion before being taken to the Old World by conquistador [15,42]. The role of the 'admixed' part of S. l. cerasiforme, in tomato domestication can't be established because hybrid pattern could be due to ancient or recent outcross-ing events.
The admixed S. l. cerasiforme cluster is of particular interest for mapping complex traits. This subsample could be used in an admixture mapping strategy that falls between linkage analysis and association mapping, and is a good approach for initial genome scan [43]. The extent of difference in allele frequency between the ancestral populations is cru-cial in detecting strong associations between phenotypes and molecular polymorphisms. This difference in allele fre-quency was obvious in 'wild' and 'domesticated' tomato groups as it represented the main genetic structure level
Table 7: Phenotypic and molecular representativeness of the four cerasiforme core collections.
SSR allele Number of classes for phenotypic quantitative traita
Size of core collection number % Active variables Target variablesb Total
Fruit weight Fruit locule number Firmness Color (a*)c SSCc titratable acidityc
8 52 40 3 2 4 2 4 3 18
24 105 76.9 4 3 5 4 4 3 23
32 119 91.5 4 3 5 5 4 5 26
64 128 98.5 4 3 5 5 5 5 27
total 130 100 5 5 5 5 5 5 30
a Each quantitative variable was split into 5 classes of equal dimension (see Materials and Methods) when looking for the whole cerasiforme sample
and number of classes. b Soluble Solid Content (SSC) and titratable acidity were only used to analyse core collections representativeness and were
highlighted with the model-based method. In humans, admixture mapping has already been performed to map two loci responsible for hypertension [44]. This method will be assessed in future studies for identifying new QTLs or candidate genes linked to fruit quality traits.
The number of pairwise markers at linkage disequilibrium (LD) decreased in the different groups compared to the
total red-fruited accessions. Strong LD between distant or independent markers arises as a consequence of genetic linkage, of the rate of recombination, drift or non-random mating, and as a consequence of population structure. Information on genetic structure of the collection and the membership information for all individuals will be useful in future association mapping to avoid spurious associa-tions due to strong LD over the genome [6]. However, more markers are needed to efficiently tag the genome and better unravel the genetic structure of the cul-tivated S. lycopersicum and S. l. cerasiforme. Furthermore, more markers will also be of great interest for estimating individual's kinships. New statistical methods for associa-tion studies use both genetic structure informaassocia-tion and kinship estimation [45].
This study provided a set of nested core collections for S. l.
cerasiforme accessions which was completed by selected
accessions of S. lycopersicum, S. pimpinellifolium and wild rel-atives representing parents of different mapping popula-tions. We focused on S. l. cerasiforme because of (i) its close relationship with S. lycopersicum, (ii) its genetic diversity which is higher than that of S. lycopersicum and (iii) its high range of variation in fruit quality traits. Because of differ-ences in genetic and morphological diversity patterns in 'wild' versus 'domesticated' forms of the tomato continuum, core collections were sampled using both phenotypic and molecular diversity. For sampling core collections, the gain when scoring with the Maximization strategy was higher than with the Random strategy. This is not surprising given the high level of selfing in S. l. cerasiforme and the pattern of genetic structure uncovered in our sample, both factors that favor the marker assisted sampling strategies over pure random strategies [10,11]. Moreover 20 SSR markers were not sufficient to differentiate all accessions based on their genotype. Markers with higher mutation rates will be more accurate in differentiating individuals based on fingerprint-ing but will decrease the accuracy of samplfingerprint-ing core collec-tions with the M strategy.
Moreover, the M strategy sampled molecular diversity but also morphological diversity even for traits that were not used as markers for sampling the collection.
The four core collections proposed will have different goals. The 24 mixed core collection (including cultivated and wild mapping population parents) will be useful for detecting SNPs by sequencing. SNP markers will then be genotyped on the whole tomato collection for association studies or on mapping populations for QTL localization. Sampling this collection was a preliminary step for future studies on exploring the natural diversity of tomato that will unfold as the tomato genome sequence becomes available [13]. For example, Simon et al. [46] crossed
Ara-bidopsis thaliana reference genotypes (i.e. whole genome
Core collection representativeness for fruit weight, Soluble Solid Content and Titratable Acidity
Figure 5
Core collection representativeness for fruit weight, Soluble Solid Content and Titratable Acidity. Classes are those used for core collections (cc) design.
0 10 20 30 40 50 60 1 2 3 4 5 0 10 20 30 40 50 60 70 1 2 3 4 5 0 10 20 30 40 50 60 1 2 3 4 5 N u mb er of i n di v id u a ls N u mb er of i n di v id u a ls N u mb er of i n di v id u a ls
Class for fruit weight
Class for SSC Class for AT total cc64 cc32 cc24 cc8
A
B
C
sequenced genotypes) with several accessions from a pre-viously defined core collection [47]. The authors built 15 Recombinant Inbred Line family and this new RIL set offered improved accuracy for QTL localization than pre-vious RIL families.
The 64 S. l. cerasiforme core collection will be useful for direct association studies. This core collection maximizes the power of associations between phenotypes and allele frequencies. The core collection was test with the model based methods and showed no genetic structure. A broad geographic origin (available for wild accessions) and large phenotypic variation for fruit quality traits were repre-sented. The 96 mixed core collection will help in under-standing domestication of tomato from S.
pimpinellifolium. Identified alleles of interest in admixed S. l. cerasiforme could be assigned to S. pimpinellifolium or to S. lycopersicum to identify their wild or cultivated origins.
Core collections will be used to detect genes associated with domestication i.e. under differential selective con-straints in domesticated and wild clusters, and to test their potential for breeding [48]. The 8 and the 32 S. l.
cerasi-forme core collection are interesting for rapid sequencing
and identifying SNPs and for evolutionary genomics stud-ies, respectively. These core collections will be of interest for new high-throughput analysis of fruit quality integrat-ing 'omic' information such as metabolomic, proteomic or transcriptomic analysis.
Conclusion
This study highlighted the unknown genetic structure of our wild and cultivated germplasm, enhancing the under-standing of the history of the tomato complex. It clarified the position of S. l. cerasiforme in the evolution of the cul-tivated tomato. Part of this sub-species is genetically close to the cultivated S. lycopersicum group and the other part is in admixture between cultivated and wild related groups. This admixed cluster is of high interest for increasing res-olution of association genetics. We created nested core collections implemented with accessions from S.
lycopersi-cum and S. pimpinellifolium that maximize genetic
diver-sity. These core collections are available for the tomato community and can be used as standardized panels for identifying novel interesting genes or polymorphism. Future studies will focus on the characterization of S. l.
cerasiforme to understand the domestication process in
more detail and to prospect for new interesting alleles.
Methods
Plant Material
The French collection of wild and cultivated tomato main-tained in Institut National de Recherche Agronomique in Avignon (South of France) was used for genotyping. In this collection, most tomato accessions are inbred lines maintained by selfing and characterized for vegetative and
reproductive traits. The whole collection consists of nearly 2000 accessions containing inbred cultivars, landraces, and representatives of wild related species. It collates accessions from French researchers' prospecting, from breeders' collections, from the Tomato Genetics Resource Center (Davis, California USA), the Centre for Genetic Resources (Wageningen, Netherlands), the North Central Regional Plant Introduction Station (USA) and from the N.I. Vavilov Research Institute of Plant Industry (St Peters-burg, Russia). We used a subset of 360 accessions (see Additional file 3: Individuals information and SSR geno-types) with a majority of S. lycopersicum (130 accessions),
S. l. cerasiforme (144 accessions) and S. pimpinellifolium
(66 accessions). For the red-fruited accessions, classifica-tion in different species was based essentially on fruit size [49]. We added one S. cheesmaniae and one S. galapagense (formerly L. cheesmanii f. minor) which are part of red-fruited tomatoes but not included in the studied sample for domestication, because they are assumed to have evolved separately and to be endemic in the Galapagos Islands. Eighteen representatives of wild and green-fruited related were represented by S. neorickii (1), S. chmielewskii (2), S. peruvianum (2), S. chilense (2), S. pennellii (2) and
S. habrochaites (2). All red-fruited accessions underwent
from one to three cycles of self-pollination. Because of the inbred nature of these accessions, only one plant per accession was used for genotyping. All accessions are available on request from the corresponding author.
S. l. cerasiforme accessions (144 accessions) with 39
acces-sions of S. lycopersicum and 19 accesacces-sions of S.
pimpinelli-folium were grown in Avignon (South of France) and were
phenotyped for growth habit (determinate: sp or indeter-minate: sp+), flower stigma insertion (+) or exertion (-),
petal length, petal number, green shoulder (presence/ absence), stem hairiness (presence/absence), fruit locule number, fruit weight (FW), color in L*a*b* color space: one measure for lightness (L), one measure for the posi-tion between red and green (a) and one measure for the position between yellow and blue (b) with a Konica Minolta CR-300 chromameter, firmness with a Durofel durometer http://www.setop.fr, soluble solid content (SSC) and titratable acidity (TA). Phenotypic data were only used for core collection sampling. Quantitative data were split into 5 classes of equi-spaced breaks with class size calculated as [max(X)-min(X)]/5 with X the quantita-tive variable.
DNA extraction and Microsatellite genotyping
DNA was isolated from 100 mg frozen leaves using to the DNeasy Plant Mini Kit (Qiagen, Valencia, California, USA). Twenty microsatellite loci were used for genotyping (Table 1). These SSR markers were selected from Sol Genomics Network webpage at http://www.sgn.cor-nell.edu/.
Amplification reactions were performed according to Ronfort et al. [25]. Samples were prepared by adding 3 μL of diluted PCR product to 6.875 μL formamide and 0.125 μL Gensize 400 HD Rox Size Standard (Applied Biosys-tems, Foster City, USA). Amplified products were detected on an ABI 3710 × l (Applied Biosystems, Foster City, USA) capillary sequencer. Analyses were performed using the GeneMapper 3.7 sofware (Applied Biosystems, Foster City, USA).
Diversity analysis
For each microsatellite locus, the number of alleles (NA),
allelic frequency, the expected (He) and observed (Ho) heterozygosities were estimated considering both the whole collection and the red-fruited accessions using Genetix 4.05.2 software [50]. Heterozygosity was also compared between subsets at the species level.
Inference of population structure
To infer the population structure of the tomato collection, we used a model-based clustering algorithm implemented in the computer program Structure version 2.0 (Pritchard, Stephens, and Donnelly, 2000). This algorithm uses a multilocus genotype to identify a predetermined number (K) of clusters that have distinct allele frequencies and assigns portions of individual genomes to these clusters. It proceeds by assuming that observations are randomly drawn from a parametric model and inference for the parameters allows estimation of ancestry probability from each putative cluster, for all individuals. Only S.
lycopersi-cum, S. l. cerasiforme and S. pimpinellifolium accessions
were included in this analysis. Since tomato accessions used are highly homozygous (autogamy plus self-pollina-tion of accessions), we used a haploid setting [25,51]. Given the hybrid hypothesis for the S. l. cerasiforme variety we used the admixture model assuming correlation among allele frequencies. Ten runs were taken into account for each K value (K is the number of clusters to be inferred), for K ranging from 1 to 15. For each run, we used a burn-period of 500,000 Markov Chain Monte Carlo iterations and then 250,000 iterations for estimat-ing the parameters. Pr(X|K) (i.e. the posterior probability of the data (X) given K) and the associated standard devi-ation was computed for each simuldevi-ation and Kopt was
inferred from the formula established by Evanno et al. (2005); Kopt being the mode of the first peak of ΔK = |L"(K)|/s[Pr(x|k)], with |L"(K)| the absolute value of the second order rate of change of Pr(X|K) with respect to K; and s[Pr(x|k)] the variance of the posterior probability of the data given K. To avoid genetic classification at the spe-cies level, Structure2.0 runs were also performed with the same parameters on sub-groups defined by the software but for K ranging from one to ten. For each Kopt, individ-uals were assigned into a cluster according to their propor-tion of membership into this group. Graphical representation of the individual assignation into groups
was performed with distruct1.1 software [52]. Analysis of locus by locus MOlecular VAriance (AMOVA) was per-formed (1000 permutations) and FST, the correlation of alleles within subpopulatons, was calculated (1000 per-mutations) with Arlequin3.11 [53]. Pairwise comparisons of linkage disequilibrium (LD) among loci were com-puted with the dedicated procedure of the TASSEL soft-ware, using 1,000 permutations.
Graphical diversity analysis
Genetic uniqueness of each accession was determined with pairwise comparison of multilocus DNA profiles. When two or more accessions had the same profile, only one was taken into account in subsequent analyses. Dis-similarity matrices were built according to the simple matching coefficient [54,55]:
where L is the locus number, is the ploidy level and m the number of common alleles between individuals i and j. Bootstraping was performed using 500 replicates for each dissimilarity matrix. Principal coordinate analysis (PCoA) offered graphical representation of genetic distance between accessions and was performed using Darwin 5.0 software [56].
Core collection sampling
For sampling core collections, we used the Maximization (M) algorithm implemented in MSTRAT software version 4.1 [57], and compared the result to a random strategy. The minimum number of accessions in the core collection to capture all alleles present in the whole sample was eval-uated by sampling simulations of this collection. The core collections were built using all SSR data and phenotypic data from 12 morphological traits: growth habit, flower stigma insertion or exertion, petal length, petal number, green shoulder, hairiness, fruit locule number, fruit weight, color in L*a*b* color space and firmness. Soluble Solid Content and Titratable Acidity were used only to val-idate capture of phenotypic diversity. For evaluation of core collection's minimal size and for individual sampling of the collections, 15 replicates of 30 iterations for each replicate were performed.
Authors' contributions
NR participated in the conception of the study, analyzed the data and wrote the manuscript. SS participated in the design of the study and was responsible, with NR, for obtaining the molecular data. SM critically revised the manuscript for intellectual content. MC participated in the conception and the coordination of the study and helped to draft the manuscript. All authors read and approved the final manuscript.
d L ml ij l L = − =
∑
1 1 1Additional material
Acknowledgements
We thank anonymous reviewers for their valuable comments on the man-uscript. We are grateful to Tomato Genetics Ressource Center (Davis, California USA), to the Centre for Genetic Resources (Wageningen, Neth-erlands), to the North Central Regional Plant Introduction Station (Geneva, New York USA) and to the N.I. Vavilov Research Institute of Plant Industry (St Petersburg, Russia) for providing tomato accessions. We thank Rebecca Stevens and Cindy Morris for English revision of the manuscript. The authors thank Hélène Burck for characterizing and maintaining the INRA tomato Genetic Resources collection. We thank Karine Leyre for plant DNA extraction and Microsatellite tests. We would also like to thank Isa-belle Hochu for her help in high throughput SSR genotyping of the tomato collection. We are grateful to Esther Pelpoir for her help with growing and phenotyping cherry tomato accessions.
This work was supported by French INRA AIP Sequençage and Nicolas RANC was supported by EUSOL European project PL016214-2.
References
1. Doebley J, Stec A, Hubbard L: The evolution of apical dominance in maize. Nature 1997, 386:485-488.
2. Frary A, Nesbitt TC, Frary A, Grandillo S, Knaap Evd, Cong B, Liu J, Meller J, Elber R, Alpert KB, Tanksley SD: fw2.2: A Quantitative Trait Locus Key to the Evolution of Tomato Fruit Size.
Sci-ence 2000, 289:85-88.
3. Tanksley SD: The Genetic, Developmental, and Molecular Bases of Fruit Size and Shape Variation in Tomato. Plant Cell 2004, 16 Suppl:S181-S189.
4. Buckler I, Edward S, Thornsberry JM: Plant molecular diversity and applications to genomics. Curr Opin Plant Biol 2002, 5:107-111.
5. Weigel D, Nordborg M: Natural Variation in Arabidopsis. How Do We Find the Causal Genes? Plant Physiol 2005, 138:567-568. 6. Pritchard JK, Stephens M, Rosenberg NA, Donnelly P: Association Mapping in Structured Populations. Am J Hum Genet 2000, 67:170-181.
7. Freedman ML, Reich D, Penney KL, McDonald GJ, Mignault AA, Pat-terson N, Gabriel SB, Topol EJ, Smoller JW, Pato CN, et al.: Assess-ing the impact of population stratification on genetic association studies. Nat Genet 2004, 36:388-393.
8. Rosenberg NA, Pritchard JK, Weber JL, Cann HM, Kidd KK, Zhivot-ovsky LA, Feldman MW: Genetic Structure of Human Popula-tions. Science 2002, 298:2381-2385.
9. Whitt SR, Buckler ES: Using Natural Allelic Diversity to Evalu-ate Gene Function. Methods Mol Biol 2003, 236:123-140. 10. Schoen D, Brown A: Conservation of Allelic Richness in Wild
Crop Relatives is Aided by Assessment of Genetic Markers.
PNAS 1993, 90:10623-10627.
11. Bataillon TM, David JL, Schoen DJ: Neutral Genetic Markers and Conservation Genetics: Simulated Germplasm Collections.
Genetics 1996, 144:409-417.
12. Labate JA, Grandillo S, Fulton TM, Munos S, Caicedo A, Peralta IE, Ji Y, Chetelat R: Tomato. In Genome mapping and molecular breeding in
plants Volume 5. Edited by: Kole C. NY: Springer Publishing;
2007:1-125.
13. Mueller LA, Tanksley SD, Giovannoni JJ, van Eck J, Stack S, Choi D, Kim BD, Chen M, Cheng Z, Li C, et al.: The Tomato Sequencing Project, the first cornerstone of the International Solanaceae Project (SOL). Comp Funct Genom 2005, 6(3):153-158.
14. Miller JC, Tanksley SD: RFLP analysis of phylogenetic relation-ships and genetic variation in the genus Lycopersicon. Theor
Appl Genet 1990, 80:437-448.
15. Bai Y, Lindhout P: Domestication and Breeding of Tomatoes: What have We Gained and What Can We Gain in the Future? Ann Bot 2007, 100:1085-1094.
16. Rick CM: Tomato Lycopersicon esculentum (Solanaceae). In
Evolution of Crop Plants Edited by: Simmonds NW. Longman;
1976:268-273.
17. Rick CM, Fobes F: Allozyme Variation in the Cultivated Tomato and Closely Related Species. Bull Torr Bot Club 1975, 102:376-384.
18. Rick CM, Holle M: Andean Lycopersicum esculentum var.
ceras-iforme: Genetic Varaition and Its Evolutionary Significance.
Econ Botany 1990, 44:69-78.
19. Nesbitt TC, Tanksley SD: Comparative Sequencing in the Genus Lycopersicon: Implications for the Evolution of Fruit Size in the Domestication of Cultivated Tomatoes. Genetics 2002, 162:365-379.
20. Matsuoka Y, Mitchell SE, Kresovich S, Goodman M, Doebley J: Mic-rosatellites in Zea – variability, patterns of mutations, and use for evolutionary studies. Theor Appl Genet 2002, 104:436-450.
21. Genlou S, Björn S: Microsatellite variability and heterozygote deficiency in the arctic-alpine Alaskan wheatgrass (Elymus
alaskanus) complex. Genome 2003, 46:729-737.
22. Djè Y, Heuertz M, Lefèbvre C, Vekemans X: Assessment of genetic diversity within and among germplasm accessions in cultivated sorghum using microsatellite markers. Theor Appl
Genet 2000, 100:918-925.
23. Green JM, Barker JHA, Marshall EJP, Froud-Williams RJ, Peters NCB, Arnold GM, Dawson K, Karp A: Microsatellite analysis of the inbreeding grass weed Barren Brome (Anisantha sterilis) reveals genetic diversity at the within- and between-farm scales. Mol Ecol 2001, 10:1035-1045.
24. Menz MA, Klein RR, Unruh NC, Rooney WL, Klein PE, Mullet JE: Genetic Diversity of Public Inbreds of Sorghum Determined by Mapped AFLP and SSR Markers. Crop Sci 2004, 44:1236-1244 [http://crop.scijournals.org/cgi/content/abstract/44/4/ 1236].
25. Ronfort J, Bataillon T, Santoni S, Delalande M, David J, Prosperi J-M: Microsatellite diversity and broad scale geographic structure in a model legume: building a set of nested core collection for studying naturally occurring variation in Medicago trun-catula. BMC Plant Biol 2006, 6:28.
26. Alvarez AE, Wiel CCMvd, Smulders MJM, Vosman B: Use of micro-satellites to evaluate genetic diversity and species relation-ships in the genus Lycopersicon. Theor Appl Genet 2001, 103:1283-1292.
27. Spooner DM, Peralta IE, Knapp S: Comparison of AFLPs with other markers for phylogenetic inference in wild tomatoes
Additional file 1
Determination of Kopt for each species. This file provides the graphical
determination (Evanno, 2005) of Kopt for each species.
Click here for file
[http://www.biomedcentral.com/content/supplementary/1471-2229-8-130-S1.ppt]
Additional file 2
Cerasiforme and mixed core collections. This file provides a list of the
different core collections for S. lycopersicum var. cerasiforme imple-mented with S. lycopersicum and S. pimpinellifolium.
Click here for file
[http://www.biomedcentral.com/content/supplementary/1471-2229-8-130-S2.xls]
Additional file 3
Individuals information and SSR genotypes (n = 360). This file
pro-vides a list of all individual genotypic data for 20 SSR markers.
Click here for file
[http://www.biomedcentral.com/content/supplementary/1471-2229-8-130-S3.xls]
[Solanum L. section Lycopersicon (Mill.) Wettst.]. Taxon 2005, 54:43-61 [http://www.ingentaconnect.com/content/iapt/tax/ 2005/00000054/00000001/art00006].
28. Bredemeijer G, Cooke R, Ganal M, Peeters R, Isaac P, Noordijk Y, Rendell S, Jackson J, Röder M, Wendehake K, et al.: Construction and testing of a microsatellite database containing more than 500 tomato varieties. Theor Appl Genet 2002, 105(6lj):1019-1026.
29. van Berloo R, Zhu A, Ursem R, Verbakel H, Gort G, van Eeuwijk F: Diversity and linkage disequilibrium analysis within a selected set of cultivated tomatoes. Theor Appl Genet 2008, 117:89-101.
30. Mazzucato A, Papa R, Bitocchi E, Mosconi P, Nanni L, Negri V, Picarella ME, Siligato F, Soressi GP, Tiranti B, Veronesi F: Genetic diversity, structure and marker-trait associations in a collec-tion of Italian tomato (Solanum lycopersicum L.) landraces.
Theor Appl Genet 2008, 116:657-669.
31. Frary A, Xu Y, Liu J, Mitchell S, Tedeschi E, Tanksley S: Develop-ment of a set of PCR-based anchor markers encompassing the tomato genome and evaluation of their usefulness for genetics and breeding experiments. Theor Appl Genet 2005, 111(2):291-312.
32. Smulders MJM, Bredemeijer G, Rus-Kortekaas W, Arens P, Vosman B: Use of short microsatellites from database sequences to generate polymorphisms among Lycopersicon esculentum cultivars and accessions of other Lycopersicon species. Theor
Appl Genet 1997, 94:264-272.
33. Tam SM, Mhiri C, Vogelaar A, Kerkveld M, Pearce SR, Grandbastien M-Al: Comparative analyses of genetic diversities within tomato and pepper collections detected by retrotranspo-son-based SSAP, AFLP and SSR. Theor Appl Genet 2005, 110(5):819-831.
34. Takezaki N, Nei M: Genetic Distances and Reconstruction of Phylogenetic Trees From Microsatellite DNA. Genetics 1996, 144:389-399.
35. Estoup A, Jarne P, Cornuet J-M: Homoplasy and mutation model at microsatellite loci and their consequences for population genetics analysis. Mol Ecol 2002, 11:1591-1604.
36. Rick CM, Fobes JF, Holle M: Genetic variation in Lycopersicon
pimpinellifolium: Evidence of evolutionary change in mating
systems. Plant Syst Evol 1977, 127:139-170.
37. Jarvis DI, Hodgkin T: Wild relatives and crop cultivars: detect-ing natural introgression and farmer selection of new genetic combinations in agroecosystems. Mol Ecol 1999, 8:S159-S173. 38. Lee CE: Evolutionary genetics of invasive species. Trends Ecol
Evol 2002, 17:386-391.
39. Evanno G, Regnaut S, Goudet J: Detecting the number of clusters of individuals using the software structure: a simulation study. Mol Ecol 2005, 14:2611-2620.
40. Chen K-Y, Cong B, Wing R, Vrebalov J, Tanksley SD: Changes in Regulation of a Transcription Factor Lead to Autogamy in Cultivated Tomatoes. science 2007, 318:643-645.
41. Gao H, Williamson S, Bustamante CD: An MCMC Approach for Joint Inference of Population Structure and Inbreeding Rates from Multi-Locus Genotype Data. Genetics 2007.
42. Daunay M-C, Laterrot H, Janick J: Iconography and History of Solanaceae: Antiquity to the 17th Century. Hort Rev 2007,
34:1-119.
43. Darvasi A, Shifman S: The beauty of admixture. Nat Genet 2005, 37(2):118-119.
44. Zhu X, Luke A, Cooper RS, Quertermous T, Hanis C, Mosley T, Charles Gu C, Tang H, Rao DC, Risch N, Weder A: Admixture mapping for hypertension loci with genome-scan markers.
Nat Genet 2005, 37:177-181.
45. Yu J, Pressoir G, Briggs WH, Vroh Bi I, Yamasaki M, Doebley JF, McMullen MD, Gaut BS, Nielsen DM, Holland JB, et al.: A unified mixed-model method for association mapping that accounts for multiple levels of relatedness. Nat Genet 2006, 38:203-208. 46. Simon M, Loudet O, Durand S, Berard A, Brunel D, Sennesal F-X,
Durand-Tardif M, Pelletier G, Camilleri C: Quantitative Trait Loci Mapping in Five New Large Recombinant Inbred Line Popu-lations of Arabidopsis thaliana Genotyped With Consensus Single-Nucleotide Polymorphism Markers. Genetics 2008, 178:2253-2264.
47. McKhann HI, Camilleri C, Berard A, Bataillon T, David JL, Reboud X, Le Corre V, Caloustian C, Gut IG, Brunel D: Nested core
collec-tions maximizing genetic diversity in Arabidopsis thaliana.
Plant J 2004, 38:193-202.
48. Le Cunff L, Fournier-Level A, Laucou V, Vezzulli S, Lacombe T, Adam-Blondon A-F, Boursiquot J-M, This P: Construction of nested genetic core collections to optimize the exploitation of nat-ural diversity in Vitis vinifera L. subsp. sativa. BMC Plant Biol 2008, 8:31.
49. Rick CM, Latterot H, Philouze J: A revised key for the
Lycopersi-cum and related Solanum species. Tom Genet Coop Rep 1990,
40:31.
50. Belkir K, Borsa P, Chikhi L: GENETIX 4.05.02, logiciel sous Win-dowsTM pour la génétique des populations. Laboratoire
Génome, Populations, Interactions CNRS UMR 5000, Montpellier 2004.
51. Nordborg M, Hu TT, Ishino Y, Jhaveri J, Toomajian C, Zheng H, Bakker E, Calabrese P, Gladstone J, Goyal R, et al.: The Pattern of Polymorphism in Arabidopsis thaliana. PLoS Biol 2005, 3:e196. 52. Rosenberg NA: Distruct: a program for the graphical display of
population structure. 2007.
53. Excoffier L, Schneider S: Arlequin ver. 3.0: An integrated soft-ware package for population genetics data analysis. Evol
Bio-info Online 2005, 1:47-50.
54. Sneath PHA, Sokal RR: Numerical Taxonomy. The principles and practice
of numerical classification San Francisco: W.H. Freeman an Co; 1973.
55. Perrier X, Flori A, Bonnot F: Data analysis methods. In Genetic
diversity of cultivated tropical plants Edited by: Hamon P, Seguin M,
Per-rier X, Glaszmann JC. Montpellier: Enfield, Science Publishers; 2003:43-76.
56. Perrier X, Jacquemoud-Collet JP: DARwin software. 2006. 57. Gouesnard B, Bataillon TM, Decoux G, Rozale C, Schoen DJ, David
JL: MSTRAT: An Algorithm for Building Germ Plasm Core Collections by Maximizing Allelic or Phenotypic Richness. J