HAL Id: hal-01555405
https://hal.archives-ouvertes.fr/hal-01555405
Submitted on 4 Jul 2017
HAL is a multi-disciplinary open access
archive for the deposit and dissemination of sci-entific research documents, whether they are pub-lished or not. The documents may come from teaching and research institutions in France or abroad, or from public or private research centers.
L’archive ouverte pluridisciplinaire HAL, est destinée au dépôt et à la diffusion de documents scientifiques de niveau recherche, publiés ou non, émanant des établissements d’enseignement et de recherche français ou étrangers, des laboratoires publics ou privés.
conservation areas and early signs of population collapse
be detected in neotropical forests?
B. de Thoisy, I. Fayad, L. Clement, S. Barrioz, E. Poirier, V. Gond
To cite this version:
B. de Thoisy, I. Fayad, L. Clement, S. Barrioz, E. Poirier, et al.. Predators, prey and habitat structure: can key conservation areas and early signs of population collapse be detected in neotropical forests?. PLoS ONE, Public Library of Science, 2016, 11 (11), pp.e0165362. �10.1371/journal.pone.0165362�. �hal-01555405�
Predators, Prey and Habitat Structure: Can
Key Conservation Areas and Early Signs of
Population Collapse Be Detected in
Neotropical Forests?
Benoit de Thoisy1*, Ibrahim Fayad2, Luc Cle´ment1, Se´bastien Barrioz1, Eddy Poirier1, Vale´ry Gond3
1 Kwata NGO, BP 972, Cayenne, French Guiana, 2 IRSTEA, UMR TETIS, Montpellier, France, 3 CIRAD, Forests and Societies unit, Montpellier, France
*benoit@kwata.net
Abstract
Tropical forests with a low human population and absence of large-scale deforestation pro-vide unique opportunities to study successful conservation strategies, which should be based on adequate monitoring tools. This study explored the conservation status of a large predator, the jaguar, considered an indicator of the maintenance of how well ecological pro-cesses are maintained. We implemented an original integrative approach, exploring suc-cessive ecosystem status proxies, from habitats and responses to threats of predators and their prey, to canopy structure and forest biomass. Niche modeling allowed identification of more suitable habitats, significantly related to canopy height and forest biomass. Capture/ recapture methods showed that jaguar density was higher in habitats identified as more suitable by the niche model. Surveys of ungulates, large rodents and birds also showed higher density where jaguars were more abundant. Although jaguar density does not allow early detection of overall vertebrate community collapse, a decrease in the abundance of large terrestrial birds was noted as good first evidence of disturbance. The most promising tool comes from easily acquired LiDAR data and radar images: a decrease in canopy roughness was closely associated with the disturbance of forests and associated decreas-ing vertebrate biomass. This mixed approach, focusdecreas-ing on an apex predator, ecological modeling and remote-sensing information, not only helps detect early population declines in large mammals, but is also useful to discuss the relevance of large predators as indica-tors and the efficiency of conservation measures. It can also be easily extrapolated and adapted in a timely manner, since important open-source data are increasingly available and relevant for large-scale and real-time monitoring of biodiversity.
a11111
OPEN ACCESS
Citation: de Thoisy B, Fayad I, Cle´ment L, Barrioz S, Poirier E, Gond V (2016) Predators, Prey and Habitat Structure: Can Key Conservation Areas and Early Signs of Population Collapse Be Detected in Neotropical Forests? PLoS ONE 11(11): e0165362. doi:10.1371/journal.pone.0165362
Editor: Danilo Russo, Università degli Studi di Napoli Federico II, ITALY
Received: June 5, 2016 Accepted: October 11, 2016 Published: November 9, 2016
Copyright:© 2016 de Thoisy et al. This is an open access article distributed under the terms of the
Creative Commons Attribution License, which permits unrestricted use, distribution, and reproduction in any medium, provided the original author and source are credited.
Data Availability Statement: Data are from the current study and are provided as Supporting Information.
Funding: The camera-trapping surveys were funded by the Wildlife Conservation Society and the SPECIES project, the WWF Network, European Funds (FEDER), FFEM, the DGIS and the French Ministry of Higher Education and Research. Field surveys for prey were funded by Diren Guyane, DEAL Guyane, ONF Guyane, and the Re´serve Naturelle Nationale de la Trinite´.
Introduction
Despite continuous and increasing local efforts and political initiatives, habitats and species continue to decline worldwide, and projections remain pessimistic [1,2]. However, long before spectacular deforestation [3], human pressure may result in "empty forests" [4]. Impacts of defaunation are cryptic and pernicious [5]. Population decreases of species with important eco-logical roles modify ecosystem engineering, seed dispersal and plant recruitment [6–8], as well as community structure [9]. Beyond species loss and their associated functional roles, the loss of ecological interactions may also amplify the consequences of losing ecological services [10].
The pace of global forest habitat loss in South America, most particularly Amazonia, is also on the rise. Amazonian forest ecosystems, like other tropical forests, are also threatened by large-scale defaunation [11]. This forest loss nevertheless remains much lower in the Guiana Shield: Guyana, Suriname, French Guiana and the Brazilian state of Amapá [3,12]. This region is the largest contiguous exposed Precambrian rock in South America, covering more than 2 million km2of northeast Amazonia [13]. This historical absence of large-scale deforestation makes this region the largest repository of tropical forest vegetation on Precambrian terrain in the world [14]. The region is an area of major importance for conservation of several large ter-restrial mammals, including peccaries (Tayassu pecari and Pecari tajacu), Brazilian tapir (Tapirus terrestris) [15], giant and neotropical otters (Pteronura brasiliensis and Lontra
longi-caudis) [16,17], and jaguar (Panthera onca) [18]. Threats to their survival are nevertheless present and growing in the region. However, much more than agriculture issues and fires, as elsewhere in Amazonia, gold mining is the main threat in the region [19–21], followed by increasing human population growth, unregulated hunting and widespread unsustainable ani-mal harvesting [22,23], all of which threaten the future of vertebrate communities [24].
Carnivores are widely recognized indicators of forest species decline, and they focus atten-tion on broad conservaatten-tion approaches. Recently, many species have been studied using the lat-est niche modeling tools to improve knowledge of ecological requirements and conservation opportunities [17,25,26]. Nevertheless, approaches considering the conservation status of both predator and prey species, the relations between their respective status and the prospectives for the future are scarce and difficult to implement. The jaguar (P. onca) is the largest Neotropical felid in the Americas, considered to be "near threatened" [27], with decreasing populations mainly caused by habitat loss and currently occupying less than 50% of their historical range [18]. The major threats to jaguars in Amazonia are habitat loss, habitat fragmentation and hunting of both jaguars and their prey. The jaguar is not only a relevant umbrella species for wide biodiversity conservation, but can be considered a good indicator of healthy trophic cas-cades [5,28,29]. The resources required for relevant assessment of population density [30] may nevertheless be beyond the means of most conservation initiatives. Alternatively, the commu-nity of large vertebrates, which may be important prey species for large felids, is a good surro-gate to determine the human footprint [24], although for many species a relevant assessment of abundance also requires extensive field work [31]. In contrast, recent developments in remote sensing and aerial imaging have provided new approaches to detect habitat disturbance [32–36] and may help identify depleted and degraded areas and/or areas facing a high risk of population collapse with changes on target species communities and ecosystem functions [37].
Therefore, this study explored how predator and prey species as well as habitat structure are interlinked, and more specifically:
1. Jaguar distribution was assessed within the so-called highest-priority French Guiana and Amapá Jaguar Conservation Unit (JCU) [18] where ecological processes are assumed to have remained stable. We used species distribution modeling (SDM) to identify more
Competing Interests: The authors have declared that no competing interests exist.
favorable, appropriate environmental conditions for jaguars at the country scale, expected to be associated with a higher likelihood of long-term persistence [25].
2. Classical camera-trap survey procedures and capture-recapture models [38] were used to assess jaguar density on four sites and to test how predicted environmental conditions are related to field-measured densities.
3. Proxies of jaguar and prey status and key habitats are suggested.
4. Broader discussion is opened on the relevance of felids as proxy for habitat and fauna com-munity status, and how more rapidly acquired field information, associated with open-source data, can be obtained to inform on large vertebrate populations and to provide opportunities for assessment of species conservation status in areas where field constraints are important.
Methods
Study area
This study took place in French Guiana, a French administrative unit covering ~84,000 km2 located on the northern part of South America, on the Guiana Shield. The Guiana Shield is one of the largest pristine Neotropical rainforest blocks and a floristically distinctive province com-pared to the Amazonian basin [39]. Eighty percent of French Guiana is covered by upland moist forests implanted on generally well-drained clayic ferralic soils (i.e., Ferralsol and Acrisol; [40]) over altitudes of 0–600 m. Canopy reflectance has defined five main forest types in terms of structure: low dense forests, high forests with regular or disrupted canopy, mixed high and open forests, and Euterpe palm forests [41]. Tree species composition varies depending on the relief: very diversified on the all-slope reliefs, the forest is generally dominated by Lecythidaceae on the northern hilly multiconvex reliefs, the Leguminosae-Caesalpinioideae on the central tablelands and Burseraceae on the southern inland plains [42]. The alluvial coastal plain is cov-ered by marsh forests, savannas, transition forests, and herbaceous swamps and is rather nar-row on this part of the Guiana shield [43]. Compared to other Neotropical countries, the forest conservation status of eastern Venezuela, Guyana, Suriname, French Guiana and the Brazilian states of Amapá and Pará is still rather favorable. French Guiana benefits from an extensive network of protected areas including five nature reserves, located in patches in the northern half of the country, and a national park in the south, for a total protected area of 23,000 km2 (>25% of the country).
SDM modeling of jaguars: identification of more suitable habitats
Volunteer participation of naturalist networks (environmental NGOs, a public database, scientists) allowed us to record 302 recent sightings (2008–2014) of jaguars on different 0.5 × 0.5-km units. We used a maximum entropy procedure (MaxEnt 3.3.3k, [44]) to estimate the probability distribution of the maximum entropy of each environmental variable across the study area. This analysis has a recognized effectiveness in processing presence-only data and small data sets [45]. To control the likely geographic bias of sighting distribution, the model was forced to use environmental layers restricted to the sampling areas during the learning stage [46]. Predicted areas of occurrence were then projected at the country scale. The model was run using 75% of records for training and the remaining 25% for testing. Five thousand iterations were used with a bootstrap replicate strategy. A 1.0 × 10⁻⁵convergence threshold, logistic output format and linear/quadratic regularization values were set. The following
predictive environmental data were used to investigate the occurrence of species and to predict more suitable habitats: pluviometry [47]; mean altitude and range of altitude within the grid [48]; vegetation types defined with low spatial resolution remote-sensing data [41]; biogeo-graphic units [49]; and the human footprint representing the distribution and strength of pres-sures on natural habitats [24]. The addition of environmental data (pluviometry, altitudes, biogeography) and more local idiosyncratic factors (vegetation types, footprint) may help pre-dict broad spatial structures while bionomic variables may tend to present finer grained spatial patterns [50]. The models were interpreted with the AUC test [51]. However, because the AUC test could lead to misinterpretation of model accuracy [52], the null model hypothesis [53] was also used to test the performance of the predictions. We generated 99 random distributions and considered the 95th AUC value as the upper limit of the 95% CI of the AUC. Then, as soon as the AUC value of one species was higher than this 95th ranked AUC, the accuracy of the SDM was significantly higher than expected by chance alone with p<0.05.
Camera trapping: density assessment
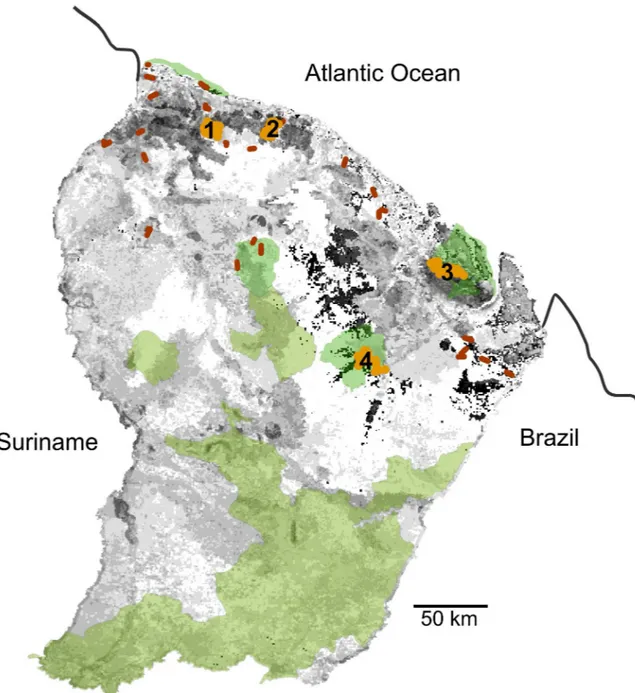
Four sites were surveyed in the north and center of French Guiana, in terra-firme highland for-ests. From west to east, the sites were (1) The Montagne de Fer ("MdeFer", center of the area: 05°20' N, 52°32' W), (2) Counami forest ("Counami", center of the site: 05°18'N, 53°05 W), (3) Montagne de Kaw ("MdeKaw", center area: 04°35' N, 52°20' W), and (4) The Nouragues Nature reserve ("Nouragues", center area: 04°10' N, 52°40' W) (Fig 1). The first two sites are dominated by dense, regular canopy forest [41] and were formerly logged forests. Low-impact logging practices are implemented in these areas, with fewer than five trees extracted per hectare [54] and fully controlled logging activities. The third site was a nearly pristine forest area, partly protected by two nature reserves, Kaw-Roura National Nature Reserve, and Trésor Regional Nature Reserve. The fourth site is a pristine and fully protected area, dominated by dense and regular canopy forest. Sites (1) and (2) did not require specific permission for implementing the studies. Studies on sites (3) and (4) were conducted with the permission formalized by the agreement signed between the National Forest Agency, the NGO AGEP (managers of the Nature Reserve), and the NGO Kwata (in charge of the study).
Surveys were implemented in 2007, 2008, 2009 and 2010 (sites 1, 2, 3 and 4, respectively) during the dry season, from September to December. On each site, 16–18 stations were spaced 2–3 km apart (MdeFer: m = 2.2 ± 0.3; Counami: m = 2.2 ± 0.4, MdeKaw: m = 2.5 ± 0.5, Noura-gues: m = 2.4 ± 0.9) with two cameras per station (DeerCam and CamTrakker argentic models for Montagne de Fer, Counami and Montagne de Kaw, and Reconyx 500 for the Nouragues reserve). Traps were in place for 3 months, a reasonable duration to fit with the population clo-sure requirement for CMR models [38]. The surveys included 1,656 station/nights for MdeFer, 1,690 on Counami, 1,530 on MdeKaw, and 1,870 for Nouragues. Data analysis followed classi-cal methodologies, including animal identification based on skin spots, assessment of theoreti-cal population size with capture/recapture methods (CAPTURE, [55]) and assessment of effective study area using recapture distances. A first classical buffer of ½ MMDM (half of the mean maximum distance moved by individuals photographed on separate capture occasions [38]) was used. Half the MMDM may nevertheless result in overestimation of abundance, and a MMDM buffer is recommended [30].
Abundance of prey species
To investigate the relations between the habitats, the occurrence of the jaguar and the prey community, we explored the abundance of selected jaguar prey species [56,57], including two rodents (Myoprocta acouchy and Dasyprocta leporina), three Artiodactyla (Mazama
nemoviraga, Mazama americana, and P. tajacu), and two large frugivorous birds (Crax alector
and Psophia crepitans) on a wide range of sites. Abundance was measured with the line transect method on 30 sites, with a mean area covering 97 ± 2.1 km expected to provide a stabilized assessment of abundance [31] (Fig 1). The 30 sites were distributed in most terra firme forest landscape units [40,49], in order to encompass regional particularities related to given forest habitats [58]. Additionnal information on survey sites are provided inS1 Table. The correla-tions were tested between species abundance (expressed with a kilometric index [KI], i.e., the Fig 1. French Guiana study sites, with the protected areas. Protected areas: nature reserves and national parks, in green. Locations of the sites where camera-trap surveys were implemented (1, Montagne de Fer; 2, Counami; 3, Montagne de Kaw; 4, Nouragues) in light brown; locations of the areas where line-transects were implemented in dark brown; and jaguar habitats from less favorable (light grey) to more favorable (dark grey).
number of contacts, or individuals in case of gregarious species, per kilometer), the biomass index (KI × mean adult weight, with weights derived from [59] and (i) the predicted occurrence of the jaguar (i.e., the suitability score derived from SDM at the survey site), (ii) the human footprint [24] and (iii) the habitat structure defined with canopy heights and above-ground biomass (AGB) (see below). To assess the area required to target stabilized abundance, we con-sidered the correlation between the asymptotic abundance value (sampling area > 100 km [24]), and abundance assessed with a smaller sampling effort.
Habitat structure, jaguars and prey
On these 30 sites, four data sources were used to describe habitats: i) maximum canopy height from a full waveform space-borne LiDAR; ii) canopy height as well as roughness and terrain data from the LiDAR waveform length; iii) AGB; and (iv) geology. The LiDAR data were acquired from the Geoscience Laser Altimeter System (GLAS) onboard the ICE, Cloud and land Elevation Satellite (ICESat). The GLAS sensor, which orbited Earth from 2003 to 2009, acquired data using a 1064-nm laser with a nominal footprint on the earth’s surface of approxi-mately 65 m and a distance of 172 m between each footprint. Each waveform contains data on the time variations in the intensity of the energy returned from each laser pulse, thus providing information on the vertical structure of the canopy. Several variables related to vegetation struc-ture can be extracted from the GLAS waveforms [60–63]. However, in this study only the wave-form extent, which corresponds to the distance between the signal’s beginning and end, was used. The waveform extent provides information on the combination of vegetation height and the effect of topographic slope [60]. Canopy height estimation resulted from [64], these estima-tions produced a precision on the canopy height estimation of 3.6 m. Finally, a 3 × 3-pixel spa-tial standard deviation of terrain data derived from the Shuttle Radar Topography Mission (SRTM) Digital Elevation Model (DEM) were used as a proxy for canopy roughness. AGB esti-mates stem from a spatial predictive model [65]. This prediction map is based on the invento-ries of 2507 field plots in undisturbed rainforest (0.4–0.5 ha) distributed over the entire region. The model was developed by kriging-regression in order to include spatial and environmental effects on AGB. The relationship between the niche model, the abundance of prey species, can-opy structure, terrain roughness, and AGB was studied using random forests [66]. For the geol-ogy, a geological substratum map produced by the French Geological Survey [67] was used. The map was simplified in order to retain only the five largest rock formations: recent sediments, volcanic sedimentary rock, granites, gabbros and gneiss. This simplification was required so that each geology class could be sampled with satisfactory accuracy.
Results
Distribution modeling and density for the jaguar
Predicted jaguar occurrence distribution is highly reliable (area under the curve, AUC = 0.832), and the reliability of the null hypothesis that the accuracy of the model was significantly higher than expected by chance was greater than 95% (p<0.05). The jackknife test on both test gain and the AUC showed a major contribution of rain and biogeography in the explanation of the distribution.Fig 1shows the areas where the most favorable conditions were identified with the MaxEnt model. These areas include many habitats in the northern part of the country, in the so-called low joint valleys and complex multiconvex landscapes, and more in the south on low plateaus and mountains (sensu, [42]). On the four sites where density was measured, the number of jaguars identified ranged from six to nine. Depending on the sites and species, CAP-TURE identified either Mo (null estimator) or Mh (jackknife estimator) as the best population estimators and calculated eight to ten animals (Table 1). Survey areas calculated on the basis
of ½ MMDM (animals captured at more than one camera station, from MdeFer: three (Cou-nami, MdeKaw) to eight individuals (MdeFer); Counami: three individuals; MdeKaw: three individuals; Nouragues: five individuals), were 194, 246, 275 and 229 km2for MdeFer, Cou-nami, MdeKaw and Nouragues, respectively. Associated calculated density values ranged from 2.9 adults/100 km2at MdeKaw to 5.1 adults/100 km2at MdeFer. The survey areas calculated on the basis of MMDM and associated densities ranged from 562 km2and 1.4 adults/100 km (MdeKaw) to 405 km2and 2.5 adults/100 km2(MdeFer). Despite the substantial differences in the number of recorded animals (Table 1), mean densities did not statistically differ between the four sites, and consequently were not influenced by the Human Footprint Index.
Habitats and prey communities
Of the 30 sites, the cumulated abundance of the five target mammal species (M. acouchy, D.
leporina, M. nemoviraga, M. americana, P. tajacu) and of the two birds (C. alector and P. crepi-tans) were negatively correlated with the human footprint (p(uncorr.) = 0.03, r = −0.31 and p(uncorr.)<000.1 r = −0.63, respectively). The biomass value of birds was also negatively
corre-lated with the human footprint (r = −0.63, p = 0.0002), the biomass of mammals was also nega-tively correlated to the footprint, although the relation was not significant (r = −0.32, p = 0.07) (Fig 2). Although concomitantly measured on four sites only, prey was more abundant where higher densities of jaguars were recorded, but neither biomass nor abundance was correlated with the jaguar’s predicted favorability index.
Early indicators of population status and collapse?
The accumulation curves of new jaguars recorded in each survey area stabilized after consider-able field work: 50 days (1000 traps/night) on the sites with lower density, and 80 days (1600 traps/night) for the two sites with higher density values (Fig 3). Field work for assessment of high vertebrate abundance shows that a survey longer than 20 days (cumulative distance greater than 80 km of linear transect) is necessary to relevantly assess the abundance of ungu-lates; the field work required could be shorter for large birds (50–60 km of linear transects, i.e., 8–10 days) (Fig 3).
Canopy roughness was negatively correlated with the human footprint and was higher in more pristine habitats (r = −0.66, p(uncorr.)<0.001). The AGB model cannot integrate the effect of human disturbance: remote-sensing data as well as field data on disturbed plots were not included in the analysis [65]. Canopy roughness was correlated with the abundance and biomass of large terrestrial birds (r = 0.73, p(uncorr.)<0.001 and r = 0.74, p(uncorr.)<0.001, respectively), although relations between AGB and large vertebrate abundance were not signifi-cant. Finally, a random forest classification showed that the jaguar distribution on one hand Table 1. Results of four camera-trapping surveys in French Guiana for jaguars.
Nb of animals identified / Nb of animals×100 km2* Calculated population Mean D max (km)
Surveyed area / density (for 100 km2(1/2 MMDM)
Surveyed area /density for 100 km2(MMDM)
1. Montagne de Fer
9 / 14.0 10 [SE = 3.0] 6.6 194 km2/ 5.1 ind.(SE = 3.6–6.7) 405 km2/ 2.5 ind. (SE = 1.7–3.2)
2. Counami 6 / 9.0 8 [SE = 2.1] 7.8 246 km2/ 3.3 ind. (SE = 2.8–4.1) 530 km2/ 1.5 ind. (SE = 1.3–1.9)
3. Montagne de Kaw
6 / 6.7 8 [SE = 1.9] 6.6 275 km2/ 2.9 ind. (SE = 2.2–3.6) 562 km2/ 1.4 ind. (SE = 1.1–1.8)
4. Nouragues 9 / 10.2 10 [SE = 2.5] 7.1 229 km2/ 4.4 ind. (SE = 3.3–5.5) 507 km2/ 2.0 ind. (SE = 0.15–2.5)
*as defined by the minimum convex polygon size
and canopy roughness and geology on the other hand, were significantly correlated (r = 0.61,
p(uncorr.)<0.01). Adding more information in addition to the canopy structure, such as
maxi-mum canopy height from GLAS, GLAS waveform extent, terrain roughness, geology and AGB, the strength of the relation between the niche model and these variables increased (r = 0.71,
p(uncorr.)<0.01).
Discussion
In addition to direct habitat loss that can be monitored via direct imaging or with more precise tools (e.g., biomass and carbon measurements [68]), much more cryptic threats such as hunt-ing and its cascadhunt-ing effects comprise the main threat in tropical forests [4], requiring adequate and early indicators. We focused on the region of the Guianas, in northern South America, confronted with a dual challenge: (i) the need to reinforce its recognition as an area of major importance for long-term conservation of forest species and (ii) the need to mitigate increasing human population growth, with its cascades of pressures on forest ecosystems. We developed Fig 2. Biomass Index (kg-1×km of transect) of a selected set of terrestrial birds and mammals, according to the Human Footprint Index, and associated correlation curves. The four study sites for jaguar density assessment are given on the index scale, according to their mean value. The two pictures show sites with a 5–10 Index value (left) and a 15–20 Index value (right).
our approach on predator, prey and habitats, and expect to detect early signs of population col-lapse, before shifting to empty forests.
Species distribution modeling and jaguar density
Jaguars were recorded in most of the country, and no large area of local extinction was evi-denced. Niche modeling identified some habitats as more favorable, on the northeastern and center relief landscape belts. These favorable regions were previously detected in the wider-scale approach [25] and include "complex multiconvex landscapes," "slopes," "low plateaus" and "mountains" (sensu, [42]). A previous study showed that the α diversity of large verte-brates, expected to be prey for predators, was low on those landscapes [58]. But although only a few vertebrate species showed a marked preference for those areas, the red brocket deer (M.
americana), the collared peccary (P. tajacu) and the red agouti (D. leporina) were the only
spe-cies with a clear preference for the complex multiconvex landscapes, low plateaus and moun-tains of these environments [58]: they may be important resources for the jaguar in these landscapes.
Regarding density, assessments were roughly within the ranges reported in the central and south regions of South America [69] and are expected to reflect healthy populations. Fig 3. Field surveys required to assess abundance of ungulates and two frugivorous birds, based on 40 surveys (up), and the number of jaguars based on four study areas (down). Top: the r coefficient correlation shows the correlation between the stabilized abundance (sampling effort>100 km) and abundance assessed with a lesser sampling effort. The correlation is derived from 40 surveys.
Comparisons with other sites should nevertheless be interpreted cautiously, since these data from French Guiana are the first available for the northern Amazon region. At a more local scale, although not significant, differences in felid density were noted between the four sites. The two sites with higher jaguar density were the least disturbed areas: the Nouragues Nature Reserve and the Montagne de Fer, which is a formerly logged area. The network of ancient log-ging tracks at Montagne de Fer could also have slightly biased the results. In jaguars, the higher tolerance of males to human-modified landscapes, including the attractiveness of tracks [70], increased the capture rate and may have slightly overestimated jaguar density despite the cor-rection by the capture-recapture models. Nevertheless, the rough number of animals detected, weighted by the size of the survey area, remained higher at Nouragues and Montagne de Fer, reinforcing the idea of a large population on the latter site (Fig 4).
The performance of the model, further confirmed by field-measured density, also
highlighted the most important areas for the future of populations, directly related to conserva-tion issues. Although the southern areas benefit from Naconserva-tional Park protecconserva-tion, the favorable habitats located in the north of the country are less covered by protected areas (Fig 1) and therefore require that particular attention be paid to these areas for future populations.
Prey and forest structure provide better information on jaguar habitats
Ungulates (M. nemoviraga, M. americana, P. tajacu) and large frugivorous terrestrial birds (C.
alector, P. crepitans) are expected to be key resources for large felids [71]. When compared to other forest surveys in Amazonia [72–75], the abundance of these species measured in French Guiana confirms the idea of the overall good status of forest ecosystems. However, the general pattern observed of more abundant prey on more suitable habitats for jaguar is not significant. This suggests that the jaguar’s diet may be highly diverse and depend on a wider range of prey species than considered here, including smaller species. Also, we previously evidenced that some opportunistic species, such as agouti, collared peccary and tapirs, may maintain or even take demographic advantage in old logged forests [24,76], explaining the high density observed Fig 4. Fauna communities on the four study sites with implementation of both camera-trapping and linear transects: jaguar density, biomass index of mammal prey, biomass index of terrestrial bird prey.
at Montagne de Fer and helping ensure the future of jaguar populations on those managed forests.
Negative responses of prey abundances to Human Footprint Index (either highly significant in the case of terrestrial birds, or close to significance in the case of terrestrial mammals), sug-gesting that the mega vertebrate community can persist in selectively logged forests [77], but unmanaged hunting pressure could result in substantial population declines and threatened prey and predators in a cascading effect. Twenty-five percent of the country is above a thresh-old value, which may indicate that populations of ungulates, large rodents and large terrestrial birds are beginning to collapse [24]. Long before deforestation and forest habitat loss, estimated over the last decade (2000–2012) at less than 20,000 ha, i.e., less than 0.2% of the territory (derived from [3]), overhunting is the main threat for these species. Assessment of hunting sus-tainability has not been investigated in French Guiana for Artiodactyla, but monitoring of pri-mate hunting has shown unsustainable harvests in many settlements, including in local and traditional communities [23]. Similar results were obtained for tapirs [78]. Given the near absence of hunting management in French Guiana, hunters’ access to large forest areas via log-ging tracks and hunting pressure exerted by several tens of thousands of gold miners [19,21], the greater threat to jaguar survival could likely be the negative trends of prey abundance due to hunting.
Regional conservation issues
With wide-ranging species such as large carnivores, together with the range-wide conservation network [79], the identification of refugia and lower-quality habitat are necessary for long-term conservation planning, which may require fine-management-scale units [80]. Human-use areas are also important habitats for connectivity and dispersal of jaguars between core protected areas [81].
Setting priorities for conservation in largely undisturbed regions such as the Guianas may nevertheless differ from those commonly applied to highly disturbed and human-dominated regions [82]. The Amapa–French Guiana Jaguar Conservation Unit of has been listed as the highest priority, with substantial opportunities for large-scale dispersals due to lack of frag-mentation with highly conserved Southern forest blocks, and an estimated population size of more than 500 animals [83]. Although this very open and unfragmented population precludes adequate population viability analysis [84], many parts of the Guianas still provide unique opportunities to conserve species with large ecologic and spatial requirements and are expected to ensure its future. The first lesson of this long-term survey of jaguars and their prey is the good status of conservation in French Guiana and likely the entire eastern part of the Guiana shield, with no evidence of widespread jaguar depletion. Governmental management of forests, selective and reduced-impact logging techniques [85] and the network of protected areas have safeguarded a satisfactory status of forest habitats, associated species and trophic cascades. Although the SDM approach identified less favorable habitats (Fig 1), these areas are unfrag-mented, far from anthropic threats and connect areas of importance. They consequently should not be considered as "ecological traps" (sensu [80]) but as landscape connectivity between preferred areas.
Regarding habitat loss, gold mining activities [15] are responsible for an annual loss of 2,000 hectares of forest habitat, and the recent alarming increase of deforestation due to the demand for gold has been spotlighted [17]. However, long before deforestation, defaunation and empty forests threaten tropical ecosystems. The main concern in the Amapá and French Guiana Jag-uar Conservation Unit is overhunting of prey. A decades-long lack of hunting regulation, wide-spread and cryptic harvests of wild species by goldminers, and demographic expansion of local
communities with little access to alternative resources result in silent shifts of rich forests and empty areas. Similar to other Amazonian regions spared by large-scale deforestation [23,86], insufficient management of hunting is likely the most significant threat for ungulates, large birds and the top predators.
Beyond the Guiana jaguars and canopy: new tools and opportunities for
wildlife conservation
Conservation initiatives require adequate proxies to detect early and cryptic population col-lapses and often suffer from lack of data and limited access to large field inventories. The rele-vance of the proxies is based on four assumptions: (i) comprehensive sets of input data, (ii) relevant explanatory variables (i.e., environmental descriptors), (iii) good indicator species and (iv) adequate modeling procedures. This raises the question of the target species and the rele-vance of charismatic species (i.e., species that will draw more attention from nonprofessional recorders) as proxies. Large carnivores and apex predators are widely accepted as indicators and keystone species, and furthermore are often threatened [87,88]. However, the jaguar has recognized opportunistic behavior and diet plasticity with a wide range of prey consumed, including small species [89] that may benefit from forest cover changes [90], for which forest managers may miss early signs of population disturbance and delay detectable responses, are consequently insufficient early indicators of forest and animal community disturbances, at least at the relatively low extent and strength levels observed in the Guianas. We can concur with previous research [91] and assume that large carnivores may not be locally relevant indi-cators for local and/or early changes in forest animal communities encountering rather low and cryptic threats.
The abundance of some prey species may be a better proxy for the threat to jaguars. How-ever, field work for assessing large vertebrate density and abundance in forest habitats is also important and could delay the ability to detect a population’s collapse. For instance, we previ-ously showed that a cumulative distance greater than 100 km of linear transect could be neces-sary to relevantly assess the abundance of ungulates [24]: regular monitoring in protected areas and/or in managed forest areas may be limited. The field work required could be shorter for large birds (50–60 km of linear transects, i.e., 8–10 days) (Fig 3). Focusing on these species only, which are also the first to collapse [24], could provide a relevant indicator.
Large sets of open and/or shared data [92,93] allow modeling, extrapolation and assessment of population trends at uncovered resolution and open new avenues for conservation. Increas-ing enthusiasm for participative science, or "public participation in scientific research," is accepted as a win–win model [94], not only because it results in increased knowledge of biodi-versity issues and of the participants’ local environments, but also because engagements in sci-ence are expected to change attitudes and environmental behavior [95,96]. In the present case, more than 75% of the jaguar records come from non-scientist recorders, obviously facilitated by the charismatic value of the species. Once such data sets are properly analyzed, they may successfully contribute to biodiversity monitoring. Species distribution models are increasingly used for conservation science [97] and can efficiently contribute to this task, transforming citi-zen data into identification of areas acting as sources and corridors, and providing original con-ductance and/or resistance values for landscape connectivity modeling [76].
Far more promising are the data derived from remote-sensing and radar/LiDAR analysis of forest structure. Here we showed that information based on the latest remote-sensing and plane-imaging techniques can detect fine-scale damage to the canopy cover and may inform on the status of associated fauna communities. AGB, canopy height and soil roughness informed on jaguar habitat and showed a clear relation to the predicted favorability and may
highight, when surimposed with the Human Footprint index driving abundances of prey, areas of importance for long-term maintenance of ecological dynamics (Fig 5). Complex canopy structure, roughness and high AGB levels were correlated with a higher predicted occurrence of jaguar. In Chile, mesocarnivores also responded to fine-grain habitat structure attributes, identified from LiDAR, much more than to habitat, landscapes and vegetation classifications [98]. Although biotic relations between forest structure, phenology, vertebrate communities and ultimately predators will require further investigation, the high level of confidence of the relations observed between these factors already suggests that this tool will help identify key areas for conservation. Remote-sensing measurements could help detect the scale at which ani-mals discriminate habitat characteristics, as well as the scale at which conservation priorities Fig 5. French Guiana more favorable habitats of prey. Protected areas: nature reserves and national parks, in green. Hatchings: area with Human Footprint Index<15 (thresold value allowing maintenance of the abundance of most of prey species). Dark grey: forest areas with canopy roughness>12, favoring higher biomass of prey.
and plans must be implemented. Compared to categorical classifications, more gradient-based analyses of landscape architecture will yield more realistic representations of ecological hetero-geneity and better predict species responses and needs [99].
Spatial and aerial images have already shown their usefulness in detecting large- and fine-scale habitat disturbance [100]. We also show here that LiDAR provides a relevant indication of forest disturbance and may easily inform on the status of habitats and associated fauna com-munities. Increasingly efficient tools, based on remote sensing and innovative spatial analysis methods (e.g., [101]), are being developed and will soon be operational, e.g., Sentinel 1 (radar) and Sentinel 2 (optical) satellite constellations from the European Space Agency. They will be useful to monitor tropical rainforest habitats. At this time, different techniques can be applied to obtain data dependently on the degree of precision required. In the present study, LiDAR has shown that it can estimate canopy roughness at a large scale; other techniques such as FOTO (FOurier Textural Ordination) [102] should also be explored. Furthermore, more and more open-source data are available at wide geographic scales [36]. Characterizing structure and functioning habitats to identify threats on flora and fauna are key points in the global esti-mation of ecosystems services in general, and of biodiversity in particular. Remote sensing pro-vides a wide panel of investigative tools to monitor habitats and help decision makers in their conservation policies [103], and they can be particularly useful in remote forest areas as early indicators of the first signs of habitat damage and subsequent threats to animal communities.
Supporting Information
S1 Table. Sites where implemented surveys of jaguars (bold) and prey (bold and other), with projected geographic coordonates, threats, landscape categories, Human footprint, and abundance of a selected set of prey species.
(XLSX)
Acknowledgments
The camera-trapping surveys were funded by the Wildlife Conservation Society and the SPE-CIES project, the WWF Network, European Funds (FEDER), FFEM, the DGIS and the French Ministry of Higher Education and Research. Field surveys for prey were funded by Diren Guyane, DEAL Guyane, ONF Guyane, and the Réserve Naturelle Nationale de la Trinité. We are grateful to Leo Maffei (WCS) for his advice and assistance in the field for the first camera trapping session in French Guiana. We acknowledge the Nouragues Nature Reserve, the CNRS Guyane, and the DEAL Guyane, for field support during the Nouragues trap session.
Author Contributions
Conceptualization: BdT. Formal analysis: BdT IF VG. Funding acquisition: BdT. Investigation: BdT IF LC SB EP VG. Methodology: BdT IF VG. Project administration: BdT. Resources: BdT IF VG. Software: IF VG.Supervision: BdT. Validation: BdT. Visualization: BdT.
Writing – original draft: BdT.
Writing – review & editing: BdT IF LC SB EP VG.
References
1. Butchart SHM, Walpole M, Collen B, van Strien A, Scharlemann JPW, Rea A, et al. Global Biodiver-sity: Indicators of Recent Declines. Science 2010; 328: 1164–1168 doi:10.1126/science.1187512
PMID:20430971
2. Tittensor DP, Walpole M, Hill SLL, Boyce DG, Britten GL, Burgess ND, et al. 2014. A mid-term analy-sis of progress toward international biodiversity targets. Science 2014; 346: 241–244. doi:10.1126/ science.1257484PMID:25278504
3. Hansen MC, Potapov PV, Moore R, Hancher M, Turubanova SA, Tyukavina A, et al. High-Resolution Global Maps of 21st-Century forest cover change. Science 2013; 342: 850–853. doi:10.1126/ science.1244693PMID:24233722
4. Wilkie DS, Bennett EL, Peres CA, Cunningham AA. The empty forest revisited. Annals New York Academy of Sciences 2011; 1223: 120–128.
5. Jorge MLSP, Galetti M, Ribeiro MC, Ferraz KMPMB. Mammal defaunation as surrogate of trophic cascades in a biodiversity hotspot. Biological Conservation 2013; 163: 4–57.
6. Nunez-Iturri G, Olsson O, Howe HF. Hunting reduces recruitment of primate-dispersed trees in Ama-zonian Peru. Biological Conservation 2008; 141: 1536–1546.
7. Beck H, Snodgrass JW, Thebpanya P. Long-term exclosure of large terrestrial vertebrates: implica-tions of defaunation for seedling demographics in the Amazon rainforest. Biological Conservation 2013; 163: 115–121.
8. Levi T, Peres CA. Dispersal vaccum in the seedling recruitment of a primate-dispersed Amazonian tree. Biological Conservation 2013; 163: 99–106.
9. Peres CA, Dolman PM. Density compensation in neotropical primate communities: evidence from 56 hunted and nonhunted Amazonian forests of varying productivity. Oecologia 2000; 122: 175–189. 10. Valiente-Banuet A, Aizen MA, Alca´ntara JM, Arroyo J, Cocucci A, Galetti M, et al. Beyond species loss: the extinction of ecological interactions in a changing world. Functionnal Ecology 2015; 29: 299–307.
11. Lewis SL, Edwards DP, Galbraith D. Increasing human dominance of tropical forests. Science 2015; 349: 827–832. doi:10.1126/science.aaa9932PMID:26293955
12. Eva HD, Achard F, Beuchle R, de Miranda E, Carboni S, Seliger R, et al. Forest cover changes in tropical south and central America from 1990 to 2005 and related carbon emissions and removals. Remote Sensing 2012; 4: 1369–1391.
13. Goodwin A, editors. Principles of Precambrian Geology. Academic Press, New York, 1996; 319 pp. 14. Hammond DS. Ancient land in a modern world. In: Hammond D.S. (ed). Tropical Forests of the
Gui-ana Shield CABI Publishing, Cambridge, 2005, pp. 1–14.
15. Taber A, Chalukian SC, Altrichter M, Minkowski K, Liza´rraga L, Sanderson E, et al. El Destino de los Arquitectos de los Bosques Neotropicales: Evaluacio´n de la Distribucio´n y el Estado de Conserva-cio´n de los Pecarı´es Labiados y los Tapires de Tierras Bajas. 2008; New York, Pigs, Peccaries and Hippos Specialist Group (IUCN/SSC); Tapir Specalist Group (IUCN/SSC); Wildlife Conservation Society; and Wildlife Trust.
16. Groenendijk J. A review of the distribution and conservation status of the giant otter (Pteronura
brasi-liensis), with special emphasis on the Guayana Shield Region. Netherlands Commitee for IUCN,
1998. Amsterdam.
17. Rheingantz ML, Saraiva de Menezes JF, de Thoisy B. Defining Neotropical otter Lontra longicaudis distribution, conservation priorities and ecological frontiers. Tropical Conservation Science 2014; 7: 214–229.
18. Zeller KA. Jaguars in the New Millennium Data Set Update: The State of the Jaguar in 2006. Wildlife Conservation Society, Bronx, New York; 2007.
19. Hammond DS, Gond V, de Thoisy B, Forget PM, DeDijn B. Causes and consequences of a tropical forest gold rush in the Guiana Shield, South America. Ambio 2007; 36: 661–670. PMID:18240682
20. Leisher C, Touval J, Hess SM, Boucher TM, Reymoudin L. Land and forest degradation inside pro-tected areas in Latin America. Diversity 2013; 5: 779–795.
21. Alvarez-Berrios NL, Aide MT. Global demand for gold is another threat for tropical forests. Environ-mental Research Letter 2015; 10: 014006.
22. de Thoisy B, Renoux F, Julliot C. Hunting in northern French Guiana and its impacts on primates communities. Oryx 2005; 39: 149–157.
23. de Thoisy B, Richard-Hansen C, Peres CA. Impacts of subsistence game hunting on amazonian pri-mates. In Garber Paul A., Estrada Alejandro, Bicca-Marques Ju´lio Ce´sar, Heymann Eckhard W. and Strier Karen B. (eds). South American Primates: Comparative Perspectives in the Study of Behavior, Ecology, and Conservation. 2009; Book Series Developments in Primatology: Progress and Pros-pects, Springer Press, Chap 15, pp 389–412.
24. de Thoisy B, Richard-Hansen C, Goguillon B, Joubert P, Obstancias J, Winterton P, et al. Rapid eval-uation of threats to biodiversity: human footprint score and large vertebrate species responses in French Guiana. Biodiversity and Conservation 2010; 19: 1567–1584.
25. Torres NM, De Marco P Jr, Santos T, Silveira L, Jacomo ATA, Diniz-Filho JAF. Can species distribu-tion modelling provide estimates of populadistribu-tion densities? A case study with the jaguar in the Neotrop-ics. Diversity and Distributions 2012; 18: 615–627.
26. Farhadinia MS, Ahmadi M, Sharbafi E, Khosravi S, Alinezhad H, MacDonald DW. Leveraging trans-boundary conservation partnerships: persistence of Persian leopard (Panthera pardus saxicolor) in the Iranian Caucasus. Biological Conservation 2015; 191: 770–778.
27. Caso A, Lopez-Gonzalez C, Payan E, Eizirik E, de Oliveira T, Leite-Pitman R, et al. 2008. Panthera onca. The IUCN Red List of Threatened Species. 2008; Version 2014.3.<www.iucnredlist.org>. Downloaded on 11 March 2015.
28. Estes JA, Terborgh J, Brashares J, Power ME, Berger J, Bond WJ, et al. Trophic downgrading of planet earth. Science 2011; 333: 331–306.
29. de Barros AE, MacDonald EA, Matsumoto MH, Paula RCP, Nijhawan S, Malhi Y, et al. Identification of areas in Brazil that optimize conservation of forest carbon, jaguars, and biodiversity. Conservation Biology 2014; 28: 580–593. doi:10.1111/cobi.12202PMID:24372997
30. Tobler MW, Powell CVN. Estimating jaguar densities with camera-traps: problems with current designs and recommendations for future studies? Biological Conservation 2013; 159: 109–118. 31. de Thoisy B, Brosse S, Dubois MA. Assessment of large-vertebrate species richness and relative
abundance in Neotropical forest using line-transect censuses: what is the minimal effort required? Biodiversity and Conservation 2008; 17: 2627–2644.
32. Gond V, Brognoli C. Te´le´de´tection et ame´nagement du territoire: localisation et identification des sites d’orpaillage en Guyane franc¸aise. Bois et Forêts des Tropiques 2005; 286: 5–13.
33. Briant G, Gond V, Laurance S. Habitat fragmentation and the desiccation of forest canopies: A case study from eastern Amazonia. Biological Conservation 2010; 143: 2763–2769.
34. Bourbier L, Cornu G, Pennec A, Brognoli C, Gond V. Large scale forest opening estimation using remote sensing in Central Africa. Bois et Forêts des Tropiques 2013; 315: 3–9.
35. Pithon S, Jubelin G, Guitet S, Gond V. Statistical based method for logging-related canopy gap detec-tion using high resoludetec-tion optical remote sensing. Internadetec-tional Journal of Remote Sensing 2013; 34: 700–711.
36. De Sy V, Herold M, Achard F, Beuchle R, Clevers JGPW, Lindquist E, et al. Land use patterns and related carbon losses following deforestation in South America. Environmental Research Letters 2015; 10: 124004.
37. Rose CA, Byler D, Eastman JR, Fleishman E, Geller G, Goetz S, et al. Ten ways remote sensing can contribute to conservation. Conservation Biology 2015; 29: 350–359. doi:10.1111/cobi.12397
PMID:25319024
38. Silver S, Ostro L, Marsh L, Maffei L, Noss A, Kelly M. The use of camera traps for estimating jaguar
Panthera onca abundance and density using capture/recapture analysis. Oryx 2004; 38: 148–154. 39. Lindeman JC, Mori SA. The Guianas. Pp. 375–390 in Campbell DG, Hammond HD, editors. Floristic
Inventories of Tropical Countries: The Status of Plants Systematics, Collections and Vegatation, Plus Recommendations for the Future. 1989; New York: New York Botanical Garden.
40. Guitet S, Freycon V, Brunaux O, Pe´lissier R, Sabatier D, Couteron P. Geomorphic control of rain-for-est floristic composition in French Guiana: more than a soil filtering effect? Journal of Tropical Ecol-ogy 2016; 32: 22–40.
41. Gond V, Freycon V, Molino JF, Brunaux O, Ingrassia F, Joubert P, et al. Broad-scale spatial pattern of forest landscapes types in the Guiana shield. International Journal of Applied Earth Observation and Geoinformation 2011; 13: 357–367.
42. Guitet S, Pe´lissier R, Brunaux O, Jaouen G, Sabatier D. Geomorphological landscape features explain floristic patterns in French Guiana rainforest. Biodiversity and Conservation 2015; 24:2015– 2037.
43. de Granville JJ. Phytogeographical characteristics of the Guianan forests. Taxon 19888; 37: 578– 594.
44. Phillips SJ, Anderson RP, Schapire RE. Maximum entropy modeling of species geographic distribu-tions. Ecological Modelling 2006; 190: 231–259.
45. Wisz MS, Hijmans RJ, Li J, Peterson AT, Guisan A. Effects of sample size on the performance of spe-cies distribution models. Diversity and Distributions 2008; 14: 763–773.
46. Dudı´k M, Schapire RE, Phillips SJ. Correcting sample selection bias in maximum entropy density estimation. Advances in Neural Information Processing Systems 2005; 18: 323–330.
47. Hijmans RJ, Cameron SE, Parra JL, Jones PG, Jarvis A. Very high resolution interpolated climate surfaces for global land areas. International Journal of Climatology 2005; 25: 1965–1978.
48. Farr TG, Rosen PA, Caro E, Crippen R, Duren R, Hensley S, et al. The shuttle radar topography mis-sion. Reviews of Geophysics 2007; 45: Rg2004
49. Guitet S, Cornu JF, Brunaux O, Betbeder J, Carozza JM, Richard-Hansen C. Landform and land-scape mapping, French Guiana (South America). Journal of Maps 2013; 9: 325–335.
50. Montoya D, Purves DW, Urbieta IR, Zavala MA. Do species distribution models explain spatial struc-ture within tree species ranges? Global Ecology and Biogeography 2009; 18:662–673.
51. Bradley AP. The use of the area under the ROC curve in the evaluation of machine learning algo-rithms. Pattern Recognition Letter 1997; 30:1145–1159.
52. Lobo JM, Jime´nez-Valverde A, Real R. AUC: a misleading measure of the performance of predictive distribution models. Global Ecology and Biogeography 2008; 17:145–151.
53. Raes N, Steege H. A null-model for significance testing of presence-only species distribution models. Ecography 2007; 30:727–736.
54. Guitet S, Pithon S, Brunaux O, Jubelin G, Gond V. Impacts of logging on the canopy and the conse-quences for forest management in French Guiana. Forest Ecology and Management 2012; 277: 124–131.
55. White GC, Anderson DR, Burnham KP, Otis DL. Capture-recapture and removal methods for sam-pling closed populations. Los Alamos National Laboratory Publications 1982; LA-8787-NERP. 235pp.
56. Avezedo FCC, Murray DL. Spatial organization and food habits of jaguars (Panthera onca) in a flood-plain forest. Biological Conservation 2007; 137: 391–402.
57. Foster RJ, Harmsen BJ, Valdes B, Pomilla C, Duncaster CP. Food habits of sympatric jaguars and pumas across a gradient of human disturbance. Journal of Zoology 2010; 280: 309–318. 58. Richard-Hansen C, Jaouen G, Denis T, Brunaux O, Marcon E, Guitet S. Landscape patterns
influ-ence communities of medium-to large-bodied vertebrates in undisturbed terra firme forests of French Guiana. Journal of Tropical Ecology 2015; 31:423–436.
59. Richard-Hansen C, Vie´ JC, Vidal N, Ke´ravec J. Body measurements on 40 species of mammals from French Guiana. Journal of Zoology 1999; 247:419–428.
60. Lefsky MA, Harding DJ, Keller M, Cohen WB, Carabajal CC, Espirito-Santo FDB, et al. Estimates of forest canopy height and aboveground biomass using ICESat. Geophysical Research Letters 2005; 32: L22S02
61. Harding DJ, Carabajal CC. ICESat waveform measurements of within-footprint topographic relief and vegetation vertical structure. Geophysical Research Letters 2005; 32: L21S10
62. Chen Q. Retrieving vegetation height of forests and woodlands over mountainous areas in the Pacific Coast region using satellite laser altimetry. Remote Sensing of Environment 2010; 114: 1610–1627. 63. Hilbert C, Schmullius C. Influence of surface topography on ICESat/GLAS forest height estimation
and waveform shape. Remote Sensing 2012; 4: 2210–2235.
64. Fayad I, Baghdadi N, Bailly JS, Barbier N, Gond V, El Hajj M, et al. Canopy height estimation in French Guiana using LiDAR ICESat/GLAS data using principal component analysis and random for-est regressions. Remote Sensing 2014; 6: 11883–11914.
65. Guitet S, He´rault B, Molto Q, Brunaux O, Couteron P. Spatial structure of above-ground biomass lim-its accuracy of carbon mapping in rainforest but large scale forest inventories can help to overcome. PloS ONE 2015; 10: e0138456. doi:10.1371/journal.pone.0138456PMID:26402522
66. Breiman L. Random forests. Machine Learning 2001; 45: 5–32.
67. Delor C, Lahondère D, Egal E, Marteau P. Carte ge´ologique de la Franceà1: 500 000. 2001; De´par-tement de la Guyane, Guyane, BRGM, Orle´ans.
68. Sexton JO, Noojipady P, Song XP, Feng M, Song DX, Kim DH, et al. Conservation policy and the measurement of forests. Nature Climate Change 2015; doi:10.1038/NCLIMATE2816
69. Noss AJ, Kelly MJ, Camblos HB, Rumiz DI. Pumas y jaguares simpa´tricos: datos de trampas-ca´mara en Bolivia y Belize. MEMORIAS: Manejo de Fauna silvestre en Amazonia y Latinoame´rica 2006; 229–237.
70. Conde DA, Colchero F, Zarza H, Christensen NL Jr, Sexton JO, Manterola C, et al. Sex matters: modeling male and female habitat differences for jaguar conservation. Biological Conservation 2010; 143: 1980–1988.
71. Gonzalez CA, Miller BJ. Do jaguars (Panthera onca) depend on large prey? Western North American Naturalist 2002; 62: 218–222.
72. Lopes MA, Ferrari SF. Effects of human colonization on the abundance and diversity of mammals in Eastern Brazilian Amazonia. Conservation Biology 2000; 14: 1658–1665
73. Wright SJ, Zeballos H, Dominguez I, Gallardo MM, Moreno MC, Ibanez R. Poachers alter mammal abundance, seed dispersal and seed predation in a neotropical forest. Conservation Biology 2000; 14: 227–239.
74. Haugassen T, Peres CA. Mammal assemblage structure in Amazonian flooded and unflooded for-ests. Journal of Tropical Ecology 2005; 21: 133–145.
75. Haugassen T, Peres CA. Population abundance and biomass of large bodied birds in Amazonian flooded and unflooded forests. Bird Conservation International 2008; 18: 87–101.
76. Cle´ment L, Catzeflis F, Richard-Hansen C, Barrioz S, de Thoisy B. Conservation interests of spatial distribution modelling applied to large vagile neotropical mammals. Tropical Conservation Science 2014; 7: 193–213.
77. Kelly MJ, Rowe C. Analysis of 5 years data from Rio Bravo Conservation and Management Area (RBCMA) and one year of data from Gallon Jug/Yalbac Ranch on trap rates for predator and prey, including jaguar density estimates in unlogged versus sustainably logged areas. Report for Rio Bravo Conservation and Management Area. Department of Fish and Wildlife Conservation, 2014; Virginia Tech. Blacksburg, VA. USA.
78. Tobler MW, Hibert F, Debeir L, Richard-Hansen C. Estimates of density and sustainable harvest of the lowland tapir Tapirus terrestris in the Amazon of French Guiana using a Bayesian spatially explicit capture–recapture model. Oryx 2014; 48: 410–419.
79. Thornton D, Zeller K, Rondinini C, Boitani L, Crooks K, Burdett C, et al. Assessing the umbrella value of a range-wide conservation network for jaguars (Panthera onca). Ecological Application 2016; 26: 1112–1124.
80. Pitman RT, Swanepoel LH, Hunter L, Slotow R, Balme GA. The importance of refugia, ecological traps and scale for large carnivore management. Biodiversity and Conservation 2015; 24: 1975– 1987.
81. Boron V, Tzanopoulos J, Gallo J, Barragan J, Jaimes-Rodriguez L, Schaller G, et al. Jaguar Densities across Human-Dominated Landscapes in Colombia: The Contribution of Unprotected Areas to Long Term Conservation. PloS One 2016; 11 e0153973. doi:10.1371/journal.pone.0153973PMID:
27144280
82. Schipper J, Clarke G, Allnutt T. Conservation Planning in a Tropical Wilderness: Opportunities and Threats in the Guianan Ecoregion Complex. 2007; USDA Forest Service Proceedings RMRS-P-49. 83. Rabinowitz A, Zeller KA. A range-wide model of landscape connectivity and conservation for the
jag-uar, Panthera onca. Biological Conservation 2010; 143: 939–945.
84. Gilpin ME. Population viability analysis. Endangered Species Update 1989; 6–10: 15–18. 85. Picard N, Gourlet-Fleury S, Forni E´ . Estimating damage from selective logging and implications for
tropical forest management. Canadian Journal of Forest Research, 2012; 42: 605–613.
86. Peres CA. Effects of Subsistence hunting on vertebrate community structure in Amazonian Forests. Conservation Biology 2000; 14: 240–253.
87. Estes JA, Terborgh J, Brashares JS, Power ME, Berger J, Bond WJ, et al. Trophic downgrading of planet earth. Science 2011; 333: 331–306.
88. Ripple WJ, Estes JA, Beschta RL, Wilmers CC, Ritchie EG, Hebblewhite M, et al. Status and ecologi-cal effects of the world’s largest carnivores. Science 2014; 343: 1241484. doi:10.1126/science. 1241484PMID:24408439
89. Hayward MW, Kamler F, Montgomery RA, Newlove A, Rostro-Garcı´a S, Sales LP, et al. Prey prefer-ences of the Jaguar Panthera onca reflect the Post-Pleistocene demise of large prey. Frontiers in Ecology and Evolution 2016; 3: 148.
90. Garmendia A, Arroyo-Rodrı´guez V, Estrada A, Naranjo EJ, Stoner KE. Landscape and patch attri-butes impacting medium-and large-sized terrestrial mammals in a fragmented rain forest. Journal of Tropical Ecology 2013;, 29:331–344.
91. Caro T, Engili A, Fitzeherbert E, Gardner T. Preliminary assessment of the flagship species concept at a small scale. Animal Conservation 2004; 7: 63–70.
92. Hudson LN, Newbold T, Contu S, Hill SLL, Lysenko I, De Palma A, et al. The PREDICTS database: a global database of how local terrestrial biodiversity responds to human impacts. Ecology and Evolu-tion 2014; 4: 4701–4735. doi:10.1002/ece3.1303PMID:25558364
93. Turner W, Rondinini C, Pettorelli N, Mora B, Leidner AK, Szantoi Z, et al. Free and open-access satel-lite data are key to biodiversity conservation. Biological Conservation 2015; 182: 173–176.
94. Toogood M. Engaging publics: biodiversity data collection and the geographies of citizen science. Geography Compass 2013; 7/9: 611–621.
95. Couvet D, Pre´vot AC. Citizen-science programs: towards transformative biodiversity governance. Environmental Development 2015; 13: 39–45
96. Loos J, Horcea-Milcua AI, Kirkland P, Hartel T, Osva´th-Ferencz M, Fischer J. Challenges for biodi-versity monitoring using citizen science in transitioning social–ecological systems. Journal for Nature Conservation 2015; 26: 45–48
97. Zimmerman NE, Edwards TC Jr, Graham CH, Pearman PB, Svenning JC. New trends in Species Distribution Models. Ecography 2010; 33: 985–989.
98. Moreira-Arce D, Vergara PM, Boutin S, Carrasco G, Briones R, Soto GE, et al. Mesocarnivores respond to fine-grain habitat structure in a mosaic landscape comprised by commercial forest planta-tions in southern Chile. Forest Ecology and Management 2016; 369: 135–143.
99. Vierling KT, Vierling LA, Gould WA, Martinuzzi S, Clawges RM. Lidar: shedding new light on habitat characterization and modeling. Frontiers in Ecology and the Environment 2008; 6: 90–98. 100. Nagendra H, Lucas R, Honrado JP, Jongman RH, Tarantino C, Adamo M, et al. Remote sensing for
conservation monitoring: Assessing protected areas, habitat extent, habitat condition, species diver-sity, and threats. Ecological Indicators 2013; 33: 45–59.
101. Kehl TN, Todt V, Veronez MR, Cazella SC. Amazonian forest deforestation detection tool in real time using Artificial Neural Networks and Satellite Images. Sustainability 2012; 4: 2566–2573.
102. Barbier N, Couteron P, Proisy C, Malhi Y. The variation of apparent crown size and canopy heteroge-neity across lowland Amazonian forests. Global Ecology and Biogeography 2010; 19: 72–84. 103. Hammond DS, Gond V, Baider C, Florens F, Persand S, Laurance S. Threats to environmentally
sen-sitive areas from peri-urban expansion in Mauritius. Environmental Conservation 2015; doi:10.1017/ S0376892914000411