HAL Id: hal-00808527
https://hal.archives-ouvertes.fr/hal-00808527
Submitted on 5 Apr 2013HAL is a multi-disciplinary open access archive for the deposit and dissemination of sci-entific research documents, whether they are pub-lished or not. The documents may come from teaching and research institutions in France or
L’archive ouverte pluridisciplinaire HAL, est destinée au dépôt et à la diffusion de documents scientifiques de niveau recherche, publiés ou non, émanant des établissements d’enseignement et de recherche français ou étrangers, des laboratoires
Spatio-temporal variability in benthic silica cycling in
two macrotidal estuaries: causes and consequences for
local to global studies
Mélanie Raimonet, Olivier Ragueneau, Françoise Andrieux-Loyer, Xavier
Philippon, Roger Kérouel, Manon Le Goff, Laurent Mémery
To cite this version:
Mélanie Raimonet, Olivier Ragueneau, Françoise Andrieux-Loyer, Xavier Philippon, Roger Kérouel, et al.. Spatio-temporal variability in benthic silica cycling in two macrotidal estuaries: causes and consequences for local to global studies. Estuarine, Coastal and Shelf Science, Elsevier, 2013, 119, pp.31-43. �10.1016/j.ecss.2012.12.008�. �hal-00808527�
Spatio-temporal variability in benthic silica cycling in two macrotidal
1
estuaries: causes and consequences for local to global studies
2
3
Mélanie Raimoneta,*, Olivier Ragueneaua, Françoise Andrieux-Loyerb, Xavier Philipponb, Roger 4
Kerouelb, Manon Le Goffa, Laurent Mémerya 5
6
a
Laboratoire des Sciences de l'Environnement Marin LEMAR-IUEM, UMR 6539 CNRS-UBO-7
IRD-Ifremer, Plouzané, France 8
b
DYNECO Pelagos, Ifremer, Plouzané, France 9
ABSTRACT 10
11
The high heterogeneity of silica cycling in coastal margins and the lack of silica data 12
(compared to nitrogen and phosphorus) prevent the estimation of global silica retention in 13
estuaries. In this study, the spatial and temporal variability of pore water silicic acid (Si(OH)4)
14
profiles - that integrate benthic transport and reaction processes - was investigated at different 15
spatial (meter, longitudinal and cross-section, intra-estuary) and temporal (tidal, seasonal) scales 16
in two macrotidal estuaries, very close geographically but differing essentially in their shape. 17
Studying the spatial and temporal variability of Si(OH)4 concentrations in pore waters provided
18
evidence for the importance of transport processes, e.g. bio-irrigation, tidal pumping, 19
resuspension and any combination of these processes, in affecting Si(OH)4 concentrations and
20
fluxes and hence, temporary or permanent retention along the land-ocean continuum. We confirm 21
that aSiO2 transported by rivers and estuaries clearly deserves to be better characterized as it
22
provides an important source of reactive aSiO2 to sediments. This study brings crucial
23
information which allows to (1) deconvoluate spatial and temporal scales, although both are most 24
often in complete interaction, (2) design the most appropriate sampling schemes to be 25
representative of any given system and to extrapolate at the scale of the whole estuary, (3) 26
quantify uncertainty associated to the estimations of Si(OH)4 stocks and fluxes in this type of
27
ecosystem, essential for budget calculations. We showed that two adjacent small macrotidal 28
estuaries, may exhibit different behaviors regarding Si retention. Temporary retention has been 29
observed in the meanders of the Aulne Estuary and not along the more linear Elorn Estuary, 30
demonstrating the importance of the morphology and hydrodynamism component of the estuarine 31
filter. This effort needs to be pursued in other systems and climatic zones, but our study suggests 32
that the typology should not only account for the different types of land-ocean continuum (fjord, 33
delta, mangrove…), but also incorporate the physical or biological attributes of the estuarine 34
filter. 35
36
Keywords: heterogeneity, season, silicate, sediment, land-sea interface, upscaling 37
1. Introduction
38
39
Studying the silica (Si) cycle - and especially estimating the transient and permanent 40
retention of Si - has important ecological and biogeochemical implications at small to global 41
scales. At the local scale, higher Si retention leads to Si limitations and decreasing Si:N and Si:P 42
ratios. These environmental modifications are responsible for shifts in phytoplanktonic 43
communities dominated by diatoms to other species e.g. cyanobacteria or toxic dinoflagellates, 44
which have repercussions on higher trophic levels (Officer and Ryther, 1980; Conley et al., 1993; 45
Howarth et al., 2011). Such Si limitations and eutrophic events have however been prevented by 46
benthic recycling and fluxes associated to transient retention in several estuarine and coastal 47
shallow ecosystems (Yamada and D’Elia, 1984; Ragueneau et al., 2002a; Struyf et al., 2006; 48
Laruelle et al., 2009). At the global scale, permanent retention decreases the export of Si to the 49
ocean, while bioavailable Si has an essential role in enhancing the biological carbon pump by 50
increasing particle sedimentation rate, aggregate formation, and protection from organic matter 51
degradation (Smetacek, 1985; Moriceau et al., 2007; Moriceau et al., 2009). Studying Si cycling 52
along land-sea continuum is particularly essential as coastal margins - including estuaries - must 53
strongly contribute to Si sinking (Bernard et al., 2010). 54
Nevertheless, the heterogeneity of Si cycling is still few quantified from local to global 55
scales (Jansen et al., 2010; Ragueneau et al., 2010; Dürr et al., 2011a; Moosdorf et al., 2011), 56
especially in estuaries (Dürr et al., 2011a). The difficulty in estimating estuarine heterogeneity is 57
related to the high spatial and temporal environmental variability. Estuaries are generally 58
characterized by the most heterogeneous and changing environmental conditions because of 59
numerous external forces and human activities (Nichols et al., 1986; Dalrymple and Choi, 2007). 60
In order to decrease uncertainties in estuaries, heterogeneity must thus be explored. Investigating 61
estuarine heterogeneity is moreover essential to handle research objectives and to design 62
associated sampling schemes (Dutilleul, 1993), to validate interpretations of ecosystem 63
functioning (Livingston, 1987; Hunt et al., 1997) and to ensure the quality of long-term records 64
(Wolfe et al., 1987). In addition to that, these quantifications are necessary to estimate incertitude 65
during downscaling and upscaling, and prevent significant errors incurred by failing to resolve 66
spatial and temporal variation (Swaney and Giordani, 2007; Swaney et al., 2012). 67
The variability of Si cycling, including retention, is strongly controlled by transport and 68
reaction processes. Transport processes are either physical, e.g. deposition and erosion of 69
amorphous silica (aSiO2) (Arndt and Regnier, 2007), or biological, e.g. bioturbation, bioirrigation
70
(Aller, 1980; Berner, 1980), while reaction processes are either chemical, e.g. dissolution and/or 71
reprecipitation of aSiO2 (Berner, 1980; Michalopoulos and Aller, 2004), or biological, e.g.
72
filtration of aSiO2 by benthic filter feeders (Ragueneau et al., 2002a), uptake of dissolved silica
73
(Si(OH)4) by benthic diatoms or sponges (Ni Longphuirt et al., 2009), all these processes
74
depending on environmental factors. Even if the riverine flux of aSiO2 to the ocean has generally
75
been neglected compared to the Si(OH)4 flux (Tréguer et al., 1995), it may constitute some 16-40
76
% of the total Si inputs to estuaries (Conley, 1997; Smis et al., 2010) which may, at least partly, 77
settle in sediments. Depending on watersheds and seasons, estuarine aSiO2 can derive from
78
terrestrial ecosystems, e.g. forest, grassland, wetland, soil (Conley, 2002; Blecker et al., 2006; 79
Gérard et al., 2008; Struyf and Conley, 2009), and/or from diatoms growing in rivers (Conley, 80
1997). 81
The numerous and heterogeneous environmental parameters and processes occurring in 82
estuaries moreover lead to variations of Si stocks and fluxes at different spatial and temporal 83
scales. At small scales, processes such as tidal resuspension or biological activity, lead to hourly, 84
daily, seasonal and spatial variations of benthic Si(OH)4 fluxes (Sakamaki et al., 2006; Ni
85
Longphuirt et al., 2009; Leynaert et al., 2011). At larger scales, annual and regional variations of 86
Si fluxes and retention are generated by different intrinsic properties, e.g. lithology, land cover, 87
climate, runoff (Jansen et al., 2010; Dürr et al., 2011a; Moosdorf et al., 2011), and human 88
activities, e.g. eutrophication, dam building, population density, invasive species (Conley et al., 89
1993; Humborg et al., 1997; Roy et al., 1999; Ragueneau et al., 2002a). 90
The rapid response of estuarine ecosystems to environmental parameter variations makes 91
the characterization of material fluxes (i.e. aSiO2 and Si(OH)4) within the sediment and at the
92
sediment-water interface very difficult (Matisoff et al., 1975; Arndt and Regnier, 2007). 93
Investigating spatial and temporal variations of pore water Si(OH)4 concentrations allows
94
however to integrate benthic process variations related to changing environmental factors. Pore 95
water profiles of Si(OH)4 - or other dissolved metabolites - are then used to estimate
96
biogeochemical rates and fluxes (Khalil et al., 2007; Lettmann et al., 2012). Measurements of 97
pore water Si(OH)4 profiles and their variability is thus useful to evaluate the variability of
98
benthic processes, but also the representativeness and uncertainty of pore water Si(OH)4
99
concentrations in estuarine samplings. 100
The Bay of Brest isan example of a macrotidal system under oceanic climate, 101
downstream of a silicified watershed impacted by strong anthropogenic nitrogen enrichment (Del 102
Amo et al., 1997a). This shallow coastal embayment is characterized by a coastal - biological - 103
silicate pump associated to benthic fluxes (Del Amo et al., 1997b), increased by the presence of 104
benthic filter-feeders which prevent dinoflagellate blooms (Ragueneau et al., 2000; Laruelle et 105
al., 2009). While numerous studies have been performed in the bay, no studies were undertaken 106
on benthic Si cycling in the brackish estuaries. Describing benthic spatio-temporal variability and 107
the main transport and reaction processes involved is then crucial to evaluate the uncertainty 108
associated to benthic processes and fluxes. The two main estuaries flowing into the Bay (e.g. 109
Elorn and Aulne) are very close but characterized by different shapes. They are thus a good 110
example to determine the impact of linear and S-shape morphology on benthic Si cycle. 111
In this study, we investigated spatial and temporal variability of benthic Si(OH)4
112
concentrations in two estuaries at various scales (tide, cross-section, intra-estuary, season). We 113
described and compared the variability of pore water Si(OH)4 concentrations in the two estuaries,
114
and emphasized the main environmental factors, transport and reaction processes explaining this 115
variability. We discussed then the implications of these results for local, regional and global 116
investigations:Does the small scale variability allow studying seasonal and intra-estuary 117
variations? Is the heterogeneity similar between two macrotidal and temperate estuaries? What is 118
the impact on estimations of model uncertainty? 119
2. Material and methods 120 121 2.1. Study site 122 123
The Elorn and Aulne estuaries are located at the interface between their drainage basins 124
and the semi-enclosed Bay of Brest in Northwestern France (Fig. 1). These two estuaries supply 125
up to 85% of fresh water inputs to the Bay of Brest. They are characterized by similar watershed 126
lithology, climate and tidal regime, but have a different size, morphology and land use. The 127
lithology of the two watersheds is similarly dominated by silica-enriched rocks, mainly granite 128
and schist (Lague et al., 2000). The two watersheds are both characterized by intensive 129
agriculture activities. Urbanization is stronger in the Elorn watershed. The oceanic climate of the 130
region generates precipitations of 1145 mm yr-1 (average for the 30-year period 1971-2000; 131
World Weather Organization, http://www.wmo.int). Monthly temperatures for this period ranged 132
from range 6.7 °C in January to 16.8 °C in August. The Aulne watershed is 8 times larger than 133
the Elorn watershed (1822 versus 280 km²). The Aulne River discharge is thus than four times 134
larger than the Elorn River one. The Aulne and Elorn river discharges decrease from winter (42 135
and 189 m3 s-1 in 2009) to summer (1.0 and 1.7 m3 s-1 in 2009; Banque Hydro, 136
http://www.hydro.eaufrance.fr). As for the watershed area, the length of the Elorn Estuary is 137
smaller (~ 15 km) compared to the Aulne Estuary (~ 35 km). The morphology of the Elorn 138
Estuary is straight and more directly exposed to marine hydrodynamic influence, while the Aulne 139
estuary is meandering and more protected by the Bay of Brest. The semi-diurnal tidal amplitude 140
of 4 m (7.5 m during spring tides) in the Bay of Brest results in intense variations of water depth 141
in these shallow estuaries. All these properties, and principally the watershed lithology and the 142
river flow regime, lead to high Si(OH)4 fluxes to the Bay of Brest. Due to a larger drainage basin
143
area and river flow, the Aulne River Si(OH)4 fluxes are generally higher than the Elorn River
144
ones. The relative Si(OH)4 fluxes to the Bay of Brest range from 40% (in summer) to 80% (in
145 winter)1. 146 147 2.2. Sampling design 148 149
Sampling was performed along the Elorn and Aulne estuaries (Fig. 1) in February, May, 150
July, and October 2009. In order to interpret intra-estuary, inter-estuary and seasonal variations, 151
small spatial and temporal variability were investigated first. All the different scales are 152
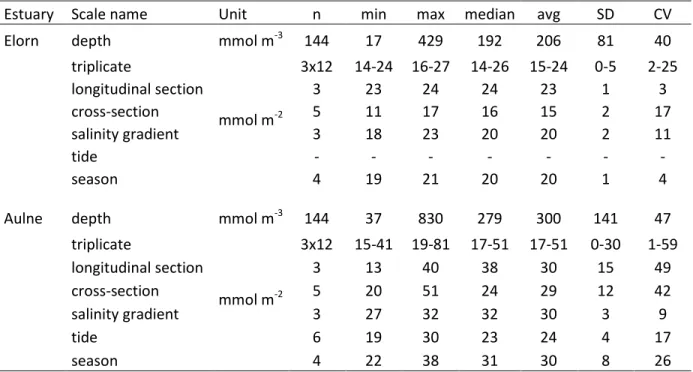
summarized in Table 1. 153
154
2.2.1. Small scale sampling 155
Centimeter scale: Vertical pore water profiles were analysed at a resolution of 0.5 cm in 156
surface to 4 cm at 20 cm-depth in each sediment core. 157
Meter scale: Variability at the meter scale was investigated through the sampling of three 158
cores at each station (E1, E2, E3, A1, A2, A3 and A4) and season (n=3). 159
1 Data not shown. Si(OH)
Longitudinal transect: In both Elorn and Aulne estuaries, longitudinal variations were 160
quantified by sampling sediment cores at three stations located at a same tidal level on the left 161
subtidal shores (stations up, E2/A2, dw) in February 2009 (Fig. 1). Distance between the three 162
stations was 100-1000 m depending on stations. 163
Cross-section: In both estuaries, sediment cores were sampled in the channel (stations c) 164
in February 2009, and at five stations from the left to the right borders (stations E2/A2, b, c, d and 165
e) in May 2009. Cross-section widths were ~75 and ~200 m in intermediate Elorn and Aulne 166
estuaries, respectively. 167
Tide: High-frequency sampling was performed on board the Hésione every 2 h over 12 h 168
in July 2009 in the outer Aulne Estuary (station A4; Fig. 1). 169
170
2.2.2. Intra-estuary, inter-estuary and seasonal sampling 171
Intra- and inter-estuary sampling: Intra- and inter-estuarine variations were investigated 172
by sampling at three stations located in upper (stations E1 and A1), intermediate (stations E2 and 173
A2) and outer (stations E3 and A3) estuaries (Fig. 1). Sampling was always performed at mid-174
tide on subtidal sediments located between the channel and the border. 175
Seasonal sampling: Sampling at the three stations located along each estuary was 176
performed in February, May, July, and October 2009. 177
178
2.3. Sediment and water processings 179
180
Core sampling was achieved using a gravity corer (UWITEC®) with Plexiglas® cores (9.5 181
cm diameter x 60 cm long). Corer weight was adjusted to allow a penetration of 30 cm into the 182
sediment. This gravity corer facilitated acquisition of an undisturbed sediment–water interface. 183
Overlying water temperature and salinity were immediately measured with a salinometer after 184
sampling. Sediment cores were immediately sliced every 0.5 cm in the first 2 cm, every 1 cm 185
down to 4 cm, every 2 cm down to 12 cm, and every 4 cm down to 20 cm. Sediment sections 186
were placed in sealed 50-ml centrifugation tubes containing Vectaspin 20 filters (0.45 µm pore 187
size, Whatman®) as described in Andrieux-Loyer et al. (2008). Interstitial waters were extracted 188
by centrifugation at 3500 rpm for 10 min (2 times) at 4°C. Overlying and pore waters were 189
acidified to pH = 2 with HCl. An aliquot was preserved at 4 °C for analyses of Si(OH)4
190
concentrations. 191
An aliquot of non-centrifuged bulk sediment was stored at 4 °C for less than 15 d for 192
granulometry measurements. Centrifuged sediments were freeze-dried for 48 h, placed at 60 °C 193
to ensure complete sediment dryness, and slightly powdered for further analyses of amorphous 194
silica (aSiO2) concentrations in the solid fraction and dissolution experiments.
195
Surface waters were also collected at 1 m depth along the salinity gradient of the two 196
estuaries. An aliquot of 100-200 ml of surface water was filtered on a polycarbonate filter (0.6 197
µm pore size) and stored at 4 °C until Si(OH)4 measurements. The membrane was dried for 48h
198
at 60°C and stored at room temperature until aSiO2 analyses.
199
2.4. Laboratory analyses 201
202
Sediment grain size analyses were performed with a laser-based particle size analyser (LS 203
Beckman Coulter). 204
Pelagic aSiO2 concentrations were determined by using the sequential alkaline digestion
205
method of Ragueneau et al. (2005) and benthic aSiO2 contents were quantified by using the
206
method of DeMaster (1981). Both methods allowed correcting amorphous silica concentrations 207
from lithogenic silica interference which is essential in environments rich in aluminosilicates - 208
e.g. estuaries. Even if results can be relatively different depending on the extraction method, 209
comparisons of different methods have been performed by Rebreanu (2009) which showed that 210
the method of DeMaster (1981) was particularly suitable in estuarine sediments in the Scheldt 211
continuum. 212
For pelagic aSiO2 concentrations, polycarbonate filters were used for two sequential
213
extractions at pH 13.3 for 40 min. aSiO2 concentrations were calculated with the equation defined
214
by Ragueneau et al. (2005): 215
[aSiO2]corr = [Si]1 – [Al]1×([Si]2/[Al]2)
216
[Si]1 : Si(OH)4 concentrations in supernatant after the first digestion
217
[Al]1 : Al concentrations in supernatant after the first digestion
218
[Si]2 : Si(OH)4 concentrations in supernatant after the second digestion
219
[Al]2 : Al concentrations in supernatant after the second digestion
Triplicate measurements of Al concentrations were performed using the manual fluorescent 221
method, by adding lumogallion which forms a fluorescent complex with Al. Excitation and 222
emission wave lengths are 492 nm and 565 nm, respectively. 223
For the quantification of benthic aSiO2 concentrations, 30 mg of surficial sediments (0-0.5
224
cm) was added to 50 ml of Na2CO3 5% and incubated at 85°C for 6h. At 0.5, 1, 2, 3, 4, 5, 6h, the
225
vials were centrifugated for 15 min at 4000 rpm. 0.5 ml of supernatant was put in 9.2 ml of 226
ultrapure water to prevent problems with the regeant, and neutralized at pH 7 with HCl 10%. The 227
mass pourcentage of aSiO2 was graphically represented as a function of time. According to the
228
DeMaster (1981) method, the content in aSiO2 was given by the y-intercept of the linear part of
229
the plot (after 2h). Note that benthic aSiO2 concentrations are expressed as % in this study to
230
refer to µg gDW-1. 231
Si(OH)4 concentrations were determined with an AutoAnalyzer III (Bran+Luebbe®) using
232
the method of Tréguer and Le Corre (1975). The precision of the analysis was 0.5%. Note that 233
the overall dataset of Si(OH)4 concentrations is available in Annexe.
234
235
2.5. Statistical methods 236
237
All statistical analyses described below were performed with R software (http://cran.r-238
project.org). Before each test, the normality and homoscedasticity of data sets were assessed with 239
the Shapiro-Wilk and Bartlett tests, respectively. Parametric ANOVA and non-parametric 240
Kruskal-Wallis tests were performed to examine station and seasonal differences in 10-cm 241
integrated Si(OH)4 concentrations (SiOH 4 )occurring for longitudinal, cross-section, tidal, 242
and seasonal samplings in the Elorn and Aulne estuaries. Tukey post-hoc tests and multiple 243
comparison tests were performed after ANOVA and Kruskal-Wallis tests, respectively, to 244
identify the significant different groups. The Wilcoxon test was used to find the significant 245
differences in intra- and inter-tidal measurements of SiOH 4 performed in February and July.
246
For all tests, a probability of 0.05 was used to determine statistical significance. 247
The minimum (min), maximum (max) and average (avg) of pore water Si(OH)4
248
concentrations, as well as standard deviation (SD) and coefficient of variation (CV, the standard 249
deviation as a percentage of the mean) were summarized for the different scales investigated in 250
Table 2. Clustering (the Ward method) was used to investigate differences between the sum of 251
squared distances integrated over 10 cm at stations E2 and A2 to compare variations in Si(OH)4
252
profiles at the meter, pluri-meter (longitudinal and cross-section), and seasonal scales. 253
3. Results
254
255
3.1. Benthic variability at small spatial and temporal scales 256
257
3.1.1. Longitudinal transect 258
259
In the intermediate Elorn Estuary, pore water Si(OH)4 profiles were similar at all stations
260
sampled at a same tidal level on the left shore (Fig. 3A). Pore water Si(OH)4 concentrations
261
increased from 80-130 µmol l-1 at the surface to 300-330 µmol l-1 at 20 cm depth. In the 262
intermediate Aulne Estuary, a very different profile was monitored at station A2 with subsurface 263
Si(OH)4 concentrations reaching 580 µmol l-1 (Fig. 3B). With the exception of this distinct
264
profile, pore water Si(OH)4 profiles were similar at all stations sampled on the left shore in the
265
Aulne Estuary. In general, pore water Si(OH)4 concentrations were higher in the Aulne Estuary
266
than in the Elorn Estuary (Table 2, avg) and increased from 110-230 µmol l-1 at the surface to 267
380-560 µmol l-1 at 20 cm depth. The 10-cm integrated Si(OH)4 concentrations (SiOH 4 ) was 268
not significantly different along longitudinal transects than between triplicates in both 269
intermediate estuaries (Table 3). The coefficient of variation (CV) was however very low in the 270
Elorn Estuary (2-3%), but high in the Aulne Estuary (20-49%), regardless of triplicate or 271
longitudinal sampling in intermediate estuaries (Table 2). 272
3.1.2. Cross-section 274
275
In the intermediate Elorn Estuary, pore water Si(OH)4 profiles were similar across the
276
estuarine section (Fig. 3C). Pore water Si(OH)4 concentrations regularly increased from 80-100
277
µmol l-1 at the surface to 250-400 µmol l-1 at 20 cm depth. Slightly higher concentrations were 278
observed at 1-5 cm depth on the right shore (station e) and at 10-20 cm depth on the left shore 279
(station E2). Higher cross-section variations were observed in the intermediate Aulne Estuary 280
(Fig. 3D). As observed in February, pore water Si(OH)4 concentrations reached more than 800
281
µmol l-1 at 3-5 cm depth in May. While pore water Si(OH)4 concentrations were similar at 0-5 cm
282
depth across the section in the intermediate Aulne Estuary, they varied between 100 and 600 283
µmol l-1 down to 5 cm depth. Similar to station E2, the highest concentrations were measured in 284
left and right subtidal shores (400-1000 µmol l-1 at stations A2 and e). SiOH 4 values were not
285
significantly different at the stations of the cross-section and at station E2 in the Elorn Estuary, 286
but were slightly lower at the stations of the cross-section in the Aulne Estuary than at station A2 287
(Table 3). As for the longitudinal transect, the CV was lower in the Elorn Estuary (6-17%) than in 288
the Aulne Estuary (42-59%; Table 2). The CV was slightly higher along the cross-section than on 289
the left subtidal shore in the Elorn Estuary. In the Aulne Estuary, the subtidal shore meter 290
variability at station A2 was even higher than the cross-section variability. 291
Comparisons between channel and subtidal shore Si(OH)4 concentrations in pore waters at
292
different stations and seasons are shown in Fig. 4. Pore water Si(OH)4 concentrations at 0-10 cm
293
depth were lower in the channel than in subtidal shores in both estuaries. In surficial sediments, 294
similar pore water Si(OH)4 concentrations in the channel and the subtidal shore were observed in
295
the intermediate Elorn Estuary in February (Fig. 4A) and Aulne Estuary in May (Fig. 4D). Higher 296
differences in pore water Si(OH)4 concentrations between the channel and the subtidal shore were
297
observed in the intermediate Aulne Estuary in February (Fig. 4B), in the intermediate Elorn 298
Estuary in May (Fig. 4C), and in the outer Aulne Estuary in July (Fig. 4E). A slight but 299
significant correlation was found between pore water Si(OH)4 concentrations and the proportion
300
of fine particles (% < 63 µm) in surficial sediments of the whole dataset (Pearson, r² = 0.35, p < 301 0.0001). 302 303 3.1.3. Tidal variability 304 305
Tidal cycles were visible through increasing salinity and water depth and decreasing 306
bottom water temperature and Si(OH)4 concentrations from low tide to high tide, with the inverse
307
trend until the next low tide (Fig. 5A). In sediments, variations in pore water Si(OH)4
308
concentrations were also observed over tidal cycles (Fig. 5B). Pore water Si(OH)4 concentrations
309
at 0-8 cm depth increased from low to high tide and then decreased until low tide. The CV was 310
high (29-32%; Table 2) and SiOH 4 variations were significant over the tidal cycle (Table 3).
311
312
3.2. Benthic variability at estuarine and seasonal scales 313
3.2.1. Intra- and inter-estuary variations 315
316
Overall pore water Si(OH)4 concentrations were lower in the Elorn Estuary than in the
317
Aulne Estuary (Fig. 6). Deep Si(OH)4 concentrations (at 20 cm depth) slightly increased from
318
upper to outer Elorn Estuary (Fig. 6; E1, E2, E3). Regardless of the season, pore water Si(OH)4
319
concentrations were stable between 0 and 20 cm depth at station E1. At station E2, Si(OH)4
320
profiles were characterized by a depletion at intermediate depths (5-15 cm depth), while at station 321
E3, typical asymptotic Si(OH)4 profiles were observed. No trend was observed however along the
322
Aulne Estuary (Fig. 6; A1, A2, A3). At stations A1, A2 (in July and October) and A3, Si(OH)4
323
profiles exponentially increased with depth, except the very different profiles observed in 324
February and May at station A2 (described in Section 3.1). 325
Despite of higher pore water Si(OH)4 concentrations in the Aulne Estuary, a similar range
326
of pore water Si(OH)4 concentrations was, however, observed at saline stations E3 and A3
(300-327
600 µmol l-1). SiOH 4 values varied between stations and seasons and with the interaction of
328
these two factors (ANOVA; Table 4).Tukey post-hoc tests (not shown) indicated significantly 329
lower SiOH 4 values at stations E1, E2, and E3 than at stations A1 and A2, but no significant
330
differences with station A3. SiOH 4 was significantly lower at station E2 than at E3
(Kruskal-331
Wallis and multiple comparison test), but no spatial differences were observed in the Aulne 332
Estuary. 333
Very high pelagic aSiO2 concentrations were also found in February in upper estuaries
334
(Fig. 7). They ranged between 23-56 µmol l-1 and 28-77 µmol l-1 at salinity 0-5 in the upper Elorn 335
and Aulne estuaries, respectively. 336 337 3.2.2. Seasonal variations 338 339
The lowest seasonal variations in Si(OH)4 profiles were observed in the Elorn Estuary
340
(stations E1, E2, and E3) and at station A3 compared to stations A1 and A2 (Fig. 6). Seasonal 341
variations were not significant in the Elorn Estuary (ANOVA; Table 4). The shape of Si(OH)4
342
profiles however varied at station E2, with an increase of Si(OH)4 depletion depth from May (5
343
cm depth) to October (15 cm depth).In contrast, high and significant seasonal variations of 344
OH 4
Si
were observed in the Aulne Estuary (Kruskal-Wallis; Table 4). At stations A1 and A2, 345
OH 4
Si
values were significantly lower in October than in February and May (Tukey post-hoc 346
test, not shown). 347
348
3.3. Comparison of benthic variation amplitudes at the different scales 349
350
The Fig. 8 shows the similarity and difference between meter, longitudinal, cross-section 351
and seasonal variations of SiOH 4 in intermediate Elorn and Aulne estuaries. In the Elorn
352
Estuary, SiOH 4 measured in February was different from other seasons, but seasonal
353
variability between May, July, and October was low (Fig. 8A). The variability ofSiOH 4 along
longitudinal transect in February was lower than seasonal variations. The low seasonal variations 355
did however not allow to distinguish seasonal and cross-section variations. Even if SiOH 4
356
was similar from May to October, it is important to note that the shape of the profiles were 357
different depending on seasons (Fig. 6). In the intermediate Aulne Estuary, seasonal variations of 358
OH 4
Si
were significant (Table 4) but were lower than triplicate, longitudinal and cross-359
section variability (Fig. 8B). As for the Elorn Estuary, SiOH 4 was different in February
360
compared to the other seasons. One season (May) was characterized by a high dispersion of 361
triplicates in the whole cluster. This heterogeneity was also observed in the cross-section transect, 362
indicating high meter and pluri-meter variability in the intermediate Aulne Estuary. In both 363
estuaries, July and October were individualized with always one replicate more distant from the 2 364
others. 365
4. Discussion
366 367
4.1. Factors controlling the variability of pore water Si(OH)4 concentrations in macrotidal 368 estuaries 369 370 4.1.1. Analytical precision 371 372
The coefficient of variation (CV) of pore water Si(OH)4 concentrations ranges between 1
373
and 59 %, regardless of the scale studied in the Elorn and Aulne estuaries (Table 2). These values 374
are always higher compared to the precision of the analytical method (0.5 %), indicating that 375
variability caused by analytical methods is negligible compared to the field variability. This 376
confirmed the observations made in the Indian River Estuary in Florida, where laboratory 377
variability was 0.3 % while meter benthic heterogeneity reached 40 % (Montgoméry et al., 1979). 378
379
4.1.2. Reaction and transport processes 380
381
Benthic properties controlling asymptotic Si(OH)4 concentrations: Despite variation at the
382
different scales in the Elorn and Aulne estuaries, similar pore water profiles and asymptotic 383
Si(OH)4 concentrations (Figs. 3A and 6-station E2) suggest homogeneous benthic properties at
384
meter and longitudinal scales. The main benthic sediment and pore water properties expected to 385
be homogeneous at a small scale (1-100 m) are pH, aluminium and detrital contents, as well as 386
specific sediment surface area, which are known to strongly control deep pore water Si(OH)4
387
concentrations (Dixit et al., 2001; Dixit and Van Cappellen, 2002). At larger scale (km), the small 388
increase in asymptotic Si(OH)4 concentrations from the upper to the lower Elorn Estuary is
389
consistent with decreasing aluminium and detrital contents in fresh to marine sediments (Hydes 390
and Liss, 1976; Odum, 1984). The low seasonal variations of asymptotic Si(OH)4 concentrations
391
observed in the Elorn Estuary are explained by the relative stability of deep sediment properties 392
compared to surficial ones (Berner, 1980). The low intra-estuary variations and the high seasonal 393
variations in the Aulne Estuary suggest however that benthic variability in deep Si(OH)4
394
concentrations might be less constrained by deep sediment properties than by other processes 395
described below. 396
397
Hydrodynamic regime: The lower pore water Si(OH)4 concentrationsobservedin the
398
channel compared to subtidal shores, especially in the top 5 cm of the sediment (Fig. 4), was 399
explained by sediment resuspension. Wave and tidal currents indeed lead to intense mixing, 400
which strongly enhances diffusive transport and generates low pore water Si(OH)4 concentrations
401
in upper estuarine sediments (e.g. until 3 to 5 cm depth in the Scheldt Estuary; Vanderborght et 402
al., 1977; Rebreanu, 2009).The lowest differences in pore water Si(OH)4 concentrations between
403
the channel and the subtidal shore sediments -and the low CV of SiOH 4 - in May compared
404
to February, can be explained by the lower river discharge which decreases sediment 405
resuspension, and thus prevents the decrease in pore water Si(OH)4 concentrations in the channel
406
in May. Resuspension must have important consequences in increasing Si(OH)4 export to pelagic
407
waters, either through the direct enhancement of benthic fluxes, or through the increase of aSiO2
dissolution by keeping Si(OH)4 concentrations from equilibrium with aSiO2 dissolution.
409
Resuspension thus mainly creates spatial heterogeneity in estuarine areas characterized by high 410
tidal currents, and especially in the channel which leads to potential cross-section heterogeneity. 411
The overall positive correlation between Si(OH)4 concentrations and the proportion of
412
fine particles (% < 63 µm) in surficial sediments (r² = 0.35, p < 0.0001) suggests that lower 413
benthic Si(OH)4 concentrations - and thus aSiO2 concentrations - are associated to coarser
414
sediments, which has already been suggested in the Scheldt Estuary (Rebreanu, 2009). These 415
observations reinforce that sediment redistribution and sorting is important in determining the 416
spatial variability of benthic Si contents. Even if aSiO2 have been deposited with sediment
417
particles - as also observed in intertidal marshes (Struyf et al., 2006) - the low correlation 418
however highlights that other processes than sediment grain size control benthic Si(OH)4
419
concentrations, e.g. aSiO2 quantity and quality.
420
421
Biological processes: In addition to the role of sediment properties and diffusive transport 422
in pore water Si(OH)4 distributions, biological processes (e.g. bioirrigation) play an important
423
role in the modulation of benthic Si(OH)4 concentrations. The exponential increase in pore water
424
Si(OH)4 concentrations - commonly observed in the absence of bioirrigation (McManus et al.,
425
1995) - was consistent with the absence of benthic fauna in the intermediate Aulne Estuary 426
(station A2; Emma Michaud, pers. comm.). A typical example of the role of bioirrigation 427
however occurs in the intermediate Elorn Estuary (station E2; Fig. 6). Pore water Si(OH)4
428
concentrations are characterized by Si(OH)4 depletion in sediments at this station, where the
profiles is typical of sediments where transport processes induced by bioirrigation may overcome 431
the importance of dissolution (Aller, 1980). Regardless the irrigation strategies, these depletions 432
are consistent with the enhancement of diffusive transport of pore waters - which effect is similar 433
to diffusive transport mediated by sediment resuspension - and/or non-local transport of water 434
(Mermillot-Blondin et al., 2005). Modelling the benthic Si cycle at this station (Raimonet, 2011), 435
together with direct identification and measurement of bioirrigation (Michaud et al., in prep) have 436
confirmed the role of benthic fauna in producing these profiles. Bioirrigation often increases 437
sediment oxygenation (Waldbusser et al., 2004), which favours the degradation of benthic 438
organic matter, and in turn, the dissolution of benthic aSiO2. By flushing burrows, bioirrigation
439
prevents the enhancement of pore water concentrations induced by dissolution (Boudreau and 440
Marinelli, 1994). Decreasing pore water Si(OH)4 concentrations - and keeping them away from
441
equilibrium - increases dissolution rates. Bioirrigation thus simultaneously enhances the 442
dissolution of aSiO2 and decreases pore water Si(OH)4 concentrations due to the net export of
443
pore waters to bottom waters. 444
445
Interaction of processes: The different processes described above simultaneously impact 446
benthic Si(OH)4 concentrations, as highlighted in our tidal cycle. Even if tidal variations in pore
447
water Si(OH)4 concentrations are expected to be limited in cohesive sediments - as they are
448
generally dominated by diffusive rather than advective processes (Boudreau, 1997) - changes in 449
Si(OH)4 concentrations were observed over 8 cm depth (Fig. 5). Resuspension - detailed above –
450
is often limited to the first 3-5 cm (Vanderborght et al., 1977; Rebreanu, 2009). Tidal variations 451
observed down to 8 cm depth suggest that either stronger currents are present in subtidal shores 452
(which is not expected in subtidal sediments), or that other processes - detailed above - 453
simultaneously happen. 454
Rapid and deep variations in Si(OH)4 concentrations have already been related to tidal
455
pumping in permeable sandy and coastal sediments, which leads to the vertical transport of pore 456
waters over several centimeters (Shum and Sundby, 1996; Jahnke et al., 2003; Chatelain, 2010). 457
A recent modelling study highlighted that tidal pumping occurs in cohesive sediments, in 458
particular close to the creekbank (Wilson and Morris, 2012). This model was applied to a shallow 459
estuary (< 3 m depth) characterized by a mean tidal amplitude of 1.4 m, confirming that shallow 460
and macrotidal estuaries could be much more impacted by such tidal pumping than expected. 461
Tidal pumping has also been highlighted in macrotidal intertidal mudflats where advective fluxes 462
were 400 times higher than diffusive fluxes when water rose (Leynaert et al., 2011). It is 463
therefore reasonable to attribute the deep variations of pore water Si(OH)4 concentrations over
464
tidal cycles to tidal pumping. 465
Considering that tidal pumping occurs in these muddy sediments, pore water Si(OH)4
466
concentrations are expected to be higher at low tide and not at high tide, as we observe in Fig. 5. 467
The presence of burrows built by benthic fauna is hypothesized to enhance the transport of pore 468
waters and/or bottom waters out and/or into benthic sediments (Aller, 1980; Berner, 1980; 469
Stieglitz et al., 2000). Aller (1980) showed indeed that burrows lead to significant decreases in 470
pore water Si(OH)4 concentrations. Between high and low tides, the flushing of burrows with
471
bottom waters might have led to lower pore water Si(OH)4 concentrations. Localized lower
472
Si(OH)4 concentrations observed at 4, 6, or 8 cm depth (Fig. 5) particularly highlight burrows
473
localized at specific depths, as it has been shown in permeable sediments (Meysman et al., 474
2006). As the Elorn and Aulne estuaries are shallow (< 10 m depth) and characterized by a 475
macrotidal regime, changes in water column height and current speed are very important at tidal 476
scales, strengthening the potential role of tidal pumping and resuspension in bioirrigated 477
sediments of macrotidal estuaries. We hypothesize that these processes significantly control 478
Si(OH)4 concentrations and benthic fluxes (1) at the tidal scale, in particular in shallow
479
macrotidal estuaries, due to wide tidal amplitude, and (2) at the seasonal scale, due to the 480
seasonal variation of benthic macrofauna (maximal activity and biomass during summer) and 481
temperature (maximal production and dissolution in summer). 482
483
Benthic reaction and transport processes and their controlling factors thus play an 484
important role in controlling pore water Si(OH)4 concentrations and their variability at different
485
scales. However, the aSiO2 transported by the river and estuary, as well as the factors that control
486
the area of aSiO2 deposition and their variability, also play a role in the distribution of pore water
487
Si(OH)4 concentrations in estuarine sediments.
488
489
4.1.3. Quantity and quality of aSiO2 inputs
490
491
Up to 80 µmol l-1 of aSiO2 were measured in fresh waters in the upper Aulne Estuary in
492
February (Fig. 7). These concentrations are similar to those of large rivers like the Amazon River 493
(74 µmol l-1) and high compared to most of the rivers (2.9-38 µmol l-1; Conley, 1997; review in 494
Vieillard et al., 2011). This confirms that, although Si has long been thought to flow from rivers 495
mostly in its dissolved form (Tréguer et al., 1995), inputs of Si in the form of particulate 496
amorphous silica (aSiO2) may be significant (Conley, 1997; Smis et al., 2010). The rapid and
497
concave decrease in pelagic aSiO2 concentrations along the salinity gradient highlights a transient
498
increase in aSiO2 concentrations in freshwaters as already demonstrated through a modelling
499
approach (Scheldt Estuary; Regnier et al., 1998), and estuarine deposition of aSiO2 (Danube
500
Delta; Ragueneau et al., 2002b).The high concentration in pelagic aSiO2 and its deposition may
501
explain our observations of these subsurface maxima in the pore waters in the meander of the 502
intermediate Aulne Estuary, as detailed below. 503
504
Control of the hydrodynamic regime on aSiO2 deposition: The high aSiO2 concentrations
505
in the upper Aulne Estuary in February are associated with high winter river discharge, which 506
leads to the downward displacement of fluid muds, associated to the maximal turbidity zone 507
(MTZ; Hermann and Heip, 1999; Meire et al., 2005), close to station A2. The transport of MTZ 508
might lead to the deposition of suspended matter - including aSiO2 - in meanders located close to
509
the MTZ, in the intermediate estuary (this study). River discharge variability - which can be 510
essential in maintaining biodiversity and stability of the ecosystem (Poff, 2009)- is thus also 511
crucial in determining the spatial and temporal variability of sediment deposition, and thus of 512
benthic Si contents. During high river discharge, the quantity of exported particulate matter and 513
aSiO2 is higher and the MTZ moves downward in the estuary, which contributes to the settlement
514
of particles from the MTZ in the meander. 515
The presence of this high subsurface maximum in February and May at station A2, 516
(Fig. 6, station A2). The contribution of groundwater (e.g. Wilson and Morris, 2012) was 518
discarded by constant salinity over sediment depth in February and May. By accumulating 519
sediments, point bars are potential recorders of the seasonality of river and estuarine loads, e.g. 520
aSiO2, organic matter, and other particulate loads, from the watershed, river and estuary.The
521
seasonal evolution of Si(OH)4 profiles highlights deposition and erosion dynamics in point bars.
522
The deepening of the subsurface maximum indicates a deposition rate of ~ 2 cm between 523
February and May (i.e. ~ 0.5-0.6 cm month-1). This rate is particularly high for coastal 524
ecosystems and characteristic of preferential deposition areas (McKee et al., 1983) and consistent 525
with generally favoured deposition in point bars. In July and October, the absence of soft 526
sediments, however, highlights sediment erosion in the point bar between May and July, 527
confirming our hypothesis that transient deposition and erosion events occur at this station. 528
Erosion - which has occurred in late spring (after May), probably after a small storm event in 529
June - indicates that the potential storage of aSiO2 in intermediate point bars can either be
530
translocated, which may have important implications for the ecological functioning of estuarine 531
ecosystems. The highest spatial heterogeneity at a 1-100 m scale, and even at seasonal scales, is 532
moreover observed in the meander, which highlights localized deposition and strong 533
heterogeneity associated to high dynamic regimes. Studying deposition-erosion dynamics in 534
estuaries, and more especially in meanders, is thus essential to investigate transient retentions in 535
estuaries. 536
537
Quality of aSiO2: Seasonal changes in pore water Si(OH)4 concentrations in the point bar
538
of an intermediate estuarine meander also indicate the seasonality of the quality of aSiO2
transported into the estuary. The high subsurface Si(OH)4 concentrations observed at station A2
540
in February and May is most likely due to transient deposition of highly reactive aSiO2 that
541
dissolved quickly in the subsurface sediment layers. Dissolution rates must be high enough to 542
sustain such subsurface maxima. In the Danube Delta (Ragueneau et al., 2002b; Becquevort et 543
al., 2002) or in the Scheldt Estuary (Roubeix et al., 2008), it has been demonstrated that aSiO2
544
dissolution is closely coupled to the microbial degradation of organic matter. Bacteria are very 545
efficient at degrading the organic matrix that is associated with diatom frustules or any other form 546
of aSiO2, exposing the silica surfaces to surrounding waters and thus increasing the dissolution of
547
aSiO2 (Bidle and Azam, 1999). Hence, the effect of bacteria, in particular in the MTZ, has been
548
shown to overwhelm the effect of salinity on dissolution in the MTZ of the Scheldt Estuary 549
(Roubeix et al., 2008). 550
Highly reactive aSiO2 in estuarine sediments in February and May either results from the
551
deposition of (1) a diatom bloom, or (2) allochtonous winter loads. Even if diatoms are often 552
characterized by higher dissolution rates than sedimentary and degraded aSiO2 (Rickert et al.,
553
2002), the deposition of a diatom bloom grown during the previous year is not a likely 554
explanation. A loss in reactivity and solubility of aSiO2 is indeed observed over time due to
555
coatings or detritals in sediments, and leads to lower pore water Si(OH)4 concentrations (Van
556
Cappellen and Qiu, 1997a,b; Rickert et al., 2002). The origin of reactive aSiO2 observed in
557
surficial sediments in the intermediate Aulne Estuary is rather consistent with high pelagic aSiO2
558
concentrations in the upper Aulne Estuary in February, providing evidence of allochtonous aSiO2
559
inputs to the estuary. Loads of aSiO2 after fall may, at least partly, be associated with the export
560
of terrestrial or tidal marsh detritus, such as dead plants or phytoliths (Smis et al., 2010; Querné, 561
2011). As phytoliths have not already suffered dissolution loops, they are generally characterized 562
by higher solubility (Fraysse et al., 2009), and higher dissolution rates than benthic aSiO2
563
(Querné, 2011). 564
Our results point out that riverine aSiO2 can be very reactive and lead to high pore water
565
Si(OH)4 concentrations in local deposition areas. aSiO2 is even shown to be very reactive during
566
winter, while winter dissolution is often assumed to be lower due to the absence of primary 567
production, less bacteria and low temperature limiting biological activities. This reinforces the 568
idea that a better quantitative and qualitative characterization of riverine and estuarine aSiO2 is
569
needed to better understand its fate in estuaries. This will help us in understanding better the 570
temporal and spatial variability of pelagic and benthic properties and processes; such information 571
is crucial when discussing, at different scales, temporary or permanent retention of Si along the 572
land ocean continuum. 573
574
4.2. Implications of this benthic variability for local ecological studies and perspectives for 575
regional and global biogeochemical approaches of Si retention 576
577
This study has different implications from local to global scales, either from the 578
ecological or biogeochemical point of view. At the local scale, sampling at various temporal and 579
spatial scales is not often performed in estuarine studies. It is however essential to study small 580
scale variations as spatial heterogeneities can sometimes prevent to study seasonal trends 581
(Mouret, 2009). The absence of significant differences in pore water Si(OH)4 concentrations
along and across estuarine sections in the linear Elorn Estuary (Table 3) shows that triplicates in 583
subtidal shores are representative of pore water Si(OH)4 concentrations in a section of 100-1000
584
meter scale in small linear estuaries. The coefficient of variation (CV) of pore water Si(OH)4
585
concentrations in the Elorn Estuary (CV of triplicates = 2-25%; Table 2) is in the range of values 586
observed in other estuaries (10-40 %; Matisoff et al., 1975; Montgoméry et al., 1979). The 587
smaller variability of pore water Si(OH)4 concentrations in the Elorn Estuary compared to the
588
Aulne Estuary (1-59%; Table 2) suggests that linear estuaries might have more homogeneous 589
pore water properties, implying that a discrete sampling along the salinity gradient in small linear 590
estuaries is enough to investigate variations along estuarine salinity gradients. 591
The lower variability at meter and plurimeter scales in the linear Elorn Estuary compared 592
to the meandering Aulne Estuary has implications for local or regional modelling studies (e.g. on 593
eutrophication), which use available, and often sparse, data to calibrate and/or validate models. 594
When transposing small spatial variability to data uncertainty, this study highlights that data 595
obtained along salinity gradients of linear estuaries are associated to lower uncertainty (2-25 %) 596
than those of meandering estuaries (1-59 %), providing more confidence in model calibration 597
and/or results in the linear systems. These quantifications are useful to estimate uncertainty 598
during upscaling, but also to prevent significant errors incurred by failing to resolve spatial and 599
temporal variation (Swaney and Giordani, 2007; Swaney et al., 2012). Webster et al. (2000) even 600
highlighted that inappropriate temporal and spatial averaging could lead to errors of up to 30% 601
and 100% in estuarine budgets. 602
The high pore water Si(OH)4 concentrations observed in these estuaries, especially in the
603
upper and intermediate Aulne Estuary, and the transient retention in point bars confirm that 604
continental margins, and more precisely estuaries, constitute significant areas for Si retention. 605
From an ecological point of view, this indicates a potential stock of Si available for recycling and 606
net benthic fluxes of Si(OH)4 to pelagic waters. A rough estimate of the contribution of benthic
607
diffusive fluxes of Si(OH)4 (calculated from diffusive gradients at the sediment-water interface
608
and integrated over the whole estuarine area) to the dissolved Si(OH)4 inputs to pelagic waters
609
varied from < 3 % to > 50 % of the Si(OH)4 flux (i.e. river and benthic flux) in winter and
610
summer, respectively. This confirms that sediments of shallow estuaries are potentially important 611
for pelagic coastal ecosystems, in particular in summer under low river flow conditions. The 612
contribution of benthic recycling to sustain the growth of pelagic diatoms has already been shown 613
in different shallow coastal areas (Yamada and D’Elia, 1984; Struyf et al., 2006), and especially 614
during limiting conditions during summer in the Bay of Brest (Del Amo et al., 1997b; Ragueneau 615
et al., 2002a), where it prevents the development of flagellates (Laruelle et al., 2009). 616
From a regional and global biogeochemical point of view, our study brings new data on 617
the Si cycle, including retention, in two small macrotidal estuaries that belong to the same 618
estuarine type according to most of estuarine typologies (e.g. Dürr et al., 2011b). This study is in 619
line with the approach proposed by Ragueneau et al. (2010), i.e. developing a typology of land-620
ocean continuums and studying Si retention in one type of continuum under different climatic 621
zones, or different types of continuum under the same climatic zone, to derive the most important 622
mechanisms driving Si retention. At this stage, such an effort has been undertaken in regional 623
seas by Meybeck et al. (2007), but it needs to be pursued in other systems (e.g. fjords, deltas, 624
mangroves, etc; Dürr et al., 2011a) as not enough data exist for the Si cycle to do so (Ragueneau, 625
2004). Our study suggests that the concept of typology may have to be refined. Indeed, even if 626
the Elorn and Aulne estuaries belong to the same macrotidal estuarine type (Dürr et al., 2011), the 627
two estuaries show different variability patterns which have implications in terms of Si retention. 628
The higher variability in the Aulne Estuary at various scales (CV; Table 2) confirms that 629
meanders generate heterogeneity in the benthic Si cycle, as well as transient retention, at a small 630
local scale. Such differences have also been observed at the regional scale where Si(OH)4 yields
631
can be different for similar lithology and must be regionally calibrated (Jansen et al., 2010). Thus, 632
estuarine sub-types need to be taken into account in typologies, on the basis of new traits. From 633
this study, meandering could be a useful descriptor, considering that more studies on Si cycle in 634
meanders are first needed to precise the impact of transient and/or permanent Si retention 635
occurring in meandering estuaries. 636
Acknowledgements
637
638
This work was supported by the French National Program for Coastal Environment 639
(PNEC-EC2CO), and the salary of M. Raimonet was funded by the Ministère de l'Enseignement 640
Supérieur et de la Recherche. We gratefully thank the R/V Côtes de la Manche crew, Agnès 641
Youenou, Christophe Rabouille, Bruno Bombled, Julien Quéré, Emma Michaud, Anniet 642
Laverman, Eric Viollier, and Chen Yan for their valuable aid with core sampling and processing, 643
Erwan Amice and Robert Marc for their helpful assistance on board the Hésione (IUEM), and 644
Tualenn Le Roch and Rudolph Corvaisier for their participation in analyses of aSiO2
645
concentrations. We sincerely thank the anonymous reviewers for their very insightful, 646
constructive and detailed comments, and Anniet Laverman for her advices for the manuscript 647
structure, the illustrations and the English language. 648
References
649
650
Aller, R.C., 1980. Quantifying solute distributions in the bioturbated zone of marine sediments by 651
defining an average microenvironment. Geochimica et Cosmochimica Acta 44, 1955-1965. 652
Andrieux-Loyer F., Philippon X., Bally G., Kérouel R., Youenou A., Le Grand J., 2008. 653
Phosphorus dynamics and bioavailability in sediments of the Penzé Estuary (NW France): in 654
relation to annual P-fluxes and occurrences of Alexandrium Minutum. Biogeochemistry 88, 213-655
231. 656
Arndt, S., Regnier, P., 2007. A model for the benthic-pelagic coupling of silica in estuarine 657
ecosystems: sensitivity analysis and system scale simulation. Biogeosciences 4, 331-352. 658
Bassoulet, P., 1979. Etude de la dynamique des sédiments en suspension dans l'estuaire de 659
l'Aulne (rade de Brest). Thèse de doctorat, Université de Bretagne Occidentale, Brest, France, 660
136 pp. 661
Becquevort, S., Bouvier, T., Lancelot, C., Cauwet, G., Deliat, G., Egorov, V.N., Popovichev, 662
V.N., 2002. The seasonal modulation of organic matter utilization by bacteria in the Danube– 663
Black Sea mixing zone. Estuarine Coastal and Shelf Science 54, 337-354. 664
Bernard, C.Y., Laruelle, G.G., Slomp, C.P., Heinze, C., 2010. Impact of changes in river fluxes 665
of silica on the global marine silicon cycle: a model comparison. Biogeosciences 7(2), 441-453. 666
Berner, R.A., 1980. Early diagenesis: a theoretical approach. Princeton University Press, 667
Bidle, K.D., Azam, F., 1999. Accelerated dissolution of diatom silica by marine bacterial 668
assemblages. Nature 397, 508-512. 669
Blecker, S.W., McCulley, R.L., Chadwick, O.A., Kelly, E.F., 2006. Biologic cycling of silica 670
across a grassland bioclimosequence. Global Biogeochemical Cycles 20, GB3023. 671
Boudreau, B.P., 1997. Diagenetic models and their implementation. Modelling transport and 672
reactions in aquatic sediments. Springer-Verlag, Berlin, 414 pp. 673
Boudreau, B.P., Marinelli, R.L., 1994. A modelling study of discontinuous biological irrigation. 674
Journal of Marine Research 52, 947-968. 675
Chatelain, M., 2010. Flux dissous à l'interface eau-sédiment sous des écoulements oscillants. 676
Ph.D. Thesis, Université Pierre et Marie Curie, Paris, 200 pp. 677
Cloern, J.E., 2001. Our evolving conceptual model of the coastal eutrophication problem. Marine 678
Ecology Progress Series 210, 223-253. 679
Conley, D.J., 1997. Riverine contribution of biogenic silica to the oceanic silica budget. 680
Limnology and Oceanography 42(4), 774-776. 681
Conley, D.J., 2002. Terrestrial ecosystems and the global biogeochemical silica cycle. Global 682
Biogeochemical Cycles 16(4), 1121, doi:10.1029/2002GB001894. 683
Conley, D.J., Schelske, C.L., Stoermer, E.F., 1993. Modification of the biogeochemical cycle of 684
silica with eutrophication. Marine Ecology Progress Series 101, 179-192. 685
Dalrymple, R.W., Choi, K., 2007. Morphologic and facies trends through the fluvial-marine 686
transition in tide-dominated depositional systems: A schematic framework for environmental and 687
sequence-stratigraphic interpretation. Earth-Science Reviews 81, 135-174. 688
Del Amo, Y., Le Pape, O., Tréguer, P., Quéguiner, B., Ménesguen, A., Aminot, A., 1997a. 689
Impacts of high-nitrate freshwater inputs on macrotidal ecosystems. I. Seasonal evolution of 690
nutrient limitation for the diatom-dominated phytoplankton of the Bay of Brest (France). Marine 691
Ecology Progress Series 161, 213-224. 692
Del Amo, Y., Quéguiner, B., Tréguer, P., Breton, H., Lampert, L.,1997b. Marine Ecology 693
Progress Series 161, 225-237. 694
DeMaster, D.J., 1981. The supply and accumulation of silica in the marine environment. Geo- 695
chimica et Cosmochimica Acta 45(10), 1715-1732. 696
Dixit, S., Van Cappellen, P., van Bennekom, A.J., 2001. Processes controlling solubility of 697
biogenic silica and pore water build-up of silicic acid in marine sediments. Marine Chemistry 698
73(3-4), 333-352. 699
Dixit, S., Van Cappellen, P., 2002. Surface chemistry and reactivity of biogenic silica. 700
Geochimica et Cosmochimica Acta 66(14), 2559-2568. 701
Dürr, H.H., Meybeck, M., Hartmann, J., Laruelle, G.G., Roubeix, V., 2011a. Global spatial 702
distribution of natural riverine silica inputs to the coastal zone. Biogeosciences 8, 597-620. 703
Dürr, H.H., Laruelle, G.G., van Kempen, C., Slomp, C.P., Meybeck, M., Middelkoop, H., 2011b. 704
Worldwide Typology of Nearshore Coastal Systems: Defining the Estuarine Filter of River 705
Inputs to the Oceans. Estuaries and Coasts 34(3), 441-458. 706
Dutilleul, P., 1993. Spatial Heterogeneity and the Design of Ecological Field Experiments. 707
Ecology 74, 1646-1658. 708
Fraysse, F., Pokrovsky, O.S., Schott, J., Meunier, J.-D., 2009. Surface chemistry and reactivity of
709
plant phytoliths in aqueous solutions. Chemical Geology 258, 197–206.
710
Gérard, F., Mayer, K.U., Hodson, M.J., Ranger, J., 2008. Modelling the biogeochemical cycle of 711
silicon in soils: application to a temperate forest ecosystem. Geochimica et Cosmochimica Acta 712
72, 741-758. 713
Hermann, M.J., Heip, C.H.R., 1999. Biogeochemistry of the MAximum TURbidity Zone of 714
Estuaries (MATURE): some conclusions. Journal of Marine Systems 22(2-3), 89-104. 715
Howarth, R., Chan, F., Conley, D.J., Garnier, J., Doney, S.C., Marino, R., Billen, G., 2011. 716
Coupled biogeochemical cycles: eutrophication and hypoxia in temperate estuaries and coastal 717
marine ecosystems. Frontiers in Ecology and the Environment 9, 18-26. 718
Humborg, C., Ittekkot, V., Cociasu, A., Bodungen, B.V., 1997. Effect of Danube River dam on 719
Black Sea biogeochemistry and ecosystem structure. Nature 386(6623), 385-388. 720
Hunt, R.J., Krabbenhoft, D.P., Anderson, M.P., 1997. Assessing hydrogeochemical heterogeneity 721
in natural and constructed wetlands. Biogeochemistry 39, 271-293. 722
Hydes, D.J., Liss, P.S., 1976. Fluorimetric method for the determination of low concentrations of 723
dissolved aluminium in natural waters. Analyst 101, 922-931. 724
Jahnke, R.A., Alexander, C.R., Kostka, J.E., 2003. Advective pore water input of nutrients to the 725
Satilla River Estuary, Georgia, USA. Estuarine, Coastal and Shelf Science 56, 641-653. 726
Jansen, N., Hartmann, J., Lauerwald, R., Dürr, H.H., Kempe, S., Loos, S., Middelkoop, H., 2010. 727
Dissolved silica mobilization in the conterminous USA. Chemical Geology 270(1-4), 90-109. 728
Khalil, K., Rabouille, C., Gallinari, M., Soetaert, K., DeMaster, D.J., Ragueneau, O., 2007. 729
Constraining biogenic silica dissolution in marine sediments: A comparison between diagenetic 730
models and experimental dissolution rates. Marine Chemistry 106(1-2), 223-238. 731
Lague, D., Davy, P., Crave, A., 2000. Estimating uplift rate and erodibility from the area-slope 732
examples from Brittany (France) and numerical modelling. Physics and Chemistry of the Earth 733
25(6-7), 543-548. 734
Laruelle, G.G., Regnier, P., Ragueneau, O., Kemp, M., Moriceau, B., Ni Longphuirt, S., 735
Leynaert, A., Thouzeau, G., Chauvaud, L., 2009. Benthic-pelagic coupling and the seasonal silica 736
cycle in the Bay of Brest (France): new insights from a coupled physical-biological model. 737
Marine Ecology Progress Series 385, 15-32. 738
Le Corre, P., Tréguer, P., 1975. Manuel d’analyse des sels nutritifs dans l’eau de mer: utilisation 739
de l’auto-analyseur Technicon II. Université de Bretagne Occidentale, Brest. 740
Lettmann, K.A., Riedinger, N., Ramlau, R., Knab, N., Böttcher, M.E., Khalili, A., Wolff, J.-O., 741
Jørgensen, B.B., 2012. Estimation of biogeochemical rates from concentration profiles: A novel 742
inverse method. Estuarine, Coastal and Shelf Science 100, 26-37. 743
Leynaert, A., Ní Longphuirt, S., An, S., Lim, J.-H., Claquin, P., Grall, J., Kwon, B.O., Koh, C.H., 744
2011. Tidal variability in benthic silicic acid fluxes and microphytobenthos uptake in intertidal 745
sediment. Estuarine, Coastal and Shelf Science 95(1), 59-66. 746
Livingston, R., 1987. Field sampling in estuaries: The relationship of scale to variability. 747
Estuaries and Coasts 10, 194-207. 748
Matisoff, G., Bricker, O.P., Holdren, G.R., Kaerk, P., 1975. Spatial and temporal variations in the 749
interstitial waters chemistry of Cheasapeake Bay sediments. In: Church, T.M. (Ed.), Marine 750
Chemistry in the Coastal Environment, American Chemical Society Symposium Series 18. 751
Washington, DC. pp. 343-363. 752
McKee, B.A., Nittrouer, C.A., DeMaster, D.J., 1983. Concepts of sediment deposition and 753
accumulation applied to the continental shelf near the mouth of the Yangtze River. Geology 11, 754
631-633. 755
McManus, J., Hammond, D.E., Berelson, W.M., Kilgore, T.E., Demaster, D.J., Ragueneau, O.G., 756
Collier, R.W., 1995. Early diagenesis of biogenic opal: Dissolution rates, kinetics, and 757