HAL Id: hal-01205515
https://hal.inria.fr/hal-01205515
Submitted on 25 Sep 2015
HAL is a multi-disciplinary open access
archive for the deposit and dissemination of
sci-entific research documents, whether they are
pub-lished or not. The documents may come from
teaching and research institutions in France or
abroad, or from public or private research centers.
L’archive ouverte pluridisciplinaire HAL, est
destinée au dépôt et à la diffusion de documents
scientifiques de niveau recherche, publiés ou non,
émanant des établissements d’enseignement et de
recherche français ou étrangers, des laboratoires
publics ou privés.
A Non-parametric Statistical Shape Model for
Assessment of the Surgically Repaired Aortic Arch in
Coarctation of the Aorta: How Normal is Abnormal?
Jan Bruse, Kristin Mcleod, Giovanni Biglino, Hopewell Ntsinjana, Claudio
Capelli, Tain-Yen Hsia, Maxime Sermesant, Xavier Pennec, Andrew Taylor,
Silvia Schievano
To cite this version:
Jan Bruse, Kristin Mcleod, Giovanni Biglino, Hopewell Ntsinjana, Claudio Capelli, et al.. A
Non-parametric Statistical Shape Model for Assessment of the Surgically Repaired Aortic Arch in
Coarcta-tion of the Aorta: How Normal is Abnormal?. Statistical Atlases and ComputaCoarcta-tional Modeling of the
Heart (STACOM 2015), Oct 2015, Munich, Germany. �10.1007/978-3-319-28712-6_3�. �hal-01205515�
for Assessment of the Surgically Repaired Aortic
Arch in Coarctation of the Aorta:
How Normal is Abnormal?
Jan L. Bruse1, Kristin McLeod2, Giovanni Biglino1, Hopewell N. Ntsinjana1,
Claudio Capelli1, Tain-Yen Hsia1,4, Maxime Sermesant3,
Xavier Pennec3, Andrew M. Taylor1,4, and Silvia Schievano1,4;
MOCHA collaborative group4
1
Centre for Cardiovascular Imaging, University College London, Institute of Cardiovascular Science & Cardiorespiratory Unit,
Great Ormond Street Hospital for Children, London, UK
2
Simula Research Laboratory, Cardiac Modelling Department, Oslo, Norway
3INRIA Sophia Antipolis-M´editeran´ee, ASCLEPIOS Project,
Sophia Antipolis, France
4Modeling of Congenital Hearts Alliance (MOCHA) Group
Abstract. Coarctation of the Aorta (CoA) is a cardiac defect that re-quires surgical intervention aiming to restore an unobstructed aortic arch shape. Many patients suffer from complications post-repair, which are commonly associated with arch shape abnormalities. Determining the degree of shape abnormality could improve risk stratification in recom-mended screening procedures. Yet, traditional morphometry struggles to capture the highly complex arch geometries. Therefore, we use a non-parametric Statistical Shape Model based on mathematical currents to fully account for 3D global and regional shape features. By comput-ing a template aorta of a population of healthy subjects and analyscomput-ing its transformations towards CoA arch shape models using Partial Least Squares regression techniques, we derived a shape vector as a measure of subject-specific shape abnormality. Results were compared to a shape ranking by clinical experts. Our study suggests Statistical Shape Mod-elling to be a promising diagnostic tool for improved screening of complex cardiac defects.
Keywords: Non-parametric Statistical Shape Model, Mathematical Cur-rents, Partial Least Square Regression, Coarctation of the Aorta, Aortic Arch
1
Introduction
Coarctation of the Aorta (CoA) has an incidence of around 1 in 2500 live births [1]. Defined as a discrete or long obstruction of the aortic arch at the transverse, isthmus or descending aorta level, it requires surgery to restore an unobstructed
2 Assessment of Aortic Arch Shape in Coarctation of the Aorta via SSM
arch shape. Although survival rates have improved over the last decades, many patients suffer from late complications post-aortic arch repair such as hyperten-sion, which have been associated with shape abnormalities of the arch [2]. Recent studies therefore suggest long-term follow-up and regular screening via cardiac imaging [1]. Being able to quantify the degree of shape abnormality could be beneficial for such screening procedures as it assists in identifying highly ab-normal cases that are potentially associated with a higher risk profile. Yet, in clinical practice, aortic arch shape is commonly assessed via conventional 2D morphometry – without fully exploiting the shape information provided by cur-rent imaging technology. A multitude of geometric shape parameters is necessary to describe the complex tortuous arches, and landmarks for measuring deviations between shapes are difficult to select. Apart from the inherent measurement bias, such data are rather tedious to interpret and analyse. Statistical Shape Models (SSM) provide a visual, thus intuitively comprehensible tool to assess the en-tire 3D anatomy of a population of shapes [3]. Furthermore, the introduction of mathematical currents of surfaces as non-parametric anatomical shape descrip-tors [4] circumvents the process of landmarking and allows a robust and efficient analysis of shape features in complex shape populations.
In this paper, we aimed to build a SSM based on 3D surface models of aortic arches reconstructed from cardiovascular magnetic resonance (CMR) data in order to quantify the degree of shape abnormality of CoA arch shapes compared to the healthy aorta. The method is based on the forward approach, whereby transformations of an ideal unbiased template shape towards each subject shape within the population encode all global and regional 3D shape information [5], [6]. We hypothesised that by analysing how a template shape of a healthy (not surgically altered) arch transforms towards each CoA arch shape, a shape vector as a subject-specific measure of abnormality can be derived. The shape vector essentially condenses 3D shape features down to a single number for each CoA patient, which allows a ranking of CoA shapes according to their overall shape deviation from the template. This was compared with an expert ranking of shape abnormality performed by three clinical experts, in order to explore to which degree the shape vector reflects the experts’ opinion. Furthermore, we analyse associations between the expert ranking and conventional 2D shape descriptors that are commonly used in clinical practice.
2
Methods
2.1 Patient Population
This is a retrospective study based on a population of 20 healthy Control subjects and 20 age- and body surface area (BSA)-matched patients post-aortic arch repair (CoA) [7]. BSA was calculated using DuBois’s formula [8]. Average age was 15.2±2.0 years (mean±standard deviation) for the Control and 16.5±3.1 years for the CoA group. CoA patients had surgical arch repair four days to five years after birth. Control subjects did not have any intervention on the aortic arch and were considered ”normal” in terms of shape.
2.2 Image Acquisition, Segmentation and Pre-processing of the Surface Models
40 aortas were segmented manually (Mimics, Leuven, Belgium) from whole-heart images acquired during mid-diastolic rest via CMR examination (1.5T Avanto MR scanner, Siemens Medical Solutions, Erlangen, Germany; 3D bal-anced steady-state free precession sequence; voxel size 1.5×1.5×1.5mm)[7]. Seg-mented models were cut at the aortic root and at the level of the diaphragm. Coronary arteries and head and neck vessels were removed. Surface models of the arches were meshed with 0.75 triangular cells/mm2 and smoothed with a
pass-band filter (VMTK, The Vascular Modeling Toolkit, Bergamo, Italy [9]). Prior to computing the template shape, Control arches were rigidly aligned to an initial reference subject from the Control population using an Iterative Closest Point algorithm in VMTK [10]. As conventional 2D morphometric shape descriptors, the coarctation index (CoAi ) and the ratio of arch height A to width T, A/T were measured on CMR images as proposed by Tan [11] and Ou [2], respectively.
2.3 Expert Assessment of the Aortic Arch Shapes
Three clinical experts (radiologist, cardiac surgeon and cardiologist; each with >10 years of experience) qualitatively ranked the CoA shapes according to their distance from a normal arch shape (1=close; 2=fairly close; 3=mid-range; 4=far away; 5=very far away from normal). Control arch shapes were accessible for comparison. The experts assessed the arches’ surface models, merely using a 3D viewer1, without knowing the patients’ clinical history or results of the shape
analysis.
2.4 Computation of the Control Template and its Transformations towards CoA Subject Shapes
The template (i.e. mean shape) of the Control group was computed with the exoshape code framework as proposed by Durrleman [6] and introduced to car-diac research by Mansi [5], using mathematical currents [4] as non-parametric shape descriptors. Based on a forward approach [6], the template T and its transformations ϕi towards each subject shape Tiare computed simultaneously using an alternate two-step algorithm, minimising the distance between the de-formed template ϕi(T ) and Ti in the vector space of currents. The latter is generated by two Gaussian kernels: KW for the shape representations and KV
for the transformations ϕ. The associated kernel widths λW and λV are defined
as the resolution of the currents representation and the stiffness of the defor-mations, respectively [5]. In order to find an adequate set of λ parameters, an initial template of the Control group TControl,initial was computed using
start-ing values of λW,initial=15mm and λV,initial=47mm. As our analyis is based on
1
3D viewable models of the arches available under http://www.ucl.ac.uk/ cardiac-engineering/research/library-of-3d-anatomies/congenital_ defects/coarctations
4 Assessment of Aortic Arch Shape in Coarctation of the Aorta via SSM
analysing transformations that match the Control template with CoA shapes, the final set of λ parameters was obtained by matching TControl,initial with a
specific target shape from the CoA group TCoA,T argeti , while incrementally de-creasing λW,initialand λV,initialuntil the registration error between the deformed
source shape ϕi(TControl,initial) and TCoA,T argeti was reduced by at least 80%.
Being one of the arch models that posed the most challenging shape features to be captured, the CoA subject with the smallest surface area was chosen as Ti
CoA,T arget(CoA3). Prior to the λ estimation, T i
CoA,T argetwas rigidly registered
to TControl,initial. Based on this approach, λW=9mm and λV=44mm were found
to allow sufficient matching of TControl,initialwith TCoA,T argeti and all other
sub-jects, and were used to compute the final Control template TControl,f inal. After
rigidly registering all CoA arch shapes to TControl,f inal, the transformations
ϕi of T
Control,f inal towards each of the CoA subject shapes were computed
using the same set of λ parameters. TControl,f inal was validated using 10-fold
cross-validation [5]. Further, gross geometric parameters of TControl,f inal
(vol-ume V, surface area Asurf, centreline length LCL and median diameter along
the centreline Dmed) were compared to the respective mean values of the Control
population.
2.5 Analysing the Transformations using Partial Least Squares Regression
The transformations ϕ, encoding all shape features present in the population, are parametrised by moment vectors β, which deform TControl,f inaltowards each
subject shape in the space of currents [5]. The moment vectors β, obtained from transforming TControl,f inaltowards all Control and CoA shapes, constituted the
input (predictors) for a Partial Least Squares regression (PLS). PLS extracts shape modes that maximise the covariance of predictors X and response Y [12]. To first extract shape features predominantly related to size differences between subjects, an initial PLS I was performed with all moment vectors β as predictors XI and BSA of the subjects as response YI. A second PLS II was performed
on the predictor residuals of PLS I, XI,resid using the grouping parameter YII
(0 = Control ; 1 = CoA) as response. Residuals were defined as XI,resid = XI−
XSBSA×XLBSAwith XSBSAbeing the predictor scores and XLBSAbeing the
predictor loadings of PLS I. Thereby, dominant shape features related to size differences were removed prior to extracting the shape mode most related to the grouping parameter. Shape modes were computed using the SIMPLS algorithm in Matlab (The MathWorks, Natick, MA) and the mean squared prediction error (MSEP) was estimated using 10-fold cross-validation. Only one PLS I and PLS II mode was retained as MSEP was not substantially decreased by adding more modes. By projecting each subject shape transformation onto the final shape mode PLS II, we derived the shape vector S [5]. It contains subject-specific weights, describing how much the template has to be deformed along the extracted mode in order to match template and subject shape as accurately as possible.
We hypothesised that the weights associated with the final shape mode yield a notion of how distant a specific subject shape is from the Control template shape – with large positive values representing subjects ”far away” and small, negative numbers representing subjects ”close” to the normal arch shape.
Correlations between the subject-specific entries of S, CoAi, A/T and the expert scores were assessed using Kendall’s τ for non-parametric and ranked data. Non-parametric Mann-Whitney-U Test was applied to analyse shape vector differences between the two groups. Consistency between the expert ranking was assessed using the Intraclass Correlation Coefficient (ICC) assuming a 2-way mixed effects model. The significance level was set to p<.05. Statistical tests were carried out in SPSS (IBM SPSS Statistics, Chicago, IL).
3
Experiments and Results
3.1 Control Template
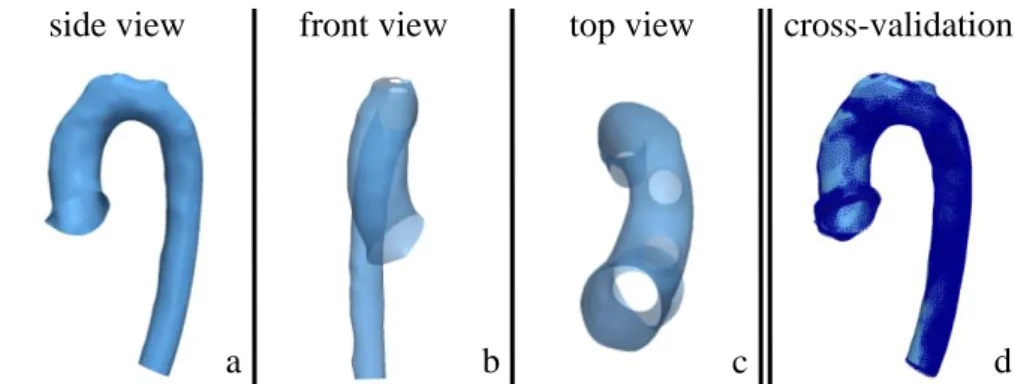
The final Control template showed a smooth, rounded aortic arch with a subtle tapering from ascending to descending aorta (Fig. 1a-c). Gross geometric pa-rameters were close to their respective means measured on the entire Control population. Deviations ranged from 0.3% (volume) to 1.94% (median diameter), resulting in an overall average deviation of 1.02%. Cross-validation revealed that the template shape was not substantially influenced by removing specific sub-jects from the analysis (Fig. 1d). Average surface distances between the full dataset shape and the reduced dataset shapes ranged from 0.14 to 1.22mm.
side view
front view
top view
cross-validation
a
b
c
d
Fig. 1: Computed template shape of the Control population (a-c) and overlay of cross-validated template shapes based on reduced datasets (d, dark blue)
3.2 PLS Regression Results
PLS I extracted shape features most related to BSA such as overall differences in size between subjects. The model yielded a good fit of BSA based on the derived PLS I shape mode (r=0.70; p≤.001), which accounted for 18% of shape variability. PLS II derived shape features most related to either the Control or the CoA group. The PLS II shape mode accounted for 21% of the remaining shape variability.
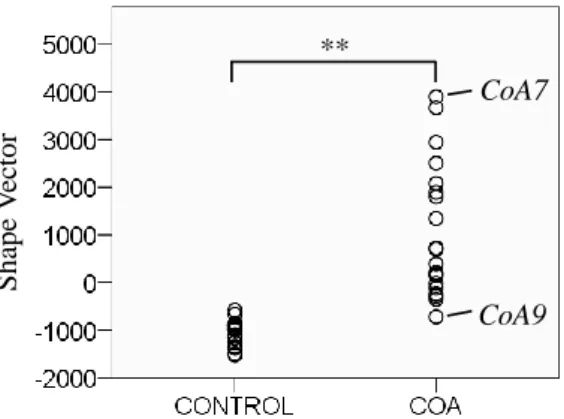
6 Assessment of Aortic Arch Shape in Coarctation of the Aorta via SSM S ha pe V ec tor CoA7 CoA9 **
Fig. 2: PLS II shape vector results for Control and CoA group. Extreme subjects marked
The PLS II shape mode weights of Control subjects clustered closer together (-1036±252; mean±standard deviation), whereas weights derived for CoA sub-jects showed a larger spread (1036±1396), related to more shape variability within the CoA group. The distribution of shape vector values was significantly different (p≤.001) between the two groups (Fig. 2). Control subjects were as-sociated with weight values between -1521 and -581; CoA subjects ranged from -721 to +3897 (Fig. 3).
CoA9 CoA11 CoA12 CoA6 CoA1 CoA3 CoA8 CoA4 CoA2 CoA16
CoA5 CoA19 CoA10 CoA18 CoA14 CoA17 CoA13 CoA20 CoA15 CoA7
close to normal: -721
far away from normal: +3897
Fig. 3: Computed ranking of CoA arch shapes from normal (low shape vector values) to abnormal (high shape vector values)
3.3 Comparison of Expert Ranking with Shape Model Results Qualitative shape rankings were consistent for experts 1 and 2 (mean scores 2.65 and 2.60), while expert 3 on average ranked CoA shapes farther away from normal (mean score 3.40). However, all experts applied a similar range of scores (all standard deviations 1.04).
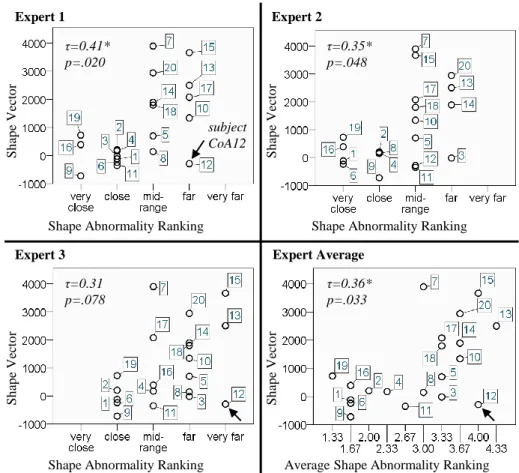
Average ranking was reliable with ICC=0.88 (p≤.001). Conventional shape descriptors CoAi and A/T did not correlate with the experts’ ranking (Table 1). Expert shape scores correlated well with the computed shape vector for experts 1 and 2, and less for expert 3 (Fig. 4). Average expert ranking however, showed good correlation (Kendall’s τ =0.36, p=.033).
Table 1: Correlations between expert ranking and conventional 2D shape descriptors
Expert 1 Expert 2 Expert 3 Average
τ Significance τ Significance τ Significance τ Significance CoAi -0.11 p=.520 -0.04 p=.838 -0.22 p=.222 -0.11 p=.533
A/T 0.18 p=.919 0.13 p=.453 0.02 p=.892 0.06 p=.718
Expert 1 Expert 2
Expert 3 Expert Average
Shape Abnormality Ranking Shape Abnormality Ranking
Shape Abnormality Ranking Average Shape Abnormality Ranking
S h ap e V ec to r S h ap e V ec to r S h ap e V ecto r S h ap e V ecto r τ=0.41* p=.020 τ=0.35* p=.048 τ=0.31 p=.078 τ=0.36* p=.033 subject CoA12
Fig. 4: Correlations between expert ranking of shape abnormality and computed shape vector values: Apart from the mid-range, trends were captured well. Outlier marked
8 Assessment of Aortic Arch Shape in Coarctation of the Aorta via SSM
4
Discussion and Conclusion
In this paper we analysed the transformations of a ”normal” template aorta shape towards surgically repaired CoA arch shapes via PLS, in order to derive a subject-specific measure of shape abnormality. Particularly in the extreme cases of CoA shapes being either close or far away from normal, the derived shape vector reflected the expert ranking well. In the mid-range however, our method struggled to differentiate expert scores sufficiently. In particular one sub-ject (CoA12) contributed to weak correlations between shape vector and expert rankings (Fig. 4). With a severe transverse narrowing and a highly localised in-dentation, subject CoA12 presents sophisticated shape features to be captured (Fig. 3). A decrease of the λ parameters might improve the method’s accuracy – though at the expense of computation time. The main limitation of our study is the small sample size for both groups, which impeded applying more elaborate statistics and which should be addressed in future studies.
Interestingly though, the derived shape vector seemed to reflect the experts’ shape assessment better than conventional 2D arch shape descriptors as typically used in clinical practice. This suggests Statistical Shape Modelling on 3D shapes to account for more relevant shape information and thus to come closer to an intuitive human shape assessment. Ultimately, applying Statistical Shape Models for clinical decision support could lead to more robust, efficient and objective diagnosis and risk stratification strategies in complex cardiac disease.
Acknowledgments. This study is independent research by the National In-stitute for Health Research Biomedical Research Centre Funding Scheme. The views expressed in this publication are those of the author(s) and not necessarily those of the NHS, the National Institute for Health Research or the Department of Health. The authors gratefully acknowledge support from Fondation Leducq, FP7 Integrated Project MD-Paedigree, National Institute of Health Research, Commonwealth Scholarship Comission and Heart Research UK.
References
1. Brown, M.L., Burkhart, H.M., Connolly, H.M., Dearani, J.A., Cetta, F., Li, Z., Oliver, W.C., Warnes, C.A., Schaff, H.V.: Coarctation of the Aorta: Lifelong Surveil-lance Is Mandatory Following Surgical Repair. Journal of the American College of Cardiology. 62, 1020–1025 (2013).
2. Ou, P., Bonnet, D., Auriacombe, L., Pedroni, E., Balleux, F., Sidi, D., Mousseaux, E.: Late systemic hypertension and aortic arch geometry after successful repair of coarctation of the aorta. Eur. Heart J. 25, 1853–1859 (2004).
3. Young, A.A., Frangi, A.F.: Computational cardiac atlases: from patient to popula-tion and back. Exp Physiol. 94, 578–596 (2009).
4. Vaillant, M., Glaun`es, J.: Surface Matching via Currents. In: Christensen, G.E. and Sonka, M. (eds.) Information Processing in Medical Imaging. pp. 381–392. Springer Berlin Heidelberg (2005).
5. Mansi, T., Voigt, I., Leonardi, B., Pennec, X., Durrleman, S., Sermesant, M., Delingette, H., Taylor, A.M., Boudjemline, Y., Pongiglione, G., Ayache, N.: A Sta-tistical Model for Quantification and Prediction of Cardiac Remodelling: Applica-tion to Tetralogy of Fallot. IEEE TransacApplica-tions on Medical Imaging. 30, 1605–1616 (2011).
6. Durrleman, S., Pennec, X., Trouv´e, A., Ayache, N.: Statistical models of sets of curves and surfaces based on currents. Medical Image Analysis. 13, 793–808 (2009). 7. Ntsinjana, H.N., Biglino, G., Capelli, C., Tann, O., Giardini, A., Derrick, G., Schievano, S., Taylor, A.M.: Aortic arch shape is not associated with hyperten-sive response to exercise in patients with repaired congenital heart diseases. Journal of Cardiovascular Magnetic Resonance. 15, 101 (2013).
8. DuBois D. and E.: The measurement of the surface area of man. Archives of Internal Medicine, 15(5) (1915).
9. Antiga, L., Piccinelli, M., Botti, L., Ene-Iordache, B., Remuzzi, A., Steinman, D.A.: An image-based modeling framework for patient-specific computational hemody-namics. Med Biol Eng Comput. 46, 1097–1112 (2008).
10. Besl, P.J., McKay, N.D.: A method for registration of 3-D shapes. IEEE Transac-tions on Pattern Analysis and Machine Intelligence. 14, 239–256 (1992).
11. Tan, J.-L., Babu-Narayan, S.V., Henein, M.Y., Mullen, M., Li, W.: Doppler Echocardiographic Profile and Indexes in the Evaluation of Aortic Coarctation in Patients Before and After Stenting. Journal of the American College of Cardiology. 46, 1045–1053 (2005).
12. Singh, N., Thomas Fletcher, P., Samuel Preston, J., King, R.D., Marron, J.S., Weiner, M.W., Joshi, S.: Quantifying anatomical shape variations in neurological disorders. Medical Image Analysis. 18, 616–633 (2014).