HAL Id: hal-01516871
https://hal.archives-ouvertes.fr/hal-01516871
Submitted on 10 May 2017
HAL is a multi-disciplinary open access
archive for the deposit and dissemination of
sci-entific research documents, whether they are
pub-lished or not. The documents may come from
teaching and research institutions in France or
L’archive ouverte pluridisciplinaire HAL, est
destinée au dépôt et à la diffusion de documents
scientifiques de niveau recherche, publiés ou non,
émanant des établissements d’enseignement et de
recherche français ou étrangers, des laboratoires
Financial Inclusion and Firms performance
Lisa Chauvet, Luc Jacolin
To cite this version:
Lisa Chauvet, Luc Jacolin. Financial Inclusion and Firms performance. Séminaire Banque de France
/ Ferdi, May 2015, Paris, France. pp.24. �hal-01516871�
Financial inclusion and firms performance
Lisa Chauvet
∗Luc Jacolin
†May 11, 2015
Abstract
This study focuses on the impact of financial inclusion and financial development on the performance of firms in countries with low financial development. Previous studies focusing on financial depth alone find that financial development does not affect, or has a negative effect on, economic growth in developing countries with undersized financial systems. Using firm-level data in panel for a sample of 26 countries, we find that this hypothesis is invalidated if one takes into account not only financial depth but also financial inclusion, i.e. the distribution of access to financial services. Contrary to developed countries where financial inclusion is nearly universal, differences in access to credit among firms help explaining differences in firms perfor-mance. We measure financial inclusion as the share of firms who have access to bank overdraft facilities, or, alternatively, to any external source of financing, at the sectoral level. We find that whereas financial devel-opment does not affect firm performance on average, financial inclusion has a positive effect on firms growth. Where financial inclusion is low, financial development may create crowding out effects in favor of a minority of firms or government that phase out or reverse its expected positive effects of financial development on growth. Additional testing show that these effects affect all firms, irrespective of size, or whether they have access to bank credit or not. We interpret these results as showing that financial deepening increases firms growth only if it widely distributed among firms, i. e. financial inclusion is high.
Keywords: Financial development. Financial inclusion. Firms peformance.
JEL codes: G10, O16, O50
∗(1) IRD, LEDa, DIAL UMR 225, Banque de France, PSL, Universit ˜A c Paris-Dauphine, FERDI. †Banque de France.
1
Introduction
This article examines the impact of financial inclusion, defined as effective use of formal financial services, on the growth of sales, labor productivity and exports of firms in countries with low financial development. Since the early 1990s, a string of theoretical and empricial research has shown the existence of a positive relationship between financial development, firms performance and economic growth, most notable by im-proving the section of innovative and productivity-enhancing investment projects (King and Levine, 1993), by reducing transaction costs, and more generally by improving the allocation of capital and risk management. This relationship may be channeled either through financial intermediaries or financial markets (Holmstrom and Tirole, 1997), via traditional intermediation, measured usually by financial depth indicators, or by the provision of products and services that help reduce transaction costs and manage risks (Beck, Degryse, and Kneer, 2014).
Other works have emphasized the importance of the financial system in reducing asymmetric shocks and growth volatility by helping smooth private investment (Aghion et al., 2010) or reducing the effects of exchange rate fluctuations (Aghion et al., 2009). Due to the probably endogenous and dynamic nature of the finance-economic activity nexus, causal inference remains however is difficult to disentangle and an object of debate and, according to some economists, should not be overplayed to leave room for a case by case approach (Rodrik and Subramanian, 2009).
Especially since the Great 2009 Recession and financial crisis, economic research has focused on the possibility of a non-linear relationship between economic activity and financial development, especially in developed countries where large financial sectors in developed countries may face diminishing returns (Philip-pon and Reshef, 2013), subtract resources from other productive sectors (Deidda, 2006) or increasing the volatility of economic activity because of financial crises (Easterly, Islam, and Stiglitz, 2001; Loayza and Ranciere, 2006). In developed countries, empirical estimations thus show that, above thresholds ranging from 80 to 110% of private credit/GDP, the positive finance/growth link vanishes and a case for ”too much finance” may be made (Arcand, Enrico, and Panizza, 2012; Panizza, 2012).
Turning to developing countries, a first question has been, conversely, to determine whether there is a case for ”not enough finance”, where undersized financial sectors, usually bank-led with little or no financial markets development, play virtually no role in boosting economic growth, let alone corporate growth and productivity (Henderson, Papageorgiou, and Parmeter, 2013; M´eon and Weill, 2010; Deidda and Fattouh, 2002). Rioja and Valev (2004) find that countries with low financial development, that is countries with credit/GDP lower than 14%, financial development has little effect on economic growth. Several authors point
out that specific weaknesses of developing countries, such as poor institutions (Demetriades and Hook Law, 2006), insufficient financial competition due to political deadlock (Rajan and Zingales, 2003) high inflation (Rousseau and Wachtel, 2002) may dampen or suppress the finance-growth relationship. Other authors question a one-size-fits-all approach and recommend country specific policies, notably according to their level of development.
In developing countries, where financial depth or size (Credit or liquidity/GDP) may not be large enough to yield its expected economic benefits, a question of interest may be whether accounting for the quality of financial development may add to the story beyond caveats resulting from the large size of the informal sector (Gu´erineau and Jacolin, 2014). The international agenda has brought to light recently the significant role played by financial inclusion, that is the extent to which households or firms have access to financial products and services. In addition to supply-side indicators of access to finance such as branch density, the number of ATM or, more recently, market penetration of mobile phones as a proxy for the market of mobile banking, consensus has been found to measure financial inclusion at the international level by the share of households or firms that have access to financial services (GPFI, 2013) and is now regularly surveyed by international organizations (IMF Financial Access Survey, Findex database).
Abdmoulah and Jelili (2013) shows for example that non linearities between growth and financial de-velopment can be explained by access to finance, measured by a density of branches, acting as a regime switching-trigger. In the line of cross country studies that show that financial development contributes to economic development by reducing individual income inequalities and other poverty indicators (Beck, Demirg¨u¸c-Kunt, and Levine, 2007), single-country studies also show that financial inclusion is a factor of faster growth of the poorest segments of the population in low income countries (Burgess and Pande, 2005). In the case of households, opening a bank account may by itself increase economic efficiency and economic growth, whereas the impact of household credit on growth may depend mainly on whether it finances im-mediate consumption, or durable goods (GPFI, 2013).
Some studies find that the impact of financial inclusion on growth is found to hinge on firm access to credit rather than household (Beck et al., 2008). Most notably by reducing the ”financing gap” faced by for small or medium sized firms or industries (GPFI, 2011), financial inclusion reduces liquidity constraints, encourages investment and has therefore important effects on industrial structure, firm size, competition, activity in the informal sector vs the formal, particularly in low income countries (Beck, Demirguc-Kunt, and Maksimovic, 2005).
external finance to firms and that firms in sectors with high capital needs grow faster in counties with easier access to financial markets. Conversely, firms in sectors with high external needs tend to fare worse in countries subject to financial crises (Kroszner, Laeven, and Klingebiel, 2007). Raddatz (2006) focuses on the role of the financial system in stabilizing the output of firms, particularly with high liquidity needs, while H´ericourt and Poncet (2013) shows how financial access dampens the negative impact of exchange rate volatility on firms exports. Using large cross-country, firm-level data from the enterprise survey, Berman and H´ericourt (2010) finds that access to finance affects both the decision to export by firms and the amount exported. Focusing on Africa Harrison, Lin, and Xu (2014) show that a wide array of firm performance, sales growth, productivity, investment rate and export intensity are affected not only by already well-researched weaknesses in business and political infrastructure and infrastructure, but also by financial access.
Our research therefore builds on this existing literature to try and determine whether taking into account access to credit by firms sheds new light on the impact of the financial sector on firm performance, and uncovers a significant channel by which financial development may affect economic growth. Contrary to most studies on emerging and developed countries, this study is interested in showing the specific impact of financial inclusion in countries with low financial development.
In countries characterized by low financial depth, where most research finds financial development is too limited to make a positive impact on growth, we show that access to credit by a larger portion of firms affects firm performance (growth, productivity, exports) and is the main channel by which finance impacts economic growth. This has important repercussions in designing public policies favoring financial development in countries with low levels of financial development. It suggests that policies increasing public access to financial products and services may be as instrumental for firm performance and economic development as the promotion of financial markets or financial deepening alone.
2
Model
In this article, we explore the role of financial development and financial inclusion for firms performance. Typically, the combination of poor financial infrastructure, significant information asymmetries on SMEs and unfavorable business climate and governance results in constraining credit, hence growth, productivity, and investment of firms. In some countries with low financial development, a deepening of financial development may go hand in hand with a higher concentration of credit portfolio on a few large firms or on government, hence crowding out the remaining small firms from the industry. We will therefore look at how the countries
average financial inclusion affects growth performance. We will also explore whether the impact of financial development on firms performance depends on the level of financial inclusion.
The first step of our econometric analysis is to estimate the impact of financial development on firms per-formance. Following Rajan and Zingales (1998), we estimate an econometric model of the following general specification:
GROW T Hi,k,j,(t,t−3)= α + βXi,k,j,t+ γYj,(t,t−3)+ δF IN DEVj,(t,t−3)
+λIN CLU SIONk,j,t+ θF IN DEVj,(t,t−3).IN CLU SIONk,j,t+ µi+ τk,t+ εi,k,j,t
(1)
where GROW T Hi,k,j,(t,t−3) is sales growth of firm i, in industry k, country j. The growth rates are
computed over three year, between t and t -3. Xi,k,j,t is a set of time-varying firm-level characteristics,
including the initial value of sales. Yj,(t,t−3) is a set of country-level variables measured on three-year
averages over with the growth rate of firms is computed, or lagged three years. Yj,(t,t−3) includes country
size, income per capita (lagged), and growth rate (lagged), as well as an indicator of control of corruption.1
Equation 1 also accounts for firms fixed effects, µi, as well as industry x year dummies, τk,t, which are
included to account for time-varying heterogeneity within industries.
Our model includes the interaction term of financial development (measured at the country-level), F IN DEVj,(t,t−3), with the industry-level measure of financial inclusion, INCLUSIONk,j,t. This
interac-tion term is meant to examine how financial inclusion influences the impact of financial development on firms performance. In developing countries with limited access to credit, a more widespread access to credit, i.e. an increase in the share of firms using credit may be as important as financial depth to boost firm performance (complementarity of financial development and financial inclusion). A deepening of the finan-cial development may also not systematically be consistent with the financing constraint being relaxed. It may well be the case that the biggest firms (and/or government) benefit from financial development, hence crowding out smaller firms from the industry. This point was earlier made by Harrison and McMillan (2003) in the case of Cˆote d’Ivoire where foreign owned firms tend to crowd out domestic firms from access to finance.
3
Data
In order to estimate equations 1, we combine country-level financial characteristics with firm-level character-istics, for a panel of 29 developing countries. We stacked firm-level panel data of the World Bank Enterprise Surveys (WBES). Our sample is composed of almost 5,000 firms in 29 developing and emerging countries for two points in time. The sample of countries, years and firms is presented in Appendix 1. We did not consider surveys from Angola (2006, 2010), the Democratic Republic of Congo (2006, 2010), and Afghanistan (2005, 2009) since these three countries experienced violent events which make them hardly comparable with the rest of the countries.
3.1
Firm-level panel data
After harmonization across countries of the firm-level panel dataset, the data in local currencies have been deflated using the same base year (100 = 2005), and converted into US dollars. GDP deflators and exchange rates are obtained from the IMF’s International Financial Statistics (IFS). Each survey of the WBES include information on the sales in the year preceding the survey, as well as three years before. This allows us to compute the growth rate of sales over three years for each survey available.2 We rely Beck, Demirguc-Kunt,
and Maksimovic (2005) and Harrison, Lin, and Xu (2014) and account for the following firms characteristics:
• GROWTHi,k,j,(t,t−3): Growth rate of the sales of the firm computed between t and t-3. Sales are
deflated and converted into US dollars.
• SALESi,k,j,t−3: Logarithm of the lagged sales. It is most of the time measured in t-3, with some
exceptions. Sales are converted into US dollars and deflated.
• SIZEi,k,j,t: Categorical variable which is equal to one when the firm is small, i.e. less than 20 employees,
two when it has between 20 and 100 employees, and three when it is large (more than 100 employees).
• FOREIGNi,k,j,t: Dummy variable which is equal to one when part of (or all) the firm is owned by
foreign individual or company.
• STATEi,k,j,t: Dummy variable which is equal to one when part of (or all) the firm is owned by the
State.
2For some countries the time span is slightly different, depending on the years for which the questions have been asked. For
example, the growth rate of sales covers four years for Botswana and Mali in period 1, Brazil, Pakistan, Senegal, South Africa and Zambia in period 2. It is calculated over two years for Niger in period 1.
• EXPORTi,k,j,t: Dummy variable which is equal to one when the firm is exporting part of its production
either directly, or indirectly (supplier of and exporting firm).
• OVERDRAFTi,k,j,t: Dummy variable which is equal to one when the firm has an overdraft facility.
We will alternatively use OVERDRAFTi,k,j,t or ACCESSi,k,j,t. ACCESSi,k,j,t is equal to one when
the firms has an overdraft facility, or finances part of its long term investment using other sources of external funding (other bank credit, supplier credit, . . . ).
Table 1 presents the basic descriptive statistics. Our sample of firms is mostly composed of large formal firms. Thirty percent of them is outward-looking, exporting either directly or indirectly. Respectively twelve and one percent is partly or fully foreign or state owned. Sixty-three percent of firms in our sample have been granted an overdraft facility, with an additional 8 percent using other forms of external financing, confirming that access to overdraft facilities represents the first and main step towards financial inclusion for firms in developing and emerging countries.
Table 1: Summary statistics.
Variables N mean sd min max
Firm-level variables
GROWTHi,k,j,(t,t−3) 9,739 0.08 0.35 -1.00 4.45
SALESi,k,j,t−3 logarithm 9,739 13.64 2.54 5.23 28.80
SIZEi,k,j,t dummy 9,739 1.91 0.78 1 3
STATEi,k,j,t dummy 9,739 0.01 0.08 0 1
FOREIGNi,k,j,t dummy 9,739 0.12 0.32 0 1
EXPORTi,k,j,t dummy 9,739 0.35 0.48 0 1
OVERDRAFTi,k,j,t 9,739 0.63 0.48 0 1 ACCESSi,k,j,t 9,739 0.71 0.45 0 1 Country-level variable FINDEVj,t 58 0.31 0.26 0.05 1.27 INCOMEj,(t−3,t−6) 58 7.40 1.15 5.27 9.51 GDP GROWTHj,(t−3,t−6) 58 -0.01 0.08 -0.35 0.10 CORRUPTIONj,(t,t−3) 58 -0.32 0.66 -1.44 1.38 POPULATIONj,(t,t−3) 58 16.53 1.32 13.05 19.05 Country-Industry-level variable INCLUSIONj,k,t 619 0.58 0.28 0 1 INCLUSION2j,k,t 619 0.67 0.25 0 1
3.2
Country-level variables
The estimations control for a large array of country-level time-varying factors. The following variables are included:
• GDP GROWTHj,(t−3,t−6): Average annual growth rate of country j, lagged one period.
• INCOMEj,(t−3,t−6): Logarithm of income per capita, lagged one period.
• POPULATIONj,(t,t−3): Logarithm of population of country j.
• CORRUPTIONj,(t,t−3): Indicator of the control of corruption.
Financial development, FINDEVj,(t,t−3), is averaged over the period on which the growth of firms’ sales
is computed for each country. It is defined as the share of private credit from financial banks and other financial institutions in GDP.
Table 1 presents some descriptive statistics of the variables used in our model. On average financial de-velopment represents 31% of GDP. Our sample of countries gathers countries with low financial dede-velopment (less than 10%), and others where the financial sector never represents more than 50% of GDP. Table 2 illustrates the large variance across countries of FINDEVj,(t,t−3).
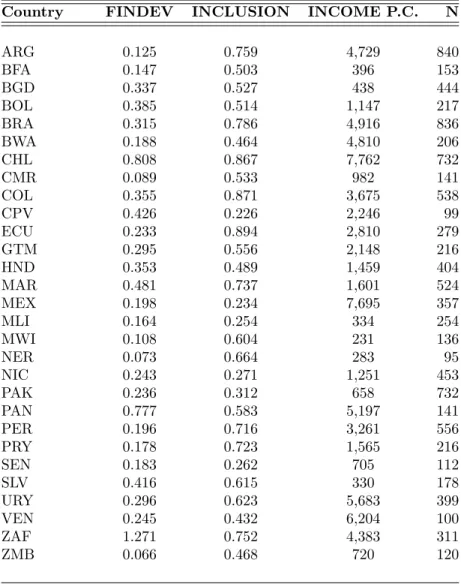
Table 2: Mean financial development and inclusion by country.
Country FINDEV INCLUSION INCOME P.C. N
ARG 0.125 0.759 4,729 840 BFA 0.147 0.503 396 153 BGD 0.337 0.527 438 444 BOL 0.385 0.514 1,147 217 BRA 0.315 0.786 4,916 836 BWA 0.188 0.464 4,810 206 CHL 0.808 0.867 7,762 732 CMR 0.089 0.533 982 141 COL 0.355 0.871 3,675 538 CPV 0.426 0.226 2,246 99 ECU 0.233 0.894 2,810 279 GTM 0.295 0.556 2,148 216 HND 0.353 0.489 1,459 404 MAR 0.481 0.737 1,601 524 MEX 0.198 0.234 7,695 357 MLI 0.164 0.254 334 254 MWI 0.108 0.604 231 136 NER 0.073 0.664 283 95 NIC 0.243 0.271 1,251 453 PAK 0.236 0.312 658 732 PAN 0.777 0.583 5,197 141 PER 0.196 0.716 3,261 556 PRY 0.178 0.723 1,565 216 SEN 0.183 0.262 705 112 SLV 0.416 0.615 330 178 URY 0.296 0.623 5,683 399 VEN 0.245 0.432 6,204 100 ZAF 1.271 0.752 4,383 311 ZMB 0.066 0.468 720 120
3.3
Country-industry-level variable
Finally, we measure financial inclusion at the country-industry level. Using standard international measures of financial inclusion, we construct financial inclusion, INCLUSIONj,k,t, as the share of firms in industry
k of country j which have access to an overdraft facility. We intend to capture the more or less even distribution of credit among firms at the country-sector level. Contrary to the firms individual access to credit, which depend on their own risk characteristics (and the bank’s choice to grant access to credit to an individual client), country-sectoral financial inclusion is mainly a function of both sectoral financing needs
characteristics, which are likely to be similar across countries (Rajan and Zingales, 1998), and each country’s financial development. On average, the share of firms with access to an overdraft facility in a specific sector is 58%, but the variance is quite large, with some country-sectors having no access to overdraft at all, and others in which all firms benefit from this facility. We also test the robustness of the results using INCLUSION2j,k,t, which reflects the share of firms in the industry which has access to credit in a broader
sense (based on ACCESSj,k,t). Because INCLUSION2j,k,t is constructed in a more inclusive way, the share
of firms with access to finance in the industry is on average higher than for INCLUSIONj,k,t. As for financial
development, the variance across countries is quite high, as shown in Table 2. Analysis of these descriptive statistics also show that financial development does not always translate into increasing financial inclusion, with Latin American countries boasting a relatively higher levels of financial inclusion at lower levels of financial deepening than other countries. This suggests the importance of including countries with different levels of financial development and inclusion to capture the different impacts of the financial sector on firms growth.
4
The impact of financial development and financial inclusion on
firms growth
4.1
Baseline results
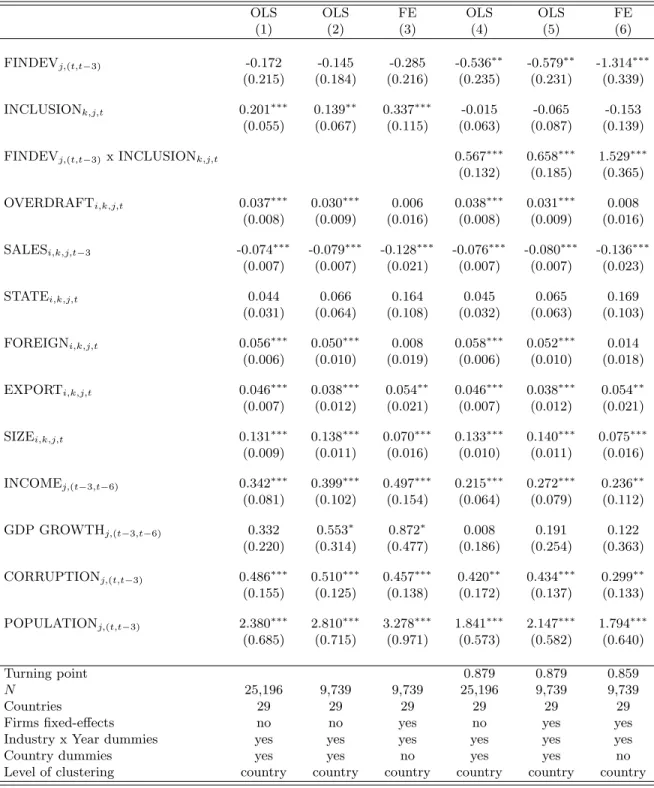
The estimation of equation 1 is reported in Table 3. In the first three columns, we do not include the interaction term of FINDEVj,k,t with INCLUSIONj,k,t. Only in columns (4) to (6) is the interaction term
included. First, the model is estimated without the firms fixed effects. In that case, we do not need to restrict ourselves to the sample of firms for which we have two points in time. We first include all the firms of the sample. We then estimate equation 1 on the restricted sample of firms in panel. Finally in column (3) we include the firm fixed effect. Following Moulton (1990), the standard errors are clustered at the country level, given the fact that the variables of interests are aggregated at the country level or country-industry level.
Table 3 suggests that firms growth is positively correlated to the fact of being owned by foreign investors, and being outward looking. Larger firms tend to grow more, while there also seems to be a catching up effect - suggested by the negative coefficient of SALESi,k,j,t−3. Firms growth is also on average higher in
positive coefficient of GDP GROWTHj,(t−3,t−6)). The control of corruption, a proxy for the quality of public
institutions and governance, and the size of the market (POPULATIONj,(t,t−3)) also positively affect firms
performance.
Turning to the level of financial development, FINDEVj,(t,t−3), it is not significant in columns (1) to
(3). INCLUSIONj,(t,t−3) si significantly positive, suggesting that the larger the share of firms with access
to finance the better for firms performance. Firms’ own access to credit, OVERDRAFTi,k,j,t is also
posi-tively correlated with firms performance, but this result is not robust to the inclusion of firms fixed effects (OVERDRAFTi,k,j,tdoes not vary much through time).
In columns (4) to (6), we include the interaction term of FINDEVj,(t,t−3) with INCLUSIONk,j,t. Now,
FINDEVj,(t,t−3)become significant at the convetional levels. However, it is negative, suggesting that financial
development may adversely influence firms growth. The interaction term is positive, and compensates for this negative effect. However, only for high levels of INCLUSIONk,j,t does FINDEVj,(t,t−3)have a positive effect
of growth perfromace. The turning point in INCLUSIONk,j,tfor which FINDEVj,(t,t−3)has a positive effect
if around 87%, i.e. only when the majority of the secteur has access to finance does financial development enhance firms growth.
Table 3: Benchmark estimations of the impact of financial development and inclusion on firms growth.
OLS OLS FE OLS OLS FE
(1) (2) (3) (4) (5) (6) FINDEVj,(t,t−3) -0.172 -0.145 -0.285 -0.536∗∗ -0.579∗∗ -1.314∗∗∗ (0.215) (0.184) (0.216) (0.235) (0.231) (0.339) INCLUSIONk,j,t 0.201∗∗∗ 0.139∗∗ 0.337∗∗∗ -0.015 -0.065 -0.153 (0.055) (0.067) (0.115) (0.063) (0.087) (0.139) FINDEVj,(t,t−3)x INCLUSIONk,j,t 0.567∗∗∗ 0.658∗∗∗ 1.529∗∗∗ (0.132) (0.185) (0.365) OVERDRAFTi,k,j,t 0.037∗∗∗ 0.030∗∗∗ 0.006 0.038∗∗∗ 0.031∗∗∗ 0.008 (0.008) (0.009) (0.016) (0.008) (0.009) (0.016) SALESi,k,j,t−3 -0.074∗∗∗ -0.079∗∗∗ -0.128∗∗∗ -0.076∗∗∗ -0.080∗∗∗ -0.136∗∗∗ (0.007) (0.007) (0.021) (0.007) (0.007) (0.023) STATEi,k,j,t 0.044 0.066 0.164 0.045 0.065 0.169 (0.031) (0.064) (0.108) (0.032) (0.063) (0.103) FOREIGNi,k,j,t 0.056∗∗∗ 0.050∗∗∗ 0.008 0.058∗∗∗ 0.052∗∗∗ 0.014 (0.006) (0.010) (0.019) (0.006) (0.010) (0.018) EXPORTi,k,j,t 0.046∗∗∗ 0.038∗∗∗ 0.054∗∗ 0.046∗∗∗ 0.038∗∗∗ 0.054∗∗ (0.007) (0.012) (0.021) (0.007) (0.012) (0.021) SIZEi,k,j,t 0.131∗∗∗ 0.138∗∗∗ 0.070∗∗∗ 0.133∗∗∗ 0.140∗∗∗ 0.075∗∗∗ (0.009) (0.011) (0.016) (0.010) (0.011) (0.016) INCOMEj,(t−3,t−6) 0.342∗∗∗ 0.399∗∗∗ 0.497∗∗∗ 0.215∗∗∗ 0.272∗∗∗ 0.236∗∗ (0.081) (0.102) (0.154) (0.064) (0.079) (0.112) GDP GROWTHj,(t−3,t−6) 0.332 0.553∗ 0.872∗ 0.008 0.191 0.122 (0.220) (0.314) (0.477) (0.186) (0.254) (0.363) CORRUPTIONj,(t,t−3) 0.486∗∗∗ 0.510∗∗∗ 0.457∗∗∗ 0.420∗∗ 0.434∗∗∗ 0.299∗∗ (0.155) (0.125) (0.138) (0.172) (0.137) (0.133) POPULATIONj,(t,t−3) 2.380 ∗∗∗ 2.810∗∗∗ 3.278∗∗∗ 1.841∗∗∗ 2.147∗∗∗ 1.794∗∗∗ (0.685) (0.715) (0.971) (0.573) (0.582) (0.640) Turning point 0.879 0.879 0.859 N 25,196 9,739 9,739 25,196 9,739 9,739 Countries 29 29 29 29 29 29
Firms fixed-effects no no yes no yes yes
Industry x Year dummies yes yes yes yes yes yes
Country dummies yes yes no yes yes no
Level of clustering country country country country country country Robust clustered standard errors at the country level. ***p<0.01, **p<0.05, *p<0.1.
4.2
Robustness checks
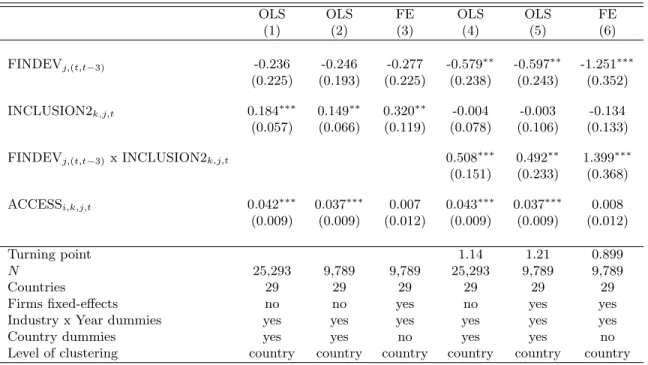
In what follows we provide two robustness checks of the baseline results presented in Table 3. First,we use an alternative measure of INCLUSIONk,j,t, and then we use different sub-samples of countries. Table
4 leads to very similar conclusion than in the baseline result. One major difference occurs, though, which stems from the fact that large financial inclusion may not necessarily fully compensate the negative effect of FINDEVj,(t,t−3), as shown in the row where the turning point is computed. Only when the firm fixed
effect are introduced do large levels of financial inclusion (more than 89% of the firms with access to credit) compensate for the negative effect of an increase in FINDEVj,(t,t−3).
Table 4: Using an alternative measure of financial inclusion.
OLS OLS FE OLS OLS FE
(1) (2) (3) (4) (5) (6) FINDEVj,(t,t−3) -0.236 -0.246 -0.277 -0.579∗∗ -0.597∗∗ -1.251∗∗∗ (0.225) (0.193) (0.225) (0.238) (0.243) (0.352) INCLUSION2k,j,t 0.184∗∗∗ 0.149∗∗ 0.320∗∗ -0.004 -0.003 -0.134 (0.057) (0.066) (0.119) (0.078) (0.106) (0.133) FINDEVj,(t,t−3)x INCLUSION2k,j,t 0.508∗∗∗ 0.492∗∗ 1.399∗∗∗ (0.151) (0.233) (0.368) ACCESSi,k,j,t 0.042∗∗∗ 0.037∗∗∗ 0.007 0.043∗∗∗ 0.037∗∗∗ 0.008 (0.009) (0.009) (0.012) (0.009) (0.009) (0.012) Turning point 1.14 1.21 0.899 N 25,293 9,789 9,789 25,293 9,789 9,789 Countries 29 29 29 29 29 29
Firms fixed-effects no no yes no yes yes
Industry x Year dummies yes yes yes yes yes yes
Country dummies yes yes no yes yes no
Level of clustering country country country country country country Robust clustered standard errors at the country level. ***p<0.01, **p<0.05, *p<0.1.
Table 5 presents the results when the baseline estimations are run on sub-samples of countries. In Panel A, we drop the low income countries of the dataset: Burkina Faso, Bangladesh, Mali, Malawi, Niger, and El Salvador. In Panel B, we drop the highest income countries of the sample (base on mean income per capita): Chile, Mexico, Panama, Uruguay, and Venezuela. The baseline results seem to hold when countries are dropped from the sample. The level of INCLUSIONk,j,t for which the impact of an increase
in FINDEVj,(t,t−3) is positive is slightly lower when the low income countries are dropped from the sample.
inclusion is somewhat a substitute to financial development. When the countries are more developed, financial inclusion is not as crucial as when they are less developed, where an increase in financial development may crowd out the smallest and more fragile firms.
Table 5: Estimations on sub-sample.
OLS OLS FE OLS OLS FE
(1) (2) (3) (4) (5) (6)
Panel A - without the low income countries
FINDEVj,(t,t−3) -0.041 -0.094 -0.247 -0.378 -0.451 -1.109∗∗∗ (0.237) (0.201) (0.215) (0.306) (0.276) (0.370) INCLUSIONk,j,t 0.155∗∗∗ 0.092∗ 0.357∗∗∗ -0.038 -0.102 -0.140 (0.048) (0.053) (0.114) (0.062) (0.088) (0.133) FINDEVj,(t,t−3)x INCLUSIONk,j,t 0.497∗∗∗ 0.570∗∗ 1.334∗∗∗ (0.176) (0.216) (0.404) OVERDRAFTi,k,j,t 0.039∗∗∗ 0.029∗∗∗ -0.001 0.039∗∗∗ 0.030∗∗∗ -0.001 (0.009) (0.009) (0.017) (0.009) (0.009) (0.017) N 21843 8618 8618 21843 8618 8618 Turning point 0.761 0.792 0.830
Panel B - without the higher income countries
FINDEVj,(t,t−3) -0.274 -0.186 -0.329 -0.703∗∗∗ -0.758∗∗∗ -1.590∗∗∗ (0.229) (0.187) (0.253) (0.230) (0.248) (0.451) INCLUSIONk,j,t 0.148∗∗ 0.098 0.222∗ -0.054 -0.107 -0.226 (0.058) (0.076) (0.108) (0.067) (0.090) (0.148) FINDEVj,(t,t−3)x INCLUSIONk,j,t 0.609∗∗∗ 0.764∗∗∗ 1.666∗∗∗ (0.170) (0.219) (0.411) OVERDRAFTi,k,j,t 0.040∗∗∗ 0.035∗∗∗ 0.017 0.041∗∗∗ 0.036∗∗∗ 0.019 (0.010) (0.010) (0.018) (0.011) (0.010) (0.018) N 19881 8030 8030 19881 8030 8030 Turning point 1.154 0.992 0.954
Firms fixed-effects no no yes no yes yes
Industry x Year dummies yes yes yes yes yes yes
Country dummies yes yes no yes yes no
Level of clustering country country country country country country Robust clustered standard errors at the country level. ***p<0.01, **p<0.05, *p<0.1.
5
Do some firms benefit more than others?
So far, we find that financial inclusion at the sector level has a positive effect on firms growth, controlling for each firm own access to credit. We also find that financial development has no effect on firms growth on average, in our sample of developing and emerging countries, in line of previous literature showing that financial deepening has little impact on economic performance in developing countries with small banking systems. However, where financial inclusion is low, an increase in financial development tends to impede firms growth, while it has a positive effect on firms growth when financial inclusion is larger. In what follows, we explore whether firms characteristics influence the relationship between financial development, financial inclusion and growth.
First, we explore the spillover effect of financial inclusion. More specifically, we test whether the im-pact of financial inclusion, at the sector level, depends on whether the firm, itself, has access to finance. We therefore include an interaction term of INCLUSIONk,j,t with OVERDRAFTi,k,j,t. Panel A of
Ta-ble 6 displays the results. We find that this interaction term is never significant, and that the impact of INCLUSIONk,j,t is unalterd by its inclusion. We also examine in columns (4) to (6) whether the impact of
financial development depends on whether the firm holds an overdraft facility. Again, the interaction term of FINDEVj,(t,t−3) with OVERDRAFTi,k,j,t is never significant. Finally, in columns (7) to (9) we include
the interaction term of FINDEVj,twith INCLUSIONk,j,t, controlling for the two previous interaction terms
with OVERDRAFTi,k,j,t. The results found in Table 3 are unaltered. The turning point in INCLUSIONk,j,t
for which FINDEVk,j,(t,t−3)starts having a positive correlation with firms growth is comprised between 84%
and 88%.
In Panel B of Table 6, we show that the effect of financial inclusion and development do not seem to depend on whether the firm is small (less than 20 employees). We control for whether the firm is small, using a dummy variable. SIZEj,(t,t−3) is dropped form the estimation. Panel B suggests that large or small the
firms seem to benefit similarly from financial inclusion. Moreover, the interaction term between FINDEVj,t
and INCLUSIONk,j,tremains significantly positive with a turning point in INCLUSIONk,j,tin-between 83%
and 91% in columns (7) to (9). Panel C of Table 6 shows the results when foreignly owned firms are distinguished from other firms. Again the results are unaltered by the introduction of interaction terms with FOREIGNi,k,j,t. The turning point in INCLUSIONk,j,tremains fairly high, between 86% and 94%. Finally,
the same is true in Panel D when we distinguish between state owned firms and others.
development affect the performance of firms.3 When only financial inclusion is included in the test, as in columns (1), (2), and (3), we find a significant negative interaction between financial inclusion and public debt, i.e. an increase in public borrowing decreases the impact of financial inclusion on growth sales. This suggests a specific crowding-out effect of public debt on credit to private firms, even though we cannot disentangle whether it is volume or price based. However, when including financial development as in columns (7), (8), and (9), we simply confirm that our baseline results are not affected by adding public debt in the estimation.
3We loose Chile and Uruguay due to data availability on debt ratio. Data for DEBT
j,(t,t−3)are from World Development
T ab le 6: Th e eff ec t of fi nan ci al inc lus ion an d d ev el op me n t d ep en di n g on fi rms char act eri st ic s. O LS O LS F E O LS OLS F E O LS O LS F E (1) (2) (3) (4) (5) (6) (7) (8) (9) P ANEL A -O VE RD RAF T F IND EV j ,( t,t − 3) -0. 169 -0. 145 -0. 286 -0. 170 -0.151 -0. 314 -0. 523 ∗∗ -0. 576 ∗∗ -1. 323 ∗∗∗ (0. 213) (0. 183) (0. 217) (0. 221) (0. 188) (0. 222) (0. 235) (0. 233) (0. 346) INCLUS IO Nk ,j ,t 0. 180 ∗∗∗ 0. 135 ∗ 0. 362 ∗∗∗ 0. 201 ∗∗∗ 0. 139 ∗∗ 0. 338 ∗∗∗ -0. 045 -0. 067 -0.119 (0. 055) (0. 070) (0. 113) (0. 056) (0. 067) (0. 115) (0. 062) (0. 092) (0. 141) INCLUS IO Nk ,j ,t x O VERD RAF Ti,k ,j ,t 0. 041 0. 008 -0. 038 0. 040 -0. 003 -0. 077 (0. 024) (0. 034) (0. 063) (0. 026) (0.032) (0. 067) F IND EV j ,( t,t − 3) x O VERD RAF Ti,k ,j ,t -0. 003 0. 009 0. 042 -0. 039 ∗ -0. 015 -0. 036 (0. 028) (0. 026) (0.059) (0. 020) (0. 029) (0. 075) F IND EV j ,( t,t − 3) x INCLUS IO Nk ,j ,t 0. 592 ∗∗∗ 0. 668 ∗∗∗ 1. 576 ∗∗∗ (0. 127) (0. 185) (0. 375) P ANEL B -SM ALL F IND EV j ,( t,t − 3) -0. 141 -0. 111 -0. 280 -0. 134 -0.105 -0. 212 -0. 465 ∗ -0. 465 ∗ -1. 213 ∗∗∗ (0. 209) (0. 184) (0. 217) (0. 208) (0. 184) (0. 228) (0. 236) (0. 233) (0. 341) INCLUS IO Nk ,j ,t 0. 194 ∗∗∗ 0. 146 ∗∗ 0. 392 ∗∗∗ 0. 188 ∗∗∗ 0. 131 ∗ 0. 342 ∗∗∗ -0. 002 -0. 025 -0.091 (0. 049) (0. 063) (0. 127) (0. 052) (0. 065) (0. 115) (0. 060) (0. 086) (0. 143) INCLUS IO Nk ,j ,t x SM ALL i,k ,j ,t -0. 011 -0. 035 -0. 143 -0. 006 -0. 026 -0. 087 (0. 026) (0. 033) (0. 095) (0. 029) (0.036) (0. 092) F IND EV j ,( t,t − 3) x SM ALL i,k ,j ,t -0. 021 -0. 022 -0. 182 ∗ -0. 002 -0. 004 -0.108 (0. 028) (0. 022) (0.103) (0. 027) (0. 028) (0. 107) F IND EV j ,( t,t − 3) x INCLUS IO Nk ,j ,t 0. 508 ∗∗∗ 0. 538 ∗∗∗ 1. 448 ∗∗∗ (0. 121) (0. 177) (0. 354) P ANEL C -F ORE IG N F IND EV j ,( t,t − 3) -0. 172 -0. 145 -0. 286 -0. 174 -0.140 -0. 277 -0. 535 ∗∗ -0. 575 ∗∗ -1. 304 ∗∗∗ (0. 215) (0. 183) (0. 215) (0. 214) (0. 184) (0. 217) (0. 235) (0. 231) (0. 338) INCLUS IO Nk ,j ,t 0. 202 ∗∗∗ 0. 138 ∗ 0. 342 ∗∗∗ 0. 202 ∗∗∗ 0. 137 ∗ 0. 335 ∗∗∗ -0. 014 -0. 073 -0.154 (0. 057) (0. 068) (0. 122) (0. 055) (0. 068) (0. 115) (0. 064) (0. 088) (0. 146) INCLUS IO Nk ,j ,t x F OR EIG Ni,k ,j ,t -0. 005 0. 007 -0.029 -0. 001 0. 030 0. 006 (0. 038) (0. 048) (0. 124) (0. 043) (0.054) (0. 134) F IND EV j ,( t,t − 3) x F OR EIG Ni,k ,j ,t 0. 014 -0. 053 ∗ -0. 079 0. 006 -0.061 ∗ -0. 057 (0. 021) (0. 031) (0.048) (0. 025) (0. 035) (0. 051) F IND EV j ,( t,t − 3) x INCLUS IO Nk ,j ,t 0. 566 ∗∗∗ 0. 663 ∗∗∗ 1. 524 ∗∗∗ (0. 129) (0. 186) (0. 366) N 25196 9739 9739 25196 9739 9739 25196 9739 9739
T ab le 6: con ti n u ed O LS OLS F E O LS O LS F E O LS O LS F E (1) (2) (3) (4) (5) (6) (7) (8) (9) P ANEL D -S T A TE F IND EV j ,( t,t − 3) -0. 171 -0.138 -0. 283 -0. 173 -0. 144 -0. 282 -0.536 ∗∗ -0. 578 ∗∗ -1. 311 ∗∗∗ (0. 215) (0. 18 1) (0. 215) (0. 215) (0.183) (0. 215) (0. 235) (0. 231) (0. 338) INCLUS IO Nk ,j ,t 0. 198 ∗∗∗ 0. 134 ∗ 0. 334 ∗∗∗ 0. 202 ∗∗∗ 0. 139 ∗∗ 0. 335 ∗∗∗ -0. 019 -0. 075 -0.161 (0. 055) (0. 067) (0. 114) (0. 055) (0. 0 67) (0. 114) (0. 063) (0. 090) (0. 140) INCLUS IO Nk ,j ,t x ST A TE i,k ,j ,t 0. 265 ∗∗ 0. 661 ∗∗ 0. 335 0.268 ∗∗ 0. 695 ∗∗ 0. 384 (0. 112) (0. 296) (0. 483) (0.122) (0. 307) (0. 471) F IND EV j ,( t,t − 3) x ST A TE i,k ,j ,t 0. 091 -0. 116 -0.415 0. 044 -0.278 -0. 498 (0. 106) (0. 298) (0. 543) (0. 107) (0. 344) (0. 586) F IND EV j ,( t,t − 3) x INCLUS IO Nk ,j ,t 0. 569 ∗∗∗ 0. 669 ∗∗∗ 1. 534 ∗∗∗ (0. 132) (0. 190) (0. 367) N 25196 9739 9739 25196 9739 9739 25196 9739 9739 P ANEL E -D E BT D E BT j ,( t,t − 3) 0. 001 0. 001 0. 001 -0.003 ∗∗ -0. 002 ∗ -0. 004 ∗∗∗ 0. 001 0.001 0. 000 (0. 002) (0. 002) (0. 002) (0. 001) (0. 001) (0. 001) (0. 001) (0. 002) (0. 002) F IND EV j ,( t,t − 3) -0. 009 0. 081 0. 143 0. 002 0. 061 0. 015 -0. 369 -0. 454 -1.357 ∗ (0. 266) (0. 254) (0. 337) (0. 315) (0. 334) (0. 442) (0. 288) (0. 440) (0. 787) INCLUS IO Nk ,j ,t 0. 400 ∗∗∗ 0. 323 ∗∗ 0. 595 ∗∗∗ 0. 191 ∗∗∗ 0. 141 ∗ 0. 307 ∗∗ 0. 212 ∗ 0. 109 -0. 034 (0. 094) (0. 125) (0. 160) (0. 059) (0. 077) (0. 123) (0. 105) (0. 148) (0. 250) INCLUS IO Nk ,j ,t x D EB Tj ,( t,t − 3) -0. 004 ∗∗∗ -0. 004 ∗ -0. 006 ∗∗ -0. 003 ∗∗ -0. 003 -0. 002 (0. 001) (0. 002) (0. 002) (0.001) (0. 002) (0. 003) F IND EV j ,( t,t − 3) x D EB Tj ,( t,t − 3) 0. 002 0.001 0. 004 -0. 000 0.000 0.004 (0. 003) (0. 003) (0. 004) (0. 003) (0. 004) (0. 006) F IND EV j ,( t,t − 3) x INCLUS IO Nk ,j ,t 0. 389 ∗∗ 0. 541 ∗∗ 1. 404 ∗∗ (0. 160) (0. 253) (0. 560) N 22799 8609 8609 22799 8609 8609 22799 8609 8609 A ll e stima tion s in clud e fir m-lev el an d co un try -lev el con trol v a riabl es. T he O LS co lum ns (1, 2 , 4, 5 , 7, 8) inclu de coun try fi xe d eff e cts a nd indu stry -ti me du mmi es. T he fix ed -eff ect c olum ns (3 , 6, 9) inc lude fi rm fix ed e ff ects an d ind ustry -y ea r dum mies. R obus t stan dard e rrors cl ustere d at th e cou n try lev el. ** *p < 0.0 1, * *p < 0.0 5, *p < 0.1 .
6
Conclusion
In this article, we sought to explore whether financial deepening contributes to the growth of the private sector in developing and emerging countries and, more specifically, whether access to credit, measured by access to an overdraft facility, provides additional insight in explaining the impact of bank financing on firms. In line with previous literature, we find that financial depth does not affect the growth of firms in these countries on average, but has a negative impact on firms’ growth at low levels of financial inclusion.
We also find that financial inclusion has a positive impact on the growth of firms. The positive interaction between financial deepening and inclusion also suggest they may be substitutes and that financial inclusion compensates for the negative impact of financial deepening in developing and emerging countries for levels of financial inclusion around 80%, to be compared with the sample average of 73%.
We test the robustness of these results by using an alternative definition of financial inclusion, access to external financing, and by testing our model on sub-samples of countries with different levels of economic development, low income countries and high income countries. We not only find similar results as in the baseline estimation, but also infer that financial inclusion is particularly important in low income countries where both financial development and inclusion are lower and the relative gains of financial inclusion more significant.
Finally, we sought to determine to what extent financial inclusion benefited some firms more than others, in particular by size or by composition of capital (foreign or state owned) or according to their own access to credit. We found that financial inclusion benefits all firms in the same proportions, suggesting that, like financial deepening, it has a broad and positive and widespread impact on firm performance.
These conclusions suggest that insufficient financial inclusion represents one channel which, along weak governance, institutions, and large information asymmetries reduce expected benefits from the development of banking systems in developing countries, characterized by a narrow client base and highly concentrated credit portfolios on government debt and a minority of large, often international, private firms. These results suggest that the expected benefits of financial deepening in terms of firm performance can only be felt when the bank client base and bank credit portfolios become more inclusive.
Financial development policy should therefore include specific plans to enhance financial inclusion, along-side financial market development and credit growth. Such strategic plans involve reducing information asymmetries which may induce credit rationing from credit institutions, increase consumer protection, and improve the business climate of the banking sector. If overdraft facilities remain the cornerstone of credit access in these countries, diversifying credit access towards long term credit is also paramount.
Further research is clearly needed to measure the impact of financial inclusion on firm performance, in particular by taking into account the positive feedback effects of financial inclusion, which provides strong incentives for firms to join the formal sector, and over time, contributes to lower credit costs and diversify bank portfolios, thereby solidifying the banking sector. Including firms targeted by microfinance institutions, focusing research of the informal sector, and lengthening the time span of the analysis may reveal additional impacts our study has just touched on.
References
Abdmoulah, Walid and Riadh Ben Jelili. 2013. “Access to Finance Thresholds and the Finance-Growth Nexus.” Economic Papers: A journal of applied economics and policy 32 (4):522–534.
Aghion, Philippe, George-Marios Angeletos, Abhijit Banerjee, and Kalina Manova. 2010. “Volatility and growth: Credit constraints and the composition of investment.” Journal of Monetary Economics 57 (3):246–265.
Aghion, Philippe, Philippe Bacchetta, Romain Ranciere, and Kenneth Rogoff. 2009. “Exchange rate volatility and productivity growth: The role of financial development.” Journal of Monetary Economics 56 (4):494– 513.
Arcand, Jean-Louis, Berkes Enrico, and Ugo Panizza. 2012. “Too much finance?” Tech. rep.
Beck, Thorsten, Berrak B¨uy¨ukkarabacak, Felix Rioja, and Neven Valev. 2008. “Who gets the credit? And does it matter? Household vs. firm lending across countries.” .
Beck, Thorsten, Hans Degryse, and Christiane Kneer. 2014. “Is more finance better? Disentangling inter-mediation and size effects of financial systems.” Journal of Financial Stability 10:50–64.
Beck, Thorsten, Asli Demirg¨u¸c-Kunt, and Ross Levine. 2007. “Finance, inequality and the poor.” Journal of economic growth 12 (1):27–49.
Beck, Thorsten, Asli Demirguc-Kunt, and Vojislav Maksimovic. 2005. “Financial and Legal Constraints to Growth: Does Firm Size Matter?” Journal of Finance 60 (1):137–177.
Berman, Nicolas and J´erˆome H´ericourt. 2010. “Financial factors and the margins of trade: Evidence from cross-country firm-level data.” Journal of Development Economics 93 (2):206–217.
Burgess, Robin and Rohini Pande. 2005. “Do rural banks matter? Evidence from the indian social banking experiment.” The American economic review 95 (3):780–795.
Deidda, Luca and Bassam Fattouh. 2002. “Non-linearity between finance and growth.” Economics Letters 74 (3):339–345.
Deidda, Luca G. 2006. “Interaction between economic and financial development.” Journal of Monetary Economics 53 (2):233–248.
Demetriades, Panicos and Siong Hook Law. 2006. “Finance, institutions and economic development.” Inter-national Journal of Finance & Economics 11 (3):245–260.
Easterly, William, Roumeen Islam, and Joseph E Stiglitz. 2001. “Shaken and stirred: explaining growth volatility.” In Annual World Bank conference on development economics, vol. 191. 211.
GPFI. 2013. “The 20 basic set of financial inclusion indicators.” Global Partnership for Financial Inclusion April.
GPFI, Global Partnership for financial inclusion. 2011. SME Finance Policy Guide. IFC, Washington, DC.
Gu´erineau, Samuel and Luc Jacolin. 2014. “L’inclusion financi´ere en Afrique sub-saharienne: Faits stylis´es et d´eterminants.” Revue d’´economie financi´ere 116.
Harrison, Ann E, Justin Yifu Lin, and Lixin Colin Xu. 2014. “Explaining Africa’s (dis)advantage.” World Development .
Harrison, Ann E and Margaret S McMillan. 2003. “Does direct foreign investment affect domestic credit constraints?” Journal of international economics 61 (1):73–100.
Henderson, Daniel J, Chris Papageorgiou, and Christopher F Parmeter. 2013. “Who benefits from financial development? New methods, new evidence.” European Economic Review 63:47–67.
H´ericourt, J´erˆome and Sandra Poncet. 2013. “Exchange rate volatility, financial constraints, and trade: empirical evidence from Chinese firms.” The World Bank Economic Review :lht035.
Holmstrom, Bengt and Jean Tirole. 1997. “Financial intermediation, loanable funds, and the real sector.” the Quarterly Journal of economics :663–691.
King, Robert G and Ross Levine. 1993. “Finance, entrepreneurship and growth.” Journal of monetary Economics 32 (3):513–542.
Kroszner, Randall S, Luc Laeven, and Daniela Klingebiel. 2007. “Banking crises, financial dependence, and growth.” Journal of Financial Economics 84 (1):187–228.
Loayza, Norman V and Romain Ranciere. 2006. “Financial development, financial fragility, and growth.” Journal of Money, Credit and Banking :1051–1076.
M´eon, Pierre-Guillaume and Laurent Weill. 2010. “Does financial intermediation matter for macroeconomic performance?” Economic modelling 27 (1):296–303.
Moulton, Brent R. 1990. “An Illustration of a Pitfall in Estimating the Effects of Aggregate Variables on Micro Units.” The Review of Economics and Statistics 72 (2):pp. 334–338.
Panizza, Ugo. 2012. “Finance and economic development.” International Development Policy| Revue inter-nationale de politique de d´eveloppement (3).
Philippon, Thomas and Ariell Reshef. 2013. “An international look at the growth of modern finance.” The Journal of Economic Perspectives :73–96.
Raddatz, Claudio. 2006. “Liquidity needs and vulnerability to financial underdevelopment.” Journal of Financial Economics 80 (3):677–722.
Rajan, Raghuram G. and Luigi Zingales. 1998. “Financial Dependence and Growth.” American Economic Review :559–586.
Rajan, Raghuram G and Luigi Zingales. 2003. “The great reversals: the politics of financial development in the twentieth century.” Journal of financial economics 69 (1):5–50.
Rioja, Felix and Neven Valev. 2004. “Does one size fit all?: a reexamination of the finance and growth relationship.” Journal of Development economics 74 (2):429–447.
Rodrik, Dani and Arvind Subramanian. 2009. “Why did financial globalization disappoint?” IMF staff papers 56 (1):112.
Rousseau, Peter L and Paul Wachtel. 2002. “Inflation thresholds and the finance–growth nexus.” Journal of International Money and Finance 21 (6):777–793.
Table 7: Appendix 1. List of countries, years of surveys, and number of observations in panel.
Latin America Africa Asia
Country Survey N Country Survey N Country Survey N
Argentina (2006, 2010) 840 Burkina Faso (2006, 2009) 153 Bangladesh (2007, 2011) 444 Bolivia (2006, 2010) 217 Botswana (2006, 2010) 206 Pakistan (2002, 2007) 732 Brazil (2003, 2009) 836 Cameroon (2006, 2009) 141
Chile (2006, 2010) 732 Cape Verde (2006, 2009) 99 Colombia (2006, 2010) 538 Mali (2007, 2010) 254 Ecuador (2006, 2010) 279 Malawi (2005, 2009) 136 El Salvador (2006, 2010) 178 Morocco (2004, 2007) 524 Guatemala (2006, 2010) 216 Niger (2005, 2009) 95 Honduras (2003, 2006) 404 Senegal (2003, 2007) 112 Mexico (2006, 2010) 357 South Africa (2003, 2007) 311 Nicaragua (2003, 2006) 453 Zambia (2002, 2007) 120 Panama (2006, 2010) 141 Peru (2006, 2010) 556 Paraguay (2006, 2010) 216 Uruguay (2006, 2010) 399 Venezuela (2006, 2010) 100 Total 6,439 (66%) 2,124 (22%) 1,176 (12%)