HAL Id: hal-00599077
https://hal-polytechnique.archives-ouvertes.fr/hal-00599077
Submitted on 8 Jun 2011HAL is a multi-disciplinary open access archive for the deposit and dissemination of sci-entific research documents, whether they are pub-lished or not. The documents may come from teaching and research institutions in France or abroad, or from public or private research centers.
L’archive ouverte pluridisciplinaire HAL, est destinée au dépôt et à la diffusion de documents scientifiques de niveau recherche, publiés ou non, émanant des établissements d’enseignement et de recherche français ou étrangers, des laboratoires publics ou privés.
EPR study of Ti3+ ions formed under beta irradiation
in silicate glasses.
Pierre Lombard, Nadège Ollier, Bruno Boizot
To cite this version:
Pierre Lombard, Nadège Ollier, Bruno Boizot. EPR study of Ti3+ ions formed under beta irradi-ation in silicate glasses.. Journal of Non-Crystalline Solids, Elsevier, 2011, 357 (7), pp.1685-1689. �10.1016/j.jnoncrysol.2010.12.015�. �hal-00599077�
EPR study of Ti
3+ions formed under beta irradiation in silicate
glasses
P. Lombard1*, N. Ollier1, B. Boizot1
1. Laboratoire des Solides Irradiés, UMR 7642 CEA-CNRS-Ecole Polytechnique Ecole Polytechnique, Route de Saclay, 91128 Palaiseau CEDEX, France
*Corresponding author: [email protected] Tél. : +33 (0) 1 69 33 45 02 – Fax. : +33 (0)1 69 33 46 54
Abstract: Reduction processes of Ti4+ ions in various silicate glasses have been studied by EPR spectroscopy at 20 K. Different parameters like the [Na]/[Ti] ratio, the integrated dose and Ti3+ ions ageing processes were analyzed in this work. Simulation of the Ti3+ ion EPR spectra in different Ti-doped silicate glasses has shown three different Ti3+ environment attributed to one [VI]Ti3+ and two [V]Ti3+ environment (square pyramid and trigonal bi-pyramid). The [VI]Ti3+ ion environment is observed only for [Na]/[Ti] ratios higher or equal to 68 although the two others are observed for all values of the [Na]/[Ti] ratio considered. In terms of relative proportions, the Ti3+ ions in a square pyramid of oxygen are the dominant species.
1. Introduction
Reduction processes of Rare Earth (RE) and Transition Metals (TM) ions in silicate
and borosilicate oxide glasses under ionizing irradiation have been observed by
Electron Paramagnetic Resonance (EPR) and luminescence spectroscopies in
previous works. Ions like Ti4+ [1], Sm3+ [2], Cr3+ [3] or Fe3+ [4] are reduced as a
detected for integrated dose around 109 Gy using luminescence measurements [2].
The reduction processes of ions in glasses can be associated to the production of
electron hole pairs (excitons) in glasses. Some electrons can be trapped for example
on the Ti4+ ions, leading to the formation of stable Ti3+ ions while holes are trapped by
oxygen ions leading to the production of different punctual holes defects in the irradiated glass [5]. Moreover, for the highest doses integrated inside the glass (≈ 1 x
109 Gy), an increase of the network polymerization [6-11] associated with a
production of molecular oxygen [6, 8-9, 11] may occur. These two processes are
correlated to the alkaline migration processes under ionizing radiation [8, 10].
Efficiency of reduction processes under ionizing radiation should also depend on the
environment around the doping ion in glasses.
Titanium ion is a good candidate for studying this relationship. First, when TiO2 is
added to a glass composition, the main oxidation state in the matrix is the Ti4+ state
[12, 13]. Study of the titanium environment before irradiation will therefore bring
information of the different environments around an oxidation state. The second
reason is that titanium environment in glasses has been extensively studied by X-Ray
Absorption Near Edge Structure (XANES), Extended X-ray Absorption Fine Structure
(EXAFS) [12-18] and Raman spectroscopy [19, 20]. These works show the existence
of different Ti4+ coordination number: [IV]Ti4+, [V]Ti4+ and [VI]Ti4+. The [IV]Ti4+
corresponds to a Ti4+ surrounded by a oxygen tetrahedron; the [V]Ti4+ to a Ti4+ ion in a
square pyramid of oxygen with one short titanyl Ti = O bond (1.7 Å) and four longer
Ti – O bonds (1.93 Å) [13]. The [VI]Ti4+ is associated to an octahedral environment
around Ti4+ ions [12, 13]. The proportion between theses environments is mainly
correlated to the content of network modifiers inside the glass [13-14, 17-19, 21]. In
and six-fold environment. Two reduction processes are therefore supposed to occur
as a function of the integrated does. The first one is a reduction process from Ti4+ to
Ti3+ ions without any coordination number changes for doses lower than 1 x 10⁹ Gy.
The second one is associated to the alkaline migration at higher doses which could
possibly leads to reduction processes of Ti4+ ions with a coordination number change.
Under these assumptions and depending on the chemical composition of the glass,
we shall observe in -irradiated SiO2 – Na2O – TiO2 glasses three different
environment for Ti3+ ions: [IV]Ti3+, [V]Ti3+ and [VI]Ti3+.
The aim of this paper is to study the different environments of Ti3+ ions produced
under -irradiation in SiO2 – Na2O – TiO2 glasses with 1 to 4 %mol. of titanium as a
function of the alkaline content and of the integrated dose. The second goal is to
correlate theses results on Ti3+ ions with literature results on Ti4+ environment as a
function of the silicate glasses composition.
For that purpose, we have mainly used the X-band Electron Paramagnetic
Resonance (EPR) spectroscopy at low temperature (20 K) associated with the
simulation of experimental Ti3+ ions EPR spectra. This approach allows us to
determine the EPR parameters (g-tensor, widths) for each Ti3+ ion sites produced
under ionizing radiation and their relative proportions as the function of the glass
compositions and integrated doses.
2. Experimental
2.1 Sample Preparation
The different glass composition were prepared by mixing appropriate amounts of
analytical reagent grade (SiO2, TiO2, Na2CO3) in an agate mortar with ethanol. The
10 h. This temperature step was used to ensure a correct decarbonatation of the
powders. After decarbonatation, the melt was heated to 1600°C in 3 h and quenched.
The obtained samples were cut and manually polished on a Labram HR Mecapol.
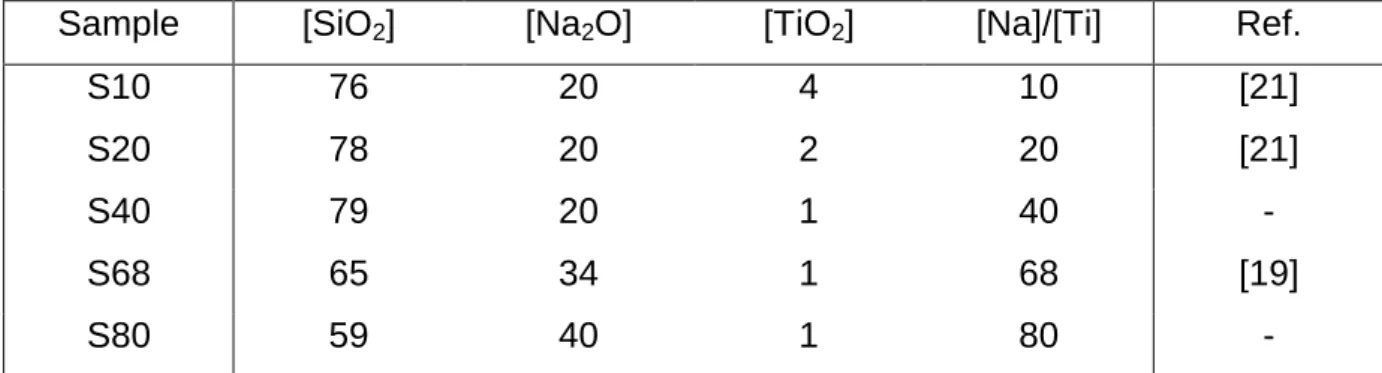
The different glasses studied in this work are presented in table 1 where the sample
number corresponds to the [Na]/[Ti] ratio of the silicate composition. The S10
([Na]/[Ti] = 10), S20 ([Na]/[Ti] = 20) and S68 ([Na]/[Ti] = 68) samples are of the same
composition than samples already studied by XANES and micro-Raman
spectroscopy in previous works (resp. in [21] for S10 and S20 and [19] for S68).
All the samples were -irradiated on a Van de Graaff accelerator (LSI, Ecole Polytechnique, France) with a 10 µA current and an energy of 2.5 MeV at different
doses: 3.24 x 10⁶; 3.23 x 10⁷; 2.75 x 10⁸; 5.53 x 10⁸ and 1.68 x 10⁹ Gy. During
irradiation, the sample temperature never exceeded 80°C.
All the samples were synthesized using the same protocol but the theoretical
compositions has not been confirmed by a chemical analysis. Thus, we’ll assume
that the composition of all samples is affected by the same error.
2.2. Experimental EPR spectroscopy
X-band ( = 9.490 GHz) EPR spectra were recorded at 20 K using an OXFORD He cryostat on a EMX Bruker spectrometer. The microwave power used, 0.05 mW, were
determined by considering the saturation properties of Ti3+ EPR lines at 20 K. The
different EPR spectra presented in this paper have been normalized to the same
receiver gain (1.104) and sample weight (100 mg) in order to get quantitative
comparison of the EPR lines intensities between the different samples. We
emphasize that EPR spectroscopy is a tool where the absorbance spectra (i.e. the
paramagnetic ion in a specific site can be correlated to the paramagnetic specie spin
content inside the sample [22]. However, due to different saturation properties, the
EPR linewidths of known EPR reference spectra (e.g. DPPH, strong and weak pitch)
and Ti3+ EPR spectra are strongly different. In the present work it is thus very difficult
to compare theses spectra to determine the absolute number of Ti3+ spins. Then, in
this study, we will only use arbitrary units (a.u.) to analyze the evolution of Ti3+ ions
content as a function of the integrated dose and silicate glass compositions. However,
using simulation of EPR spectra (see §2.3), we are able to separate the experimental
spectrum into a sum of Ti3+ elementary spectra corresponding to different sites of Ti3+
ions. In this case, the relative proportion of Ti3+ in each site, expressed in %, will be
determined by computing the ratio of the area under each elementary absorbance
spectrum and the area under the total simulated spectrum.
Many different phenomena may induce an error on the measured values: position of
the sample into the EPR cavity, variation of temperature, etc. The global error on
each point of the EPR spectrum is estimated to be 4.8 %. This value was obtained by
recording ten times the EPR spectrum of the same sample (S80 irradiated at 3,27 x
107 Gy). Each time the sample is removed and replaced into the EPR cavity and the
temperature returns to ambient before decreased again.
2.3. Simulation of EPR spectra
Simulation of EPR spectra were realized using the ZFSFIT program developed by G.
Morin and D. Bonnin [23]. This program was specially developed for fitting EPR powder spectra with paramagnetic species with nuclear spin I ≤ 7/2 and electronic
spin S ≤ 5/2. The more general spin Hamiltonian calculated by ZFSFIT is:
4 , 2 k k k q q k q kO S A I B S g H Where is the Bohr magnetron, H is the magnetic field tensor, g is the Lande tensor,
S the spin tensor, q k
O the Stevens operators,Bkq the constant associated with the
Stevens operators, A the hyperfine tensor and I the nuclear spin operator [23]. For
trivalent titanium ions, S = ½ and I = 0. Therefore, the spin Hamiltonian used in our
simulations is:
S g H
Because we observe different Ti3+ EPR sites in our glasses, the simulated spectra
calculated by ZFSFIT is the sum of the elementary spectrum of Ti3+ ions in each of
theses sites. ZFSFIT compares the calculated spectrum with the experimental one,
compute the difference between both and refine the given parameters (g values,
isotropic width (so), and anisotropic widths (s1, s2 and s3) for each Ti3+ ion EPR site)
by a routine based on the Levenberg-Marquardt algorithm.
At the end of the fitting procedure, the obtained simulated EPR spectra for each Ti3+
environment are defined by three g-values which can be associated to the EPR axis
of the system [24]. Because we are working with amorphous materials, our EPR
spectra are the sum over all spatial orientations of the Ti3+ EPR spectrum and thus, it
is impossible to associate a g value with a spatial direction into the sample. By
convention, we will assume that g3 ≥ g2 ≥ g1. The three anisotropic widths s1, s2 and
s3 widths correspond to the g-strain process in amorphous material associated with g
values distribution. The g–strain process in the ZFSFIT program is treated as a
perturbation of the Zeeman Hamiltonian term different along the g tensor direction.
By convention, we will assume s3 = 0 to precisely quantify the other widths.
3. Results
The figure 1 presents the EPR spectra of titanium-doped silicate glasses samples
S10 to S80 after -irradiation at 3.23 x 10⁷ Gy. These spectra are complex and may be separated into two groups of lines. The first group, centered around g = 2.0076 0.003 and close to the g-value of free electron (ge = 2.0023 [22]) is attributed to the
paramagnetic hole defects created by irradiation [7, 5] and the second group,
centered around g = 1.935 0.003 is attributed to Ti3+ ions [22, 25, 26]. In this paper we will mainly focus our study on the EPR spectrum of Ti3+ ions. Fig. 1 clearly shows
a dependence between the shape of the Ti3+ EPR spectra and the [Na]/[Ti] ratio. For
a ratio less than 40, all the EPR spectra are identical and are characterized by a
positive component at g = 1.935 0.003 and a large negative component around g ≈ 1.855. When the [Na]/[Ti] ratio increases to 80, the EPR spectra shows an additional
line determined by an intense positive peak at g = 1.963 0.003 and a negative shoulder at g = 1.935 0.003. Considering the existence of different EPR lines on the Ti3+ EPR spectra, we can conclude first that the Ti3+ EPR signal of these
irradiated silicate glasses is the sum of different components corresponding to, at
least, two different Ti3+ EPR sites. The first Ti3+ site in silicate glasses, hereafter
denoted sI component in the EPR spectra, appears for [Na]/[Ti] ratios greater or
equal to 68 and can be determined by g// ≈ 1.963 and g┴ ≈ 1.855 axial symmetry.
The second component in the Ti3+ EPR spectra is observed for all [Na]/[Ti] ratios.
However, we will show later that this EPR line is in fact the sum of two different
components denoted sII and sIII corresponding to two other Ti3+ environments in the
irradiated silicate glasses.
Figure 2 shows the EPR spectra of the two titanium doped silicate glasses S20 and
S80 irradiated at different doses between 3.24 x 10⁶ and 1.68 x 10⁹ Gy. The EPR spectra of pristine S20 and S80 samples also presented in Fig. 2 don’t show any
signal in the region of Ti3+ EPR lines. We can conclude therefore that Ti3+ ions for
these silicate glass compositions are only produced during irradiation and not during
the glass synthesis. For the S20 sample ([Na]/[Ti]=20), we observe an increase of the
Ti3+ EPR lines intensity corresponding to an increase of the Ti3+ content as a function
of the dose integrated in the glass. We can also analyze the appearance of a
shoulder at g = 1.963 0.003 and a shift of the minimum of the EPR signal from g = 1.846 0.003 to g = 1.871 0.003. According to our previous results, we can correlate these changes in the Ti3+ EPR spectra to a modification of the relative
proportion of Ti3+ ions between the sII and sIII sites when the integrated dose
increases. We can then attribute the sII component EPR spectrum to the shoulder at
g = 1.963 and the minimum at g = 1.871. Finally, the last Ti3+ environment
characterized by the sIII component has an EPR spectrum close to the EPR spectra
observed for the lowest dose (3.24 x 10⁶ Gy).
For the S80 sample, we observe also an increase of the Ti3+ EPR spectrum intensity
with the integrated dose inside the silicate glass correlated with the increase of Ti3+
ions content. We can also see on Fig. 2 an increase of the relative intensity of g =
1.935 0.003 component and a displacement of the minimum of the signal from g = 1.855 0.003 to g = 1.868 0.003 for integrated dose in silicate glasses higher than 5.58 x 10⁸ Gy. This result can be correlated to a decrease of the number of Ti3+ ions
in the sI site (g// ≈ 1.963 and g┴ ≈ 1.855) when the integrated dose is in the order of
the giga-gray. At these higher integrated doses, migration of alkaline ions under
be correlated to the migration of alkaline ion acting as charge compensator of the Ti3+
ions in this environment. Thus, this result could imply that the coordination number of
Ti3+ ion in sI site is greater than the coordination number of both Ti3+ in sII and sIII
sites.
3.3. Post irradiation ageing processes.
The figure 3 presents the EPR spectra of the S20 and S80 samples recorded just
after their -irradiation at 3.23 x 10⁷ Gy and 165 days later. No significant changes are analyzed on the EPR spectra of the S20 sample as a function of the ageing time.
By contrary for the S80 sample, we observe an important modification of the Ti3+
EPR signal mainly correlated to the intensity decrease of the sI component. The
glass sample ageing is also associated to a visible leaching of the S80 surface
sample. Glass corrosion by water leads to three different kinds of process [27, 28]:
hydration, hydrolysis and ionic exchange. In particular, ionic exchange between Na+
and H+ ions during ageing processes lead to a decrease of the charge compensation
intensity around Ti ions and thus, to a reorganization of Ti3+ environment. In the
present case, we interpret this reorganization as a decrease of the coordination
number around Ti3+. The similarities between the evolutions of the EPR spectrum of
Ti doped silicate glass irradiated at high-dose (close or higher to 1 x 10⁹ Gy) showed
on figure 2 and after a 165 days ageing presented on figure 3 confirm that the sI site
of Ti3+ ions has a higher coordination number than the other Ti3+ sites in the
irradiated silicate glasses studied in this work.
Using our previous observations on figures 1-3, we tried to reproduce the
experimental EPR spectra of all our samples -irradiated at different doses between 3.24 x 10⁶ and 1.68 x 10⁹ Gy. To determine the EPR parameters of the sI site, we
substract the EPR spectra obtained 165 days after irradiation to the EPR spectra
recorded just after irradiation. For the other sites, we tried different assumptions and
we only kept the solution which reproduce the better all our EPR spectra. We
conclude to the existence of three different EPR sites of Ti3+ determined by the EPR
parameters given in table 2. Figure 4 shows for example the experimental X-band
EPR spectrum, the three sI, sII and sIII components used to obtain the simulated
spectrum and the total simulated spectrum defined by the sum of the sI, sII and sIII
components for the S80 sample.
The obtained sI, sII and sIII EPR spectra are very close to some results already
reported in previous studies. For example, S. Arafa and F. Assagbhy [26] observed in
X-irradiated SiO2 – Na2O – TiO2 glasses an EPR spectrum characterized by g┴ =
1.9693 and g// = 1.9413 very similar to our sI spectrum. H. Böhm and G. Bayer [29]
also obtained a similar spectrum defined by g┴ = 1.970 and g// = 1.930 by studying
the [VI]Ti3+ formed under reducing atmosphere in Mg2TiO4 crystals. V. Laguta et al.
[30] reported the EPR spectrum of Ti3+ ions surrounded by five oxygen atoms and
one oxygen vacancy in PbTiO3 crystals. Their spectrum, characterized by g1 = 1.965;
g2 = 1.919 and g3 = 1.848 is very close to our sII spectrum. And H. Böhm and G.
Bayer [29], also published the EPR spectrum of Ti3+ in La2TiO5 crystals which is close
to our sIII spectrum. All theses previous studies supports the simulation solution we’ve
kept. However the shape of the simulated EPR spectra will be discussed in section 4.
By a double integration of the simulated EPR spectra, we can obtain the proportion of
Ti3+ ions in each titanium site inside the glass. Figure 5 presents the evolution of the
mean proportion over all samples of Ti3+ ions in each site as a function of the total
integrated dose (in log. scale). According to this figure, the Ti3+ ions produced during
ionizing radiation in the silicate glasses are mainly in the sIII site followed by the sII
site and finally the sI site which is only observed in the S68 and S80 samples.
Moreover, Ti3+ ions content in the sI site seems to be constant or, as we observed in
figure 2, decreases when the dose is close or higher than the giga-gray. As we
already said, some of our samples have the same chemical composition as samples
already studied in previous works. First of all, N. Ollier et al. [1] showed by XANES
spectroscopy the existence of a mixture of [V]Ti4+ and [VI]Ti4+ in a sample very close to
our S68 sample but with a [Na]/[Ti] ratio equals to 66. More precisely, in his XANES
spectroscopy study [21], F. Farges concludes to the existence in the S10 sample of
80 % of [V]Ti4+ and 20 % of [VI]Ti4+. Depending on the total integrated dose, we
observe in the S10 sample from 20 to 30 % of Ti3+ ions in the sII site and from 70 to
80 of Ti3+ ions in the sIII site. In the case of the S20 sample, F. Farges concluded to
the existence of 85% of [V]Ti[4+] and 15% of [VI]Ti4+. In figure 5, we observe from 80 to
90% of Ti3+ ions in the sIII site and from 10 to 20% of Ti3+ ions in the sII site. With the
assumption of a direct reduction from Ti4+ to Ti3+ for doses lower than 1 x 10⁹ Gy, we
must emphasize the similarities between 1) the quantities of [V]Ti4+ and the quantities
of Ti3+ ions in the sIII site and 2) the quantities of [VI]Ti4+ and the quantities of Ti3+ ions
in the sII site. Then, we conclude that the Ti3+ ions in the sIII site comes from the
reduction of [V]Ti4+ ions and the Ti3+ ions in the sII comes from the reduction of [VI]Ti4+
4. Discussion
Previous works in literature have mainly concluded to the presence in glasses of Ti3+
ion in an octahedral environment even if authors observe large differences in g
tensor values derived from the studies. For example, Y. Kim and P. Bray analyzed in
-irradiated K2O – TiO2 glasses [31] an [VI]Ti3+ EPR spectrum characterized by g┴ =
1.975 and g// = 1.890. S. Arafa and A. Bishay [32] attributed also to [VI]Ti3+ a very
symmetric Ti3+ EPR spectrum characterized by g ≈ 1.942 in -irradiated B2O3 – CaO
– TiO2 glasses. However, our EPR results suggest the existence of different Ti3+ sites
relative to different coordination numbers for Ti3+ ions. As shown in § 3.2, the
modifications of the EPR spectrum for the samples irradiated at the highest doses
suggest a relation between the existence of Ti3+ ions in the sI site and the number of
sodium ions available for charge compensation. This is confirmed by the fact that we
observe this site only on the EPR spectra of the samples with the highest [Na]/[Ti]
ratio (e.g. S68 and S80) and by the lower stability of this site during leaching (§ 3.4).
We concluded that the coordination of the titanium ions in the sI site is higher than
the coordination of Ti3+ ions in the sII and sIII sites. To our knowledge, the higher
observed coordination number for Ti3+ ions is VI. Thus, we attribute the sI site to
[VI]
Ti3+ ions.
F. Farges [21] has proposed a possible square based pyramidal environment ([V]Ti4+)
in silicate glasses. In this coordination number [13, 16, 21], the [V]Ti4+ ions
environment is characterized by one Ti = O titanyl bond and four Ti – O bonds. The
assumption of a direct reduction processes for Ti doped silicate glasses studied in
this work suppose production of [V]Ti3+ ions in this square pyramidal environment.
linewidth of this Ti3+ site. The width of Ti3+ EPR line may be understood as the result
of a g-strain process (i.e. a distribution of the g-values) [24]. This distribution traduces
the variation of the environment of the paramagnetic ion along specific directions of
the g tensor. Thus, we could therefore correlate the particular shape of the sIII EPR
spectrum (Table 2, Fig. 4) characterized by a small width (0.00515 cm-1) for the gz
component of the Ti3+ powder spectrum in comparison to the gy (0.06273 cm-1) and
gx (0.13127 cm-1) width values to [V]Ti3+ ions in square base pyramidal environment.
Moreover, [V]Ti3+ ions were already observed in some previous studies, for example
by M. Nolan et al. [33] in non-stoechiometric TiO2 rutile.
The site sII is more difficult to associate with a coordination number around Ti3+ ions.
As we said it, we concluded that the coordination number associated to sI is higher
than the coordination number associated to the sII site. However, we observed by
studying the proportions of Ti3+ in each site (§ 3.5) that sII may correspond to a
coordination number of VI. To explain this apparent discrepancy of our results, we
propose to associate the sII site of Ti3+ with a coordination number of V in a trigonal
bi-pyramid shape (i.e. an octahedron with an oxygen vacancy). Such geometry was
for example already observed for Ti4+ in La2TiO5 crystals and it is consistent with the
EPR results of V. Laguta et al. [30]. F. Farges [20] didn’t take into account this
geometry in his XANES study because it is less common to observe Ti4+ in trigonal
bi-pyramide than in square pyramid. Moreover, his results are defined with a 10 % error. Thus, we can assume that the trigonal bi pyramid geometry is an intermediary
case between the octahedron and the square pyramid which was not taken into
account in the previous studies. This may explain the apparent discrepancy between
our results. However, because figure 5 shows different slopes of reduction, it may
sites and on the integrated dose. This different reduction efficiency may change our
result, especially concerning the total Ti3+ ions quantities. This problem must be
taken into account for our next studies.
5. Conclusion
We studied in this work by X-band EPR spectroscopy and simulation of EPR spectra the environment of Ti3+ ions produced under -irradiation in Ti-doped SiO2
– Na2O – TiO2 glasses. We conclude to the existence of three different Ti3+ EPR
sites, denoted sI, sII and sIII. The first one, sI ( g// = 1.970 and g┴ = 1.939), is
associated to a [VI]Ti3+ in an octahedron of oxygens and is observed only when the [Na]/[Ti] ratio of the glass is higher or equal to 68 and the integrated dose less than 1 x 10⁹ Gy. The second site, sII (g1 = 1.868, g2 = 1.904, g3 = 1.965) is
attributed to a Ti3+ ion in a trigonal bi-pyramid environment. The last one, sIII(g1 =
1.763, g2 = 1.863, g3 = 1.936), is dominant (80 % of the total amount of observed
Ti3+ ions) and corresponds to a [V]Ti3+ ion in a square pyramid of oxygens. The sII
and sIII sites are observed for all values of the [Na]/[Ti] ratio.
6. Acknowledgements
We sincerely thanks T. Pouthier and V. Metayer (LSI, Ecole Polytechnique, France) for their kind help during synthesize irradiation and study of the samples.
7. References
[1] N. Ollier, P. Lombard, F. Farges, B. Boizot, Journal of Non Crystalline Solids, 354, 480 (2008).
[2] E. Malchukova, B. Boizot, G. Petite, D. Ghaleb, Journal of Non-Crystalline Solids
353, 2397 (2007).
[3] B. Boizot, F.Y. Olivier, G. Petite, D. Ghaleb, Nuclear Instrument and Methods in Physics Research B 266, 2966 (2008).
[4] F.Y. Olivier, B. Boizot, D. Ghaleb, G. Petite, Journal of Non-Crystalline Solids 351, 1061 (2005).
[5] B. Boizot, G. Petite, D. Ghaleb and G. Calas. Nuclear Instrument and Methods in Physics Research B 141, 580 (1998).
[6] N. Ollier, B. Champagnon, B. Boizot, Y. Guyot, G. Panczer and B. Padlyak, Journal of Non Crystalline Solids 323, 200 (2003).
[7] B. Boizot, N. Ollier, F. Olivier, G. Petite, D. Ghaleb and E. Malchukova. Nuclear Instrument and Methods in Physics Research B 240, 146 (2005).
[8] B. Boizot, G. Petite, D. Ghaleb, B. Reynard and G. Calas, Journal of Non Crystalline Solids 243, 268 (1999).
[9] N. Ollier, B. Boizot, R. Reynard, D. Ghaleb and G. Petite, Journal of Nuclear Materials 340, 209 (2005).
[10] B. Boizot, G. Petite, D. Ghaleb, N. Pellerin, F. Fayon, B. Reynard and G. Calas, Nuclear Instruments and Methods in Physics Research B 166, 500 (2000).
[11] D. Neuville, L. Cormier, B. Boizot, A. Flank, Journal of Non Crystalline Solids,
323, 207 (2003).
[12] R. Greegor, F. Lytle, D. Sandstrom, J. Wong and P. Schultz, Journal of Non Crystalline Solids 55, 27 (1983).
[13] F. Farges, G. Brown, E. Navrotsky, H. Gan and J. Rehr, Geochimica et Cosmoschimica Acta 60, 3039 (1996).
[14] G. Henderson and J. St – Amour, Chemical Geology 213, 31 (2004).
[15] G. Henderson and M. Fleet, Journal of Non Crystalline Solids 211, 214 (1997). [16] F. Farges, G. Brown and J. Rehr, Geochimica and Cosmochimica Acta 60, 3023 (1996).
[17] F. Farges, Journal of Non Crystalline Solids 244, 25 (1999).
[18] G. Henderson, X. Liu and M. Fleet, Mineralogical Magazine 67, 597 (2003). [19] B. Mysen and D. Neuville Geochimica and Cosmochimica Acta 59(2), 325 (1995). [20] G. Henderson, The Canadian Mineralogist 33, 399 (1995).
[21] F. Farges. American Mineralogist 82, 36 (1997).
[22] A. Abragam and B. Bleaney. Electron Paramagnetic Resonance of transition
ions. Clarendon Press, 1970.
[23] G. Morin and D. Bonnin. Journal of Magnetic Resonance 136, 176 (1999).
[24] A. Weil, J. Bolton and J. Wertz. Electron Paramagnetic Resonance. Wiley Interscience, 1994.
[25] N. Iwamoto, H. Hidaka and Y. Makino. Journal of Non-Crystalline Solids 58, 131 (1983).
[26] S. Arafa and F. Assabghy. Journal of Applied Physics 45(12) 5269 (1974). [27] C. Cailleteau, C. Weigel, A. Ledieu, P. Barboux and F. Devreux. Journal of Non-Crystalline solids 354, 117 (2008).
[28] B. Bunker. Journal of Non-Crystalline Solids 179, 300 (1994).
[29] H. Bohm and G. Bayer, Journal of Non Crystalline Solids, 31, 2125 (1970). [30] V. Laguta, M. Glinchuk, I. Bykov and Y. Maksimenko, Physical Review B 54, 12353 (1996).
[31] Y. Kim and P. Bray, The Journal of Chemical Physics 53, 716 (1970). [32] S. Arafa and A. Bishay, Physics and Chemistry of Glasses 11, 75 (1970).
[33] M. Nolan, S. Eliott, J. Mulley, R. Benett, M. Basham and P. Mulheran, Physical Review B 77, 235424 (2008).
Figure captions
Figure 1. X-band EPR spectra recorded at 20 K of SiO2 – Na2O – TiO2 glasses
-irradiated at 3.23 x 10⁷ Gy. The g values indicated in the figures correspond to the minima or maxima of the different Ti3+ EPR lines.
Figure 2. X-band EPR spectra recorded at 20 K of the S20 and S80 samples non-irradiated and -irradiated at different doses between 3.24 x 10⁶ and 1.68 x 10⁹ Gy. The g values indicated in the figures correspond to the minima or maxima of the different Ti3+ EPR lines.
Figure 3. X-band EPR spectra at 20 K of the S20 and S80 samples recorded just after (“initial”) and 165 after -irradiation at 3.23 x 10⁷ Gy. The g values indicated in the figures correspond to the minima or maxima of the different Ti3+ EPR lines.
Figure 4. Experimental, simulated and components of the X-band EPR spectrum of the S80 sample -irradiated to 3.24 x 10⁷ Gy.
Figure 5. Mean proportion of the number of Ti3+ ions in the sI, sII and sIII sites
identified in -irradiated titanium doped silicate glasses as the function of the dose integrated.
Tables
Sample [SiO2] [Na2O] [TiO2] [Na]/[Ti] Ref.
S10 76 20 4 10 [21]
S20 78 20 2 20 [21]
S40 79 20 1 40 -
S68 65 34 1 68 [19]
S80 59 40 1 80 -
Table 1. Samples composition. All quantities are in mol%.
Site g1 g2 g3 s0 s1 s2 sI 1.939 1.970 0.00282 0 0 sII 1.868 1.904 1.965 0.00363 0.03107 0.02088 sIII 1.763 1.863 1.936 0.00514 0.13127 0.06273
Table 2. EPR parameters determined by simulation for the three Ti3+ sites observed in -irradiated SiO2 – Na2O – TiO2 glasses. The s0, s1 and s2 width are