READ THESE TERMS AND CONDITIONS CAREFULLY BEFORE USING THIS WEBSITE. https://nrc-publications.canada.ca/eng/copyright
Vous avez des questions? Nous pouvons vous aider. Pour communiquer directement avec un auteur, consultez la première page de la revue dans laquelle son article a été publié afin de trouver ses coordonnées. Si vous n’arrivez pas à les repérer, communiquez avec nous à PublicationsArchive-ArchivesPublications@nrc-cnrc.gc.ca.
Questions? Contact the NRC Publications Archive team at
PublicationsArchive-ArchivesPublications@nrc-cnrc.gc.ca. If you wish to email the authors directly, please see the first page of the publication for their contact information.
NRC Publications Archive
Archives des publications du CNRC
This publication could be one of several versions: author’s original, accepted manuscript or the publisher’s version. / La version de cette publication peut être l’une des suivantes : la version prépublication de l’auteur, la version acceptée du manuscrit ou la version de l’éditeur.
Access and use of this website and the material on it are subject to the Terms and Conditions set forth at
Use of field vane tests under earth-structures/ Utilisation des essais
in-situ au scissometre sous des ouvrages en terre
Law, K. T.
https://publications-cnrc.canada.ca/fra/droits
L’accès à ce site Web et l’utilisation de son contenu sont assujettis aux conditions présentées dans le site
LISEZ CES CONDITIONS ATTENTIVEMENT AVANT D’UTILISER CE SITE WEB.
NRC Publications Record / Notice d'Archives des publications de CNRC:
https://nrc-publications.canada.ca/eng/view/object/?id=a9359092-04e5-4049-9dfa-e1f6bb7f88ca
https://publications-cnrc.canada.ca/fra/voir/objet/?id=a9359092-04e5-4049-9dfa-e1f6bb7f88ca
Ser
THl
N21d
National Research
Conseil national
1326
Council
Canada
da recherche8 Canada
c,
2
BLDG
Division of
Division des
- --
Building Research
recherches en bWiment
Use
of
Field Vane Tests under
Earth-Structures
by K.T.
Law
Reprinted from
Xlth International Conference on Soil Mechanics
and Foundation Engineering
San Francisco, CA, 12
-
16 August 1985
Proceedings, Vol. 2,
p.
893-898
(DBR Paper No. 1326)
Price $2.00
NRCC 25043
Les r6sultats d'essais au scissom2tre men&
dans des digues
rgalisges sur dif
f
grents sols argileux sont 6tudi6s.
Les
r6sistances au cisaillement mesur6es sont demeur6es stables ou
ont augmentg, comparativement aux rgsistances d'avant la
construction.
Les augmentations de la rgsistance sont
associges aux zones de grande charge ou aux couches
compressibles relativement minces; les faibles augmentations
sont associ6es aux zones de petite charge ou aux couches
compressibles relativement minces.
Le ratio
r&sistance/contrainte verticale rgelle sous les ouvrages en
terre existant est moindre qu'avant la construction dans tous
les cas.
Des essais en laboratoire des sols de certains ouvrages gtudigs
ont
Bt6
men& 3 titre de compl6ment servant 3 mieux comprendre
les rgsultats des observations sur
le
terrain.
On
discute
ensuite des cons6quences pratiques et on 6tablit des principes
directeurs pour l'utilisation des essais in situ au scissom2tre
aux fins d'estimations des variations
de
la rgsistance.
Use
of
field vane tests under earth-structures
Utilisation des essais in-situ au scissornetre sous des ouvrages en terre
K. T. LAW, Research Officer, National Research Council of Canada, Division of Building Research, Ottawa, Canada
SYNOPSIS This paper reviews the results of field vane tests conducted through existing
embankments constructed over a variety of soft clays. The shear strengths determined from the vane tests, when compared with the preconstruction values, increased or remained unchanged. Strength increases are associated with large loading areas or relatively thin compressible layers while little or no strength increase is associated with small loading areas or relatively thin compressible layers. In all cases the strength to effective vertical stress ratio under the existing earth-structure is less than that before construction.
Laboratory tests on soils from some of the studied cases have been carried out to help understand field observations. Practical implications are discussed and guidelines are drawn for using field vane tests to estimate strength changes.
INTRODUCTION CASE RECORDS
The field vane test has been used for 30 years to measure the strength of soft clays. It was introduced to avoid the soil disturbance that occurs when taking samples for laboratory testing. Initial experience with the vane test was satisfactory (Eden and Hamilton, 1956). Bjerrum (1972), however, showed that the vane strength was generally higher than the
available strength in the field. He proposed a correction curve expressed in terms of
plasticity index, based on actual embankment failure records. These were first-time
failures in which the natural soil had not been subjected to any previous man-made loading. In spite of some criticism (Schmertmann, 1975), Bjerrum's method of correction has gained wide acceptance for design and analysis.
There are a growing number of situations in which strength measurements are required after a man-made earth-structure is built. This includes stage construction on weak ground and design review of existing dams. In each situation, a unique loading condition is
imposed so that the soil will no longer respond to further load according to first-time loading behaviour. Whether Bjerrum's correction is still applicable is a question that needs to be studied.
Published results of shear strength changes determined by vane tests under existing earth-structures fall into two separate categories. The first group consists of definite vane strength gains while the second shows zero strength change. The majority of the earth-structures were founded on lightly overconsolidated soils with loads exceeding the preconsolidation pressure throughout or in part of the subsoils. The soil information
pertaining to the layers stressed to the normally consolidated state and the
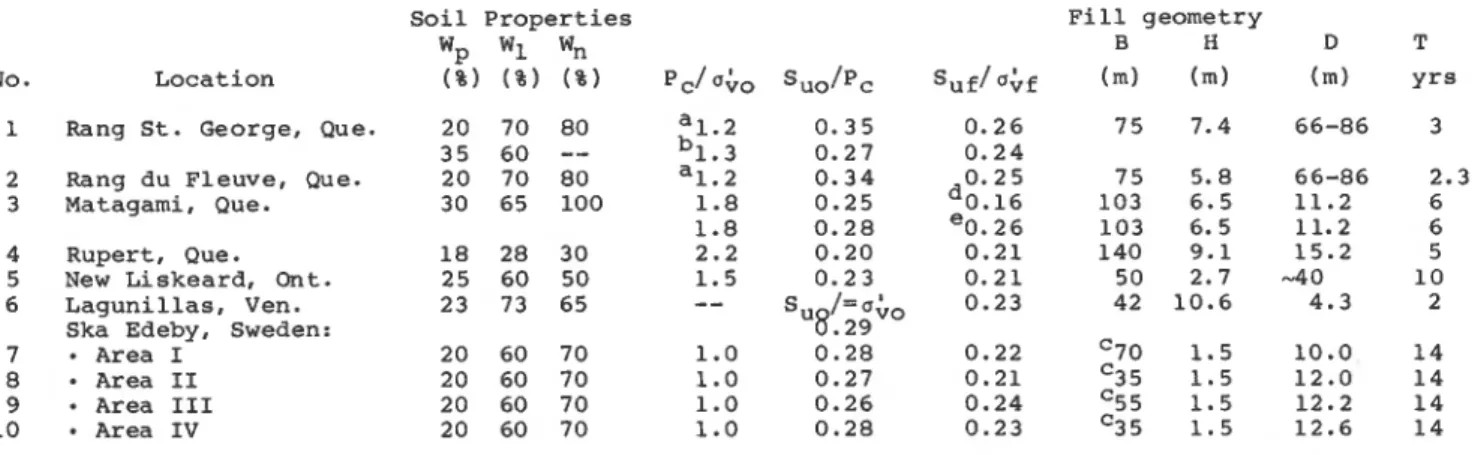
earth-structure geometry are summarized in Table I and Table 11. Tlie following symbols are used in the tables:
T = time after completion of the earth-structure through which the vane shear test was conducted; Pp
-
= preconsolidation pressure;u;,, o i f = vertical effective pressure before -
construction and at time T, respectively:
SUo, SUf = vane strength before construction and at time T, respectively; B, H = total width and height of the
earth-structure, respectively; D = thickness of soft clay.
This paper summarizes field experience with the (a) Cases with vane strength increase vane to measure strength under existing
earth-structures. This is followed bv a The fills at Rang St-George and Rang du
laboratory study on the factors influ&cing the Fleuve, Quebec (~avenas et al, 1978) were
vane strength. Based on the field and founded on a layer of 12 m thick lacustrine
laboratory studies, some guidelines are drawn deposits, above a thick layer of Champlain Sea.
for using the vane shear test to detect clay. Berms, 2.5 m high and 20 m wide, were
Table I Soil information and fill geometry for cases with vane strength increases NO. 1 2 3 4 5 6 7 8 9 10 Location Rang St. George, Que. Rang du Fleuve, Que. Matagami, Que. Rupert, Que. New Liskeard, Ont. Lagunillas, Ven. Ska Edeby, Sweden:
Area I Area I1 Area I11 Area IV Soil Properties Wp W1 Wn ( 8 )
( $ 1
( % ) Fill geometry B HNote: a
-
lacustrine clay: b-
marine clay; c-
circular fill; d-
under centre; e-
under bermTable I1 Soil information and fill geometry for cases with no vane strength increase
Soil Properties Fill geometry
Wp W1 Wn B H D T
Location
% I
%( % I
pc/aG0 SUo/pC SUf/oGf (m) (m) (m) (yrs)Gloucester, Ont. 20 50 70 1.4 0.37 0.27 20.1 3.65 20.1 8
Boundary Road, Ont. 20 50 70 1.6 0.35 0.28 24.4 4.27 21.3 5
Kars, Ont. 20 40 60 2.3 0.24 0.19 48.2 7.92 16.8 16
Ska-Edeby, Sweden 20 60 70 1.0 0.23 0.15 8.5 1.50 15.2 10
The test embankment near Matagami, Quebec was built to study the Sehaviour of the underlying lacustrine deposit upon which numerous dykes and dams would be constructed in connection with the James Bay hydroelectric power project. The strength measurement through and outside the fill were reported by Eden and Law (1980). The test embankment at Rupert, Quebec, was built on a soft marine deposit of low
plasticity. The purpose was also to provide design information for the James Bay
hydroelectric power project. Two berms were placed on each side of the embankment which reached a maximum height of 9.1 m. A part of the embankment was deliberately failed and documented by Dascal and Tournier (1975). The approach fill in New Liskeard (Lo and Stermac, 1965; Stermac et al, 1967) was built on a deep deposit of varved clay. The original plan called for a maximum fill height of 10 m. Stage construction was adopted but part of the fill failed at 5.5 m before reaching the intended first stage height of 6.1 m. The excess pore water pressure measured under the rest of the fill remained high and dissipated very slowly over a period of two years. The fill was subsequently lowered to 2.7 m; from this the results shown in Table I were obtained.
The Lagunillas preload, Venezuela la am be, 1962 and 1973) was used to improve the ground condition to support heavy process tanks. The
subsoil consisted of 5.3 m of silt underlain by 4.3 m soft clay. The full preload was applied in three stages over a period of almost one year. Vane strength gains were detected under the preload at different times after the commencement of construction.
The test field at Ska-Edeby, Sweden, was
comprised of four circular loaded areas and one test embankment (Holtz and Lindskog, 1972; Holtz and Broms, 1972). Sand drains of
different spacings were installed through three of the circular fills. In 1957 the circular fills were built to a load of 27 kPa except for Area I11 which had the same load under the berm but 39 kPa under the centre. The test
embankment was constructed four years later using materials from unloading the Area I11 fill to the berm level. In 1971, vane tests were conducted through the fills and the
embankment. Strength gains were measured under all the circular fills but no strength change was detected under the embankment although the excess pore pressures under it were
dissipated.
(b) Cases with no vane strength increase The Gloucester test fill (Bozozuk and
Leonards, 1972; Law et al, 1977) was built over a soft, highly sensitive Champlain Sea clay deposited in several stages. .The top 6 m was
stressed to about 40% beyond the
preconsolidation pressure. Vane tests through the centre of the fill eight years after construction showed no vane strength increase.
Triaxial undrained tests, however, on samples taken from under the fill at the time of the vane testing showed a definite strength increase. Settlement observations and
measurement of the change of moisture content supported the triaxial test results.
The Boundary Road approach fill (Law et al, 1977) was founded on material similar to that of the Gloucester test fill. Vane tests were conducted through the shoulder of the fill under which the top 8 m was stressed beyond PC.
The Kars bridge approach fill (Eden and Poorooshasb, 1968: Law et al, 1977) was constructed over 17 m of soft Champlain Sea clay, the top 6 m of which consisted of a weathered crust. Again, no vane strength increase was detected 16 years after
construction even though the triaxial tests and moisture change measurements indicated a
definite strength increase.
The test embankment at the Ska-Edeby test field was described earlier.
(c) General observations
The following general observations may be made from Tables I and 11.
1) For soil stressed to the normally
consolidated state under fills, the vane shear strength increase does not depend on plasticity index, overconsolidation ratio, or length of time (less than 16 years) after completion of construction.
2) Vane shear strength increases are found under fills with a wide base ( ~ / ~ > 1 0 ) or in thin compressible layers. The final strength ratio, Suf/ubf, in these cases are generally smaller than the corresponding values, SUo/Pc or ~ ~ ~ for normally consolidated soil, / u ; ~ before construction.
3) No vane shear strength increase is found under fills with a narrow base or in thick compressible layers even though the triaxial tests may indicate the existence of a strength gain.
It appears therefore that the vane shear
strength increase is related to the geometry of the fill. In general for a given fill height, the base width has less effect on the vertical stress increase than on the horizontal stress increase. Hence the vane shear strength
increase may be strongly affected by the change of horizontal stress. In addition, the
relative degree of rate effect for first-time loading and for post first-time loading need to be understood. These aspects were studied in the laboratory and are reported in the next section.
TRIAXIAL-VANE TESTS
The study was carried out using a triaxial-vane machine built by combining the triaxial cell
and the laboratory vane shear machine. It enabled different consolidation pressures to be applied on a soil sample in which a vane test could be conducted at different shear rates. A detailed description of the device was given by Law (1979).
The first test series was performed on soils from Gloucester and Matagami. Two
consolidation pressures were applied to the soils, one at the in situ pressure and the other beyond the preconsolidation. For each consolidation pressure, tests were run at different rates to study the time effect. The second test series was conducted on soils from Boundary Road and Matagami. Varying isotropic consolidation pressures coy) were applied and the vane test was conducted at a constant rate that led to failure in about
15 minutes.
The third series was carried out on the Gloucester soils under isotropic and anisotropic consolidation. The isotropic consolidated tests were similar to the first test series. In the first part of the
anisotropic tests, the vertical consolidation pressure (u;,) was kept constant while the
. -
horizontal consolidation pressure ( m i , ) was varied. In the second part, uAc was kept constant while IJ;pressure was changed. ,
The results of the first test series on rate effect are shown in Figs. 1 and 2 where the measured strength is plotted against the time to reach failure. The strength is normalized by the value corresponding to a failure time of 10 minutes. There is a general decrease of strength with increase of time to failure or decrease of shear rate. The rate of strength decrease at the in situ pressure and at the normally consolidated state are 11% and 5.5% per log cycle of time, respectively. This difference in rate effect is related to the relative magnitude of the cohesive component of the undrained strength. At the in situ
pressure or under first-time loading, the cohesive component is high because of
overconsolidation and aging processes since the soil was deposited. At the normally
consolidated state or under man-made loading
-A- -' = A A GLOUCESTER CLAY A\ A MATAGAMI CLAY
TIME TO FAILURE, min
Fig. 1 Vane shear strength variation with time at in situ consolidation pressure
CONSOLIDATION PRESSURE, kPa
*
130-I'
&
120-f
f
110 U)f i l m -
N, 90-Z
0=
80..
I I 1 I I I I MATAGAMI 0 BOUNDARY ROAD-
-
-
-.-I
*/
(/
,,
-
O ~ - ' O ~ - - o " ~ pc-
-
I I I I I I ICONSOLIDATION PRESSURE, kPa
,
I I, ,,,,
I I 1 11 1 1 1 1 I I r I I I ~ GLOUCESTER CLAY 0 MATAGAMI CLAY-
-
@ -0-
Fa
I
-
*
.
-rb I I I I I I Y I I I I I r 1 r 1 1 l I I I I I I I LFig. 3 Triaxial-vane strength versus
consolidation pressure
1 10 100 1000 X
2
TIME TO FAILURE, min K I-Fig. 2 Vane shear strength variation with time 10
for a limited time, the effects of
overconsolidation and aging are removed hence the cohesive component diminishes.
Consequently the rate effect, which is mainly associated with the cohesive component, will be reduced at the higher pressure.
-
I I I I I 1 140
The results of the second test series are shown in Fig. 3 where the measured strength is
plotted against the isotropic consolidation
pressure. Near the in- situ pressure, the
strength either remains constant or increases slightly with consolidation pressure. At a pressure slightly less than the
preconsolidation pressure P the strength
C'
at normally consolidated state 20 40 60 80
2
Y2
I- 0 30- K+
M W2
>
1
20-9
starts to increase steadily. This change of rate of strength increase is caused by the destruction of bond or cementation in the clay structure.
1 I
BDTH
&
& u:=VARYING, # 0 )
a
q;c VARYING-
/'
,mmCONSTANT.
/'
a
pa
Zd,.
CONSTANT p,VARYINGFig. 4 Variation of triaxial-vane strength with anisotropic consolidation pressure
shear strength increases with 0;. The same is
also true with okc when a;, is kept constant.
Under constant u,", however, the vane shear strength hardly increases with a;,.
While it is expected that the vane shear strength should increase with o' or u,", the
lack of increase with can be explained by
.
-
the fact that the bulk of the resistance to a standard vane comes from the vertical face of the cylinder circumscribed by the vane
rotation. The strength on this vertical face is dependent on
01;'.
When uic is keptconstant, the overall vane shear strength therefore hardly changes despite an increase in u. - . This probably explains the lack of a vane shear strength increase noted in the above records in which the base width is relatively narrow, a condition leading to only a small increase of horizontal stress.
DISCUSSION
(a) Anisotropy of vane shear strength Many soft clays display undrained strength
anisotropy. If
S,,
and Sv are the strengths onthe horizontal and vertical failure surfaces, respectively, the standard vane, with a height-to-diameter ratio of 2, measures an overall strength S given by: u
The results of the third test series is shown
Based on Bjerrum's work (1973) on first-time loading, this ratio varies from 1.0 to 2.0 depending on plasticity. It will be higher after the first-time loading because the ratio of vertical effective stress increase to
horizontal effective stress increase is greater (hence higher sh/sv) than before. It can also
.- .
be deduced from the same work (Bjerrum, 1973). that higher sh/sV leads to larger underestimation of the strength available in the field.
(b) Bjerrum's (1972) reduction factor Bjerrum's reduction factor II was based on three processes involved in first-time loading failures: rate effect, strength anisotropy, and progressive failure. The effects of these processes are changed substantially after first-time loading. As shown earlier, the rate effect will be reduced: anisotropy leads to a greater strength underestimation and
progressive failure will be less significant as more plastic behaviour prevails at the normally consolidated state. All these processes
together tend to bring the vane shear strength closer to the field strength. The factor, therefore, will be too severe to apply directly to the vane shear strength measured some time after construction.
(c) Horizontal stress increase under earth-structures
Calculations were carried out using the
elastic analysis of Poulos and Davis (1974) for the post first-time loading condition. The results were expressed in terms of R where R is the ratio of the horizontal stress increase under a fill to that under a truly
one-dimensional state. For fills with a wide base (~/H>10) on a thin compressible layer
(D/B<O. 25), R was about 0.9. Decreasing D/B did not significantly change this value.
Increasing D/B decreased the value of R, but at depths between the surface to two times the fill height, R remained closed to 0.9. For a narrow base (B/Hc6) on a thick compressible layer, R was less than 0.6.
(d) Limits of strength changes under fills with a wide base
Upper and lower limits can now be established for ~ ~ ~ for design with post first-time / u i ~ loading conditions. Figure 5 illustrates the change of vane strength under one-dimensional consolidation. The initial vane strength SUo is assumed constant from ubo to PC. Beyond PC the effects of overconsolidation and aging are obliterated and the strength starts to rise w i t h u i a t a r a t e s uf/uvf
'
-
-
Suo/Pc. In the field situation, however, Suf/uif is always smaller than SUo/P because the one-dimensional condition is seldom completely reached, hence suf/uif c SUo/pc. This is substantiated by the data in Table I.The lowest possible limit for SUf/uif
- -
corresponds to the condition where B j errum's reduction factor and the influence of
horizontal stress are both operative. This is given by Suf/uif > 0.9 p SUo/pc where the factor 0.9 denotes that the effective
horizontal stress increase under fills with a wide base is about 90% of that under
one-dimensional consolidation.
The range for Suf/uif applicable for designing stage constructions is therefore given by
If S /uio falls within the limits, no uf correction is required. A comparison of Suf/ubf and 0.9 SUo/Pc based on data from Table I is shown in Fig. 6. For most cases,
Q;O PC
Qh
VERTICAL EFFECTIVE STRESS, a:
Fig. 5 Idealized strength variation with vertical effective stress under o n e dimensional- consolidation condition
0 9 0 4 0 1
---
LOWER LIMITy
7.8 0 6 0 3 0.8 PLASTICITY INDEX, %Fig. 6 Measured strength ratio, Suf/u&, under fill compared with theoretical lower limit. Note: numbers refer to cases listed in Table I
including under the berm of Matagami fill, Expression (2) appears to apply except under the centerline of Matagami fill. There, soil variability may be the explanation.
SUMMARY AND CONCLUSIONS
The use of the field vane test under existing
earth-structures has been reviewed in this
paper. The case records show that the geometry of the structure is an important factor
affecting the interpretation of the standard vane with a height-to-diameter ratio of 2.
Cases with a narrow base (B/H < 6) founded over
a thick compressible layer (H/B > 1) show no vane shear strength increase even if other evidence may indicate an increase. Cases with
a wide base (B/H > 10) show apparent vane shear
strength increases with a strength ratio, suf/ubf, less than the initial value, SUo/Pc. The geometry factor suggests that the
horizontal stress increase imposed under the structure is of great importance and this is confirmed by the triaxial-vane test results. The analysis of the field and laboratory data leads to the following suggestions for using the field vane test beneath structures: 1) The field vane test is not reliable for
cases with a narrow base at least for a period of 16 years after construction. 2) The field vane test may be used for cases
with a wide base. The measured strength need not be reduced by Bjerrum's (1972)
reduction factor p and the strength ratio
suf/uif should fall within the limits of
Expression (2).
ACKNOWLEDGEMENTS
The laboratory testing was conducted by B. Bordeleau, technical officer, Division of Building Research, National Research Council of Canada.
This paper is a contribution from the Division of Building Research, National Research Council of Canada and is published with the permission of the Director of the Division.
REFERENCES
Bjerrum, L. (1972) Embankments on soft ground. ASCE Specialty Conf. on Performances of
Earth and Earth-Supported Structures, ( 2 )
,
1-54, Lafayette, Indiana.
Bjerrum, L. (1973) Problems of soil mechanics and construction of soft clays. Proc. 8th Int. Conf. Soil Mech. Found. Eng., (3), 111-159, Moscow.
Bozozuk, M. and Leonards, G.A. (1972) The Gloucester test fill. ASCE Specialty Conf. on Performance of Earth and
Earth-Supported Structures, (1. l),
299-318, Lafayette, Indiana.
Dascal, 0. and Tournier, J.-P. (1975)
Embankment on soft and sensitive clay foundation. ASCE J. Geo. Eng. Div., (101), GT3, March, 297-314.
Eden, W.J. and Hamilton, J.J. (1956) The use of a field vane apparatus in sensitive clay. Sym. on Vane Shear Testing of Soils. ASTM STP No. 1933, 41-53.
Eden. W.J. and Law, K.T. (1980) Comparison of undrained shear strength results obtained by different test methods in soft clays. Can. Geo. J., (17-3). 369-381.
Eden, W.J. and Poorooshasb, H.B. (1968) Settlement observations at Kars Bridge. Can. Geo. J., (5-11, 28-45.
Holtz, R.D. and Broms, B. (1972) Long-term loading tests at Ska-Edeby, Sweden. ASCE Specialty Conf. on Performance of Earth and Earth-Supported Structures, (1-1). 435-464, Lafayette, Indiana.
Holtz, R.D. and Lindskog, G. (1972) Soil movements below a test embankment. ASCE Specialty Conf. on Performance of Earth and Earth-Supported Structures, (1-11, 273-284, Lafayette, Indiana.
Lambe, T.W. (1962) Pore pressures in a foundation clay. ASCE J. Soil Mech. Found. Eng., (88), SM2, April, 19-48. Lambe, T.W. (1973) Predictions in soil
engineering. Geotechnique, (231, 149-202.
Law, K.T., Bozozuk, M. and Eden, W.J. (1977) Measured strengths under fills on
sensitive clay. Proc. 9th Int. Conf. Soil Mech. Found. Eng., (I), 187-192, Tokyo. Law, K.T. (1979) Triaxial vane test on a soft
marine clay. Can. Geo. J., 9, 313-319. Lo, K.Y. and Stermac, A.G. (1965) Failure of an
embankment founded on varved clay. Can.
Geo. J., (2-3). 234-253.
Poulos, H.G. and Davis, E.H. (1974) Elastic Solutions for Soil and Rock Mechanics.
John Wiley & Sons Inc., New York.
Schmertmann, Z.H. (1975) Measurement of in situ
shear strength. ASCE Specialty Conf. on In Situ Measurement of Soil Properties,
(2 ), 57-148, North Carolina.
Stermac, A.G., Lo, K.Y. and Bamvary, A.K.
(1967) The performance of an embankment on a deep deposit of varved clay. Can. Geo. J., (4.11, 45-61.
Tavenas, F.A., Leroueil, S., Blancket, R., and Garneau, R. (1978) The stability of stage constructed embankments on soft clays. Can. Geo. J., (15), 283-305.