HAL Id: cea-02549096
https://hal-cea.archives-ouvertes.fr/cea-02549096
Submitted on 21 Apr 2020
HAL is a multi-disciplinary open access
archive for the deposit and dissemination of
sci-entific research documents, whether they are
pub-lished or not. The documents may come from
teaching and research institutions in France or
abroad, or from public or private research centers.
L’archive ouverte pluridisciplinaire HAL, est
destinée au dépôt et à la diffusion de documents
scientifiques de niveau recherche, publiés ou non,
émanant des établissements d’enseignement et de
recherche français ou étrangers, des laboratoires
publics ou privés.
Dynamic Dispersive Spectrometer using a Fiber Bragg
Grating for High Pressure Measurements
Yohan Barbarin, A. Lefrancois, F. Sinatti, A. Bey, M. Balbarie, A. Osmont, J.
Luc
To cite this version:
Yohan Barbarin, A. Lefrancois, F. Sinatti, A. Bey, M. Balbarie, et al.. Dynamic Dispersive
Spectrom-eter using a Fiber Bragg Grating for High Pressure Measurements. 2016 IEEE SENSORS, Oct 2016,
Orlando, United States. pp.1-3, �10.1109/ICSENS.2016.7808769�. �cea-02549096�
Dynamic Dispersive Spectrometer using a Fiber
Bragg Grating for High Pressure Measurements
Y. Barbarin, A. Lefrançois, F. Sinatti, A. Bey, M. Balbarie, A. Osmont and J. Luc
CEA, DAM, F-46500 Gramat, France
Abstract — A new high resolution dispersive spectrometer has
been developed to measure high pressure shock profiles every 10 ns using long Fiber Bragg Gratings. The performances are compared with a dynamic AWG-based spectrometer. Two small diameter fibers allow inserting in parallel two 50-mm long gratings into the target. The use of slightly chirped gratings provides the localization of the shock-wave along them. Placed along the target axis, a gratings reflected spectrum is “blue shifted”. The FBG’s central wavelength are 1605 nm to cover a pressure range of 0 – 8 GPa. The new spectrometer is based on a femtosecond laser source, a long dispersive fiber and a fast acquisition system with an electrical bandwidth above 30 GHz. The experimental setup was a symmetric impact with 6061T6 aluminum, performed with a 110-mm in diameter single-stage gas gun. An impact velocity of 314 m/s is obtained and generated a sustained level of 2.1 GPa during few microseconds. A resulted Bragg shift of (16 ± 1) nm is measured. The dispersive spectrometer offers much greater resolution than the AWG one which is favorable to retrieve more easily a pressure profile.
Keywords—Fiber Bragg Grating, Shock, Spectrometer, High Energy Material, Femtosecond Laser
I. INTRODUCTION
In the fields of shock waves, new materials are often characterized with a series of expensive experiments. Scientists seek for more information in a reduced number of tests in order to get better equations of state and elastic-plastic behavior parameters. In shock experiments or in shock-to-detonation transition (SDT) the evolution of the pressure level is a very valuable parameter. Typically, it is measured electrically in few points with foil-like gauges [1-3]. The piezoresistive gauge material and its resistance are chosen to cover several pressure ranges up to hundreds GPa. The thickness drives the response time, for example a 100-µm thick one leads to a 100 ns rise time [3]. The drawbacks of these pressure gauges are their sensitivity to electromagnetic fields and their footprint of few mm2.
Fiber Bragg Gratings (FBGs) which are used for decades to monitor strain in buildings or bridges can be a good alternative. The spectrum shifts as a function of the applied pressure and of the fiber orientation [4]. The conventional interrogators can monitor many peak-wavelengths at a rate of a few kHz which is more than enough for such application. In shock experiments, we typically need pressure data acquisition at a rate of 100 MHz and higher. If the fiber is placed in good contact with the shocked material, the shock is transmitted and
the grating optical response changes. A FBG for high pressure profile measurement is an innovative sensor as it offers continuous measurements and it can be considered as non-intrusive. Few groups have already explored this way to study shocks. Initial results were based on discrete optical filters to record few wavelengths [4-6]. Interferometric measurements with an unbalanced Mach-Zehnder fiber interferometer were also demonstrated with short FBGs [7-8]. This method offers a simple data processing but like pressure gauges, the pressure is measured in single points. With the recent bandwidth increase of oscilloscope, dispersive spectrometers become very good candidates to study shocks and other dynamic sensing applications. The method was reported under different names depending of the field of application. The idea remains the same: the wavelength is converted into time using chromatic dispersion. Higher order dispersion can also be taken into account [9-10] but can also be corrected numerically. The accuracy limits of such spectrometer are discussed in [11]. Rodriguez et al. showed in [12] the interest of using such type of spectrometer to study high pressure transitions in inert and energetic materials. In this paper, a dynamic dispersive spectrometer is compared to an AWG–based dynamic spectrometer [13-14] in a shock plate experiment using a long FBG. The final objective is to deduce the pressure profile with the support of 2D-hydrodynamic simulations.
II. SPECTROMETER AND EXPERIMENT DESIGNS A. Concept
By placing the FBG in the shock direction, the reflected wavelengths shift towards the lower wavelengths as function of pressure. We are currently characterizing the transfer function at high pressure levels (up to 8 GPa) which appears not to be linear. In a first approach, the wavelength shift, in an Aluminum target, is around 7 nm/GPa [14]. In Fig. 1, the concept is illustrated. When a shock goes through the chirped FBG from the long wavelength side, the width of the channel decreases at the speed of the shock front-wave and a new channel appears in the spectrum. Its width increases in the case of a constant pressure level. The use of slightly chirped FBG provides the localization of the shock-wave along the grating. By associating hydrodynamic numerical simulations, more complex pressure profiles along the FBG can be retrieved from the spectrum evolution records.
Fig. 1. Illustration of the spectrum evolution for a sustained shock in a slightly chirped FBG.
B. Dynamic dispersive spectrometer
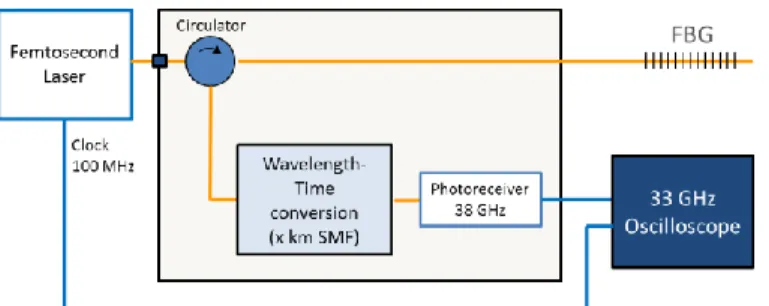
The dynamic dispersive spectrometer is described in Fig. 2. A femtosecond laser is used as a source to get a wide optical spectrum sensing the FBG. The repetition rate of the laser (100 MHz) sets the spectra recording rate. The reflected signal from the FBG is sent to a long SMF28 fiber which converts the wavelengths to time. The length of the fiber fixes the span of the spectrometer. The spectra are multiplexed in the time domain and are recorded with a 38-GHz photoreceiver connected to a 33-GHz oscilloscope with 80-Gb/s sampling rate. The femtosecond laser clock signal is recorded as time reference. The oscilloscope bandwidth and the SMF length determine the spectrometer resolution. For instance, at a laser repetition rate of 100 MHz, for a span of 40 nm (~12 km SMF28 fiber), the resolution is ~0.12 nm.
Fig. 2. Dynamic dispersive spectrometer system (“BraggPulse” system).
Fig. 3. Configuration of the shock-plate experiment with 2 FBGs in the center of the target. The hole’s diameter is 0.9 mm.
C. Design of the experiment
The experimental setup is a symmetric impact with aluminum (6061T6) impactor and target. The experiment is performed in a 110-mm in diameter single-stage gas gun
facility. The diameter of the impactor and target was set to 90 mm, the impactor thickness to 20 mm and target thickness to 55 mm. The pressure is therefore maintained over nearly 30 mm. In the center of the target, a hole of 0.7 mm in diameter allows inserting two FBGs. The first is connected to the dispersive spectrometer, the second to an AWG dynamic spectrometer [14]. The FBGs’ central wavelength is set at the end of the L-band near 1605 nm to cover a pressure range of 0 – 8 GPa. For this experiment, the impact velocity is 314 m/s.
III. EXPERIMENTAL RESULTS
The shock level was measured to be (2.08 ± 0.11) GPa by two pressure gauges. The time evolutions of the FBGs’ spectra measured by the two types of spectrometers are plotted in Fig. 4. When the shock propagates into the FBG connected to AWG spectrometer, the 2 first channels’ intensities decrease one after the other and new signals appears near 1588 nm. The signal is however not constant over time; the wavelength fluctuates with for instance near 1595 nm. Compared to experimental results from [14], the hole to place two FBGs was increased from 0.4 mm to 0.7 mm to place two FBGs, the consequence is a lower shock coupling. The main objective remains here to compare the two types of spectrometers.
Fig. 4. Time evolution of the FBGs’ spectra measured on top by an AWG spectrometer, on bottom the dispersive spectrometer for a shock at 314 m/s.
The dispersive spectrometer has been adjusted just before the shock experiment by measuring spectra with a standard spectrometer. To plot the evolution of the FBG’s spectrum over time, the experimental signal is demultiplexed from the time domain and converted to wavelength numerically. The evolution of the spectrum, plotted in Fig. 4, shows much greater resolution than the AWG spectrometer. The wavelength shift is also not constant. More signals are observed at 1595 nm, but the 1588 nm shift is also measured. The intensity could not be directly compared, but the shifts are significant. Overall, from the results presented in [13], the nm/GPa sensitivity is lower here, which again confirms the reduced shock coupling between the target and the FBGs.
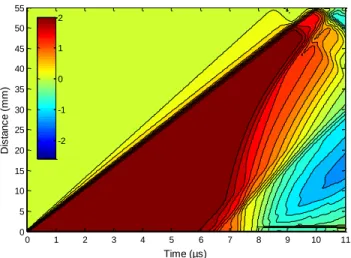
Fig. 5. 2D-hydrodynamic simulation of the pressure levels along the central axis of the target as function of time.
In Fig. 5, the simulated pressure levels in the center of the target are plotted as function of time. Theoretically, with the high resolution evolution of the CFBG spectrum, it is possible to reconstruct this figure experimentally. However, the coupling of the shock from the Aluminum to the Silica is a complex phenomenon that we are currently analyzing to create a dedicated model for the required reverse algorithm [15]. In order to measure complex pressure profiles over longer time than the transit time through the FBG, it is obvious that hydrodynamic simulations have to guide the algorithm to avoid wrong solutions, which may fit the same spectrum.
IV. CONCLUSIONS
Dynamic measurements of spectra were recorded by a dispersive spectrometer at a rate of 100 MHz and were compared to an AWG spectrometer in the same shock-plate experiment. By using a chirped FBG, the shock-wave can be followed and located along the grating length. The dispersive spectrometer provides much greater resolution with less components thanks to the time domain multiplexing. The measurement is done with a single 38-GHz photoreceiver and a high speed oscilloscope with 33-GHz bandwidth. The resolution can be as low as 0.12 nm over a 40-nm range. The integration of the CFBG in targets has to be optimized to get the best material coupling. 2D-hydrodynamic associated with the optical numerical simulations are used to understand and
optimize the shock coupling into the grating. Furthermore, to reconstruct quickly a pressure profile over time, a model providing the wavelength shift – pressure relation is being developed for many materials of study and various types of FBG integration strategies.
REFERENCES
[1] Rosenberg, Z., Yaziv, D. & Patrom, Y. “Calibration of foil-like manganin gauges in planar shock wave experiments” J. Appl. Phys. Vol. 51, pp. 3702-3705 (1980)
[2] Duan, Z., Liu, Y., Pi, A. & Huang, F. “Foil-like manganin gauges for dynamics high pressure measurements” Meas. Sci. Tech. vol. 22, pp. 1-5 (2011)
[3] Lefrancois A., Bouton E., Jacquet L., Chuzeville V., Peix J., Luc J., Baudin G., Genetier M., Mateille P., Zaniolo G., Osmont A., Debruyne M., “Low Amplitude Shock Initiation Experiments on TATB Based Composition Tested With Inverse Particle Velocity”, Proc. Europyro (2015)
[4] Ravid A., Shafir E., Zilberman S., Berkovic G., Glam B., Appelbaum G. Fedotov Gefen A. “Fibre Bragg Grating sensor for shock wave diagnostics” Journal of Physics: Conference Series 500, 142029, (2014) [5] Rodriguez G., Sandberg R.L., Jackson S.I., Dattelbaum D.M., Vincent
S.W., McCulloch Q., Martinez R.M. Gilbertson S.M. and Udd. E., “Fiber bragg grating sensing of detonation and shock experiments at Los Alamos National Laboratory”, Proc. SPIE 8722, 872204, (2013) [6] Sandberg R.L., Rodriguez G., Gibson L.L., Dattelbaum D.M., Stevens
G.D., Grover M., Lalone B.M., Udd. E., “Embedded Optical Probes for simultaneous pressure and temperature measurements of materials in extreme conditions” Journal of Physics: Conference Series 500, 142031, (2014)
[7] Van’t Hof P.G., Cheng L.K., Scholtes J.H.G, Prinse W.C., “Dynamic pressure measurement of shock waves in explosives by means of a fiber Bragg grating sensor” Proc. SPIE 6279, 62791Y-1, (2007)
[8] Deng X., Chen G., Peng Q., Li Z., Meng J., “Research on the fiber grating sensor for the shock stress measurement” Rev. Sci. Instrum. 82, 103109 (2011).
[9] Fu H.Y., Liu H.L., Dong X., Tam H.Y., Wai P.K.A., Lu C., “High speed fibre Bragg grating sensor interrogation using dispersion-compensation fibre”, Electronics Letters, Vol. 44, No 10, 20080859, (2008)
[10] Xia H., Wang C., Blais S., Yao J., “Ultrafast and Precise Interrogation of Fiber Bragg Grating Sensor Based on Wavelength-to-Time Mapping Incorporating Higher Order Dispersion” Journal of Lighwave Technology, Vol. 28, No. 3, pp. 254-261, (2010)
[11] Wang C., Yao J., “Ultrafast and ultrahigh-resolution interrogation of a fiber Bragg Grating Sensor Based on Interferometric Temporal Spectroscopy”, Journal of Lighwave Technology, Vol. 29, No. 19, pp. 2927-2933, (2011)
[12] Rodriguez G., Jaime M., Balakiev F., Mielke C.H., Azad A., Marshall B., La Lone B.M., Henson B., Smilowitz L., “Coherent pulse interrogation system for fiber Bragg grating sensing of strain and pressure in dynamic extremes of materials”, Optics Express 14219, (2015)
[13] Sano Y. and Yoshino T. “Fast optical wavelength interrogator employing Arrayed Waveguide Grating for distributed fiber Bragg grating sensors” Journal of Lightwave Technology, Vol. 21, No. 1, pp. 132-139, (2003)
[14] Barbarin Y., A. Lefrançois A., Magne S., Woirin K. Sinatti F., Osmont A., Luc J., “Dynamic High Pressure Measurements Using a Fiber Bragg Grating Probe and an Arrayed Waveguide Grating Spectrometer”, Proc. SPIE 9960-35, (2016)
[15] Chenga H.-C., Lo Y.-L. “Arbitrary strain distribution measurement using a genetic algorithm approach and two fiber Bragg grating intensity spectra” Optics Communications, Vol. 239, Issues 4–6, pp. 323–332, (2014) Time (µs) D is ta n c e (m m )
Center Pressure (GPa) 300 m/s
0 1 2 3 4 5 6 7 8 9 10 11 0 5 10 15 20 25 30 35 40 45 50 55 -2 -1 0 1 2