Publisher’s version / Version de l'éditeur:
Vous avez des questions? Nous pouvons vous aider. Pour communiquer directement avec un auteur, consultez la première page de la revue dans laquelle son article a été publié afin de trouver ses coordonnées. Si vous n’arrivez pas à les repérer, communiquez avec nous à PublicationsArchive-ArchivesPublications@nrc-cnrc.gc.ca.
Questions? Contact the NRC Publications Archive team at
PublicationsArchive-ArchivesPublications@nrc-cnrc.gc.ca. If you wish to email the authors directly, please see the first page of the publication for their contact information.
https://publications-cnrc.canada.ca/fra/droits
L’accès à ce site Web et l’utilisation de son contenu sont assujettis aux conditions présentées dans le site LISEZ CES CONDITIONS ATTENTIVEMENT AVANT D’UTILISER CE SITE WEB.
Building Research Note, 1984-11
READ THESE TERMS AND CONDITIONS CAREFULLY BEFORE USING THIS WEBSITE.
https://nrc-publications.canada.ca/eng/copyright
NRC Publications Archive Record / Notice des Archives des publications du CNRC :
https://nrc-publications.canada.ca/eng/view/object/?id=52e6a987-f80b-4492-98ab-525ee5c13eb2 https://publications-cnrc.canada.ca/fra/voir/objet/?id=52e6a987-f80b-4492-98ab-525ee5c13eb2
NRC Publications Archive
Archives des publications du CNRC
This publication could be one of several versions: author’s original, accepted manuscript or the publisher’s version. / La version de cette publication peut être l’une des suivantes : la version prépublication de l’auteur, la version acceptée du manuscrit ou la version de l’éditeur.
For the publisher’s version, please access the DOI link below./ Pour consulter la version de l’éditeur, utilisez le lien DOI ci-dessous.
https://doi.org/10.4224/40000494
Access and use of this website and the material on it are subject to the Terms and Conditions set forth at
Lighting energy consumption in an office building having manual
switches
'pH1
sgz
no*
221
BUILDING
RESEARCH
NOTE
ISSN 0701-5232L I G H I C ~ G ENGRGY CONSIJMPTIOM IN AN OFFICE BULDING -
N
-J3AVIWG MAMUAL SWIT(=HES
BLOC;.
bY L I B R A R Y L.A. ~ a r r i & r e and M.S. Rea
I l i v i s i o n of Building Research, N a t i ~ n a l
NATIONAL RESEARCH COUNCIL CANADA D I V I S I O N OF BUILDING RESEARCH
LIGHTING ENERGY CONSUMPTION IN AN OFFICE BUILDING
HAVING MANUAL SWITCHES
L.A. Carrigre and M.S. Rea
Ottawa No vember 19 84
TABLE OF CONTENTS ABSTRACT 1. INTBODUCTI ON BUILDINI; DESCRIPTION OPERATING HOURS LIGHT AUD1TO.R 5.1 Description 5.2 Installation MONITORIWG PERIODS BESULT S 7.1 Refinement of the D a t a 7.2 S t a t i s t i c a l Treatment of t h e Data
ESTIMATIONS OF ENERGY CONSUMPTION MI] COST 8.1 Lighting Load {Puwer)
8.2 Hours of Light Usage ( T i m e )
8.3 Energy Consumption (Power x Time)
8.4 C o s t (Simple Pay-back Period)
CONCLUSIONS
ACKNOWLEDGEMENTS
APPENDICES
A Recording Periods
B Analysis of Variance (PWOVA)
Page 1
ABSTRACT
Lfght usage in a multi-storey office building was monitored o v e r a o n e y e a r period using a recently developed light usage monitoring d e v i c e .
The effects of several factors important to l i g h t usage were analyzed. Estimates of light usage f a r different switching arrangements were a l s o obtained, and comparisons were made of energy consumptioa and simple
parback periods. The u t i l i t y a£ the light monitoring device for measuring
l i g h t usage was also emmined.
1. INTRODUCTION
Wfth the increase in the p r i c e of energy and with the p u b l i c becoming more energy conscious, mare atteatton has been given t o finding ways to
detect and prevent wasted lightlug energy
11-51.
But one question being raised in the l i g h t i n g commnity Xs whether energy rechscing methodscampromise lighting quality and quantity. There is a concern that some energy sav5ng mea&ures (e.g. techniques which reduce i l l d n a n c e levels) tdght have negative effects on the visual performance or satisfaction of the building occupants [6-71.
One way to avoid this problem I s ta attack waste solely by turning lamps 'Offt when they are not required (i.e., when a space is vacant and the lights are n o t required by people working in adjacent spaces). A a m b e r of procedures can be adapted to switch lights 'Off' 18-10]. Manual switches
are of particular interest because they are simple to use, are relatively inexpensive (particularly for a new building), give occupants some
discretionary control over their own lighting environment, and can reduce building operating costs [11-251.
In t h i s study, light usage w a s monitored for a one-year period on f i v e floors of a lllultietorey o f f i c e building
with
centrally located manual wall switches. 'Fhe data were collected using prototype light usage monitoring devaces, called Light Auditors, manufactured by Foundation ElectronicInstruments, Inc., Ottawa. They can measure lighting consumption separately from other electrical systems 116-181. The data were analyzed s t a t i s t i c a l l y t o determine whether the building floors, the orientation
of
the fourquadrants, the seasons, or the various combinatians of these factors, influenced the hwrs of light usage. Estimations of the hours of l i g h t usage in t h i s building were also obtained for several hypothetical
arrangements incorporating manual wall switches. Estimations of lighting energy consumption and s i m p l e pay-back p e r i o d s were made for these
hypothetical switching arrangements, as well as f o r the actual monitored situatgon.
There were three main o b j e c t i v e s in this study:
I ) t o obtain data an the hmm of l i g h t usage over a one-year period in a large o f f i c e building with mnual wall awftchirrg;
2) to test and evaluate the new Light Auditor as a data aquisition device; 3) t o evaluate the impact of different switching arrangements and numbers of
manual switches on lighting energy consumption
and
simple pop-hackperiods.
The fPrst two objectives were met t o our satisfaction, but the t h i r d was not, Because occupancy was nat mnbtored, t h e estimates of wasted
lfghting energy and the potential savings from manual switches could only be appro-te 121. Hevertheless, by making some reasonable assumptions about occupancy, and
with
the measurements of the hours of light usage far the eldsting situation, 60- preliminary estimates could be made of the p o t e n t i a l energy and monetary savings from different manual sdtch%ng layouts,3. BUZLDIPJG DESCRIPTION
The 21-storey S i r William Logan Building {Figure 1 ) owned by Public
Works Canada (PWC), houses staff of the Department of Energy, Mines and
Resources (EHR) in Ottawa. Five floors (3, 6 , 13, 17 and 2 0 ) af t h i s
buildtng, having conveni~nt access, were chosen for t h study- Eoth private and open o f f i c e spaces w e r e found on each floor.
The floor lighting layout was divided into ftve zones: four quadrants
of
equal s i z e and the elevator lobby (Figure 2). One manual w a l l switchcontrolled the majority of lamps in
a
zone, The manual switches on everyf l o o r were grouped near an elevator door.
The lighting laads in the five zones w e r e separately monitored.
Together they constituted an average of 88% of the total lighting laad on a floor (approxima~ely 25 ktl), Lamps on separate circuits (washrooms,
enclosed storage roams, conference rooms, security lights and some p r i v a t e affices) were not monitored.
Electrical lighting was supplied by 40 W, 122 cm ( 4 8 in.) fluorescent
lamps in two-lamp troffers with p r i s m t i e lenses. KLthough the fixtures
e r e made for t w o lamps, very few (1%) actually contained both lamps because of a previous delamping program carried out by PWC. Most luminaires (79%) contained o a y one
lamp.
These fixtures were wired in p a i r s so that twoluminaires shared one ballast. A
few
luminaires (10%) contained onefluorescent lamp and one "son-light-producing tube". Some of the fixtures (10%) were empty. The average connected l i g h t l n g load on the f l o o r s w a s
14
w/$
( 1.3 ~ l f f? ). Glazing on the perimter of the Eloars (~igures 1and 2) had both curtains and venetian blind asseqblies.
4.. O P E W I N G HOURS
As
noted in Sectfoa 2, occupancy was not monitored in this study. A n Interview with the maintrenaace manager, however, indicated that the building was usually o c ~ u p i e d between 0630 and 2000. The building was cleanedbetween 1730 and 1930 and the cleadng staff were asked to turn lfghts 'Offt
as they ffnished on each floor. F i n a l l y the security staff was responsible
for
turning lights 'Off' after nightly inspections (between 1830 and 2300 hours) and on weekeslds. These statements were not verffied, however.Figure 2. Floor diagram for tbe S i r William Logan Building, showing the monitored zones.
E I
I
Z O N E 4 I 1 Z Q N E 1
NORTH-WEST QUADRANT
I
NORTH-EAST QUADRANTm
k
,L$ I F ZONE 5 +--. f I= ELEVATOR LOBBY omm
SWITCH I.-
E LOCATIO '4 0."
IIIm
1 Z O N E 31
Z O N E 2SOUTH-WEST QUADRANT
I
SOUTH-EAST QUADRANT1
I
I II 1
"-1
A
WINDOW 4 . 9 m (16 Ft)I
5. LIGHT AUDITOR
The Light Auditor accumulates the number af hours (to within one tenth of an hour) that a particular lighting circuit has been 'On' by counting the number af light pulses produced by lamps operated with b U ~ y c l e current [ I ] , (The U g h t Auditor is i n s e n s i t i v e to daylight and to lights powered by a DC supply 117
1
1.
A nine-volt alkaline battery powers the Light Auditor for a b u t one year. The Light Auditor must be removed from its holder beforethe l i g h t usage data can b e read; a plug-in reader d i s p l a y s t h e accumulated hours af light usage (Figure 3)- Real-time l i g h t usage data cannot be
obtained wlrh t h i s instrument.
5.2 Installation
Twenty-five Light Auditors (one in each zone of the f i v e monitored f l o o r s ) were mounted on suitable walls using faam core, double s i d e d tape- Before the s t u d y was s t a r t e d , a preliminary, faur-day t e s t of t h e Light Auditors was conducted, Most of the Light Auditors performed as expected, but some had minor problems. Same Light Auditors simply ,did not: function p r o p e r l y and were replaced, %me Light Auditors had been p l a c e d too c l o s e to security lamps and these registered 24 hours of light usage a d a y ; these Light Auditors w e r e relocated. In some other cases, a single centrally
l o c a t e d manual l i g h t switch controlled more than one coatactor; thus two a d j a c e n t luminaires an one monitored switch c i r c u i t could be aperating with line currents o u t of phase by 68 or 120 degrees. In those cases, rhe
numlers of light pulses recorded by the Light i t u d l t o r s w e r e t w o or three times the s i n g l e phase counts. A portable oscilloscrspe was used to detect t h e s e situations and the Light Auditors p o s i t i o n e d to avoid them. Once a
Light Auditor was properly p o s i t f o n e d , its exact location was marked to ensure the same orientation for future readings of light usage.
Far t h e f i r s t ten weeks a£ the monitoring periud (Dcteher 15 to December 2 4 , 1979) weekly readfngs were taken, %r rhe remainder of t h e
year (to October 27, 1980) data were taken every second week. The data were always collected near IQOO hours on Monday mornings, except for Monday
holidays, when data were collected near the same hour on the follawing Tuesday, There were t e n classes o f recording periods during t h i s study. Appendix
A
describes these classes and their frequencies of occurrence during t h e 54 weeks of monitoring.7.1 Refinement af the Data
Ta better detemlrie when li-ghts are used, it i$ desirable to know The dally hours o f l i g h r usage, qr at least be a b l e to separate weekend data E r ~ m w e k l y (five-day) d a t a so that average d a i l y usage can be estimated.
9 V O L T BATTERY' C O N N E C T O R ACCUMULATED TIME D I S P L A Y . READER .1GHT A U D I T O R ACCUMW L A T O R ) I G H T S E N S O R
I
FIGURE 3m o r e frequently than would have been practical; most of the data were recorded every second week in this study. Because of the coarse data acquisition technique, weekend data could not be separated from f i v e d a y
week data and thus the data could nbt be cmfldently transformed to gfve daily hours of l i g h t usage, It was only p o s s i b l e to transform the biweekly
data to weekly hours of light usage, with weekend l i g h t usage included. In t h i s way, the reduction
In
hours of l i g h t usage caused by holidays can be estimated. Appendix A documents the transformations from biweekly data toweekly data,
During the year, 15 out of the 400 possible readings w e r e unusable, Ia
10 cases, data simply did not e x i s t , p r i m r i l y due to battery failure, In
the other 5 cases, unusually high or low values were obtained. These dubious cases were also treated as missing. Estimates of the d s s i n g
values, based upon orthodox procedures 1191, w e r e interjected into the data set before the data were transformed frdm biweekly t o weekly readings and before the s t a t i s t i c a l analyses,
Figurea
4a
t o4e
show the weekly hours and patterns of light usage throughout the year for each qyadrant of each floor. The hours of light usage in the lobbies are not presented in t k s e ffgures, Generally,however, they were similar to the average hwrs of light usage for the same floor.
N s m l weekly hours of l i g h t usage for the quadrants ranged between 60
and 105 hours. The average weekly llghr usage, io hours
(En),
was 75 for weeks without holidays, All eleven statutory holldays produced sharp dropsin the weekly hours of l i g h t usage on every floor and in every quadrant
(5
= 60 hours for weeks with a holiday). Hours of l i g h t usage were as lowas 35 hours during t h e Christmas holiday week. These data show that the switches were indeed used to turn lfghts ' O f f ' during long unoccupancy periods such as nights and holidays.
7.2 S t a t i s t i c a l Treatment of the Data
An analysis of variance (ANOVA) and a Tukey t e a t of p a i r w i s e
comparisans were performed on the weekly data withrmt halfdays to sea if
there were statistical clifferaaces between floors, between quadrants, between seasons and between t h e various combinations of these factors." D a t a for weeks with holzdays w e r e excluded from these analyses due to their fewer hours of light usage. For these statistical tests it was assumed t h a t
there was no interaction between weeks and seasons;** weeks were treated as replications within seasons. The criterion for significance in the ANOVA was p
<
0.62The ANOVA Zndicated
a
main effect for floors and seasons but not for quadrants. The average weekly hours of l i g h t usage an one or more of the *See Appendix S for a brlef description of statistical inference £ran theanalysis ~f variance (ANOVA).
**
The seasans were d i d d e d as f o l l o w s ;Autumn (79-10-22 ta 79-12-24), Winter (79-12-24 t o 80-03-24), Spring (80-03-24 t o 80-06-23), Sunmter (80-06-23 to 80-09-22),
MONIlORINE PEP 100. meek
FLOOR I T : En
-
B2. f1
MONIIORIMG PEUIOU. week MPMITORING P I R I O D , week
Figure 4a-e. Weekly hours and patterns of light usage throughout the 54 week monitorfng period for each f l o o r and its four
quadrants.
'fi,
is average hours oi l i g h t wage per nonholiday week. Week one started October 15, 1979 and week 54 f i n i s h e df i v e f l o o r s was s t a t i s t i c a l l y different from the others, and similarly lfght ueage during one or more seasons was s t a t i s t i c a l l y different f r o m the others, but the hours of light usage were not s t a t i s t i c a l l y d i f f e r e n t for any of the four quadrants. The Tukey t e s t of paired campariaone w a s then used to see which flours and which seasons w e r e significantly different. A confidence interval of 99X was used for a11 paired eomparfsons.
The pairwise conrparisons revealed that the hours of light usage
averages, for every f l o o r , were s r a t f s t i c a f y diffetent except for one pair; f l o o r s 13 and 1 7 , That is, t h e weekly light ueage hours were s t a t t s r i c a l l y
the same on these two f l o a r s . Por seasons, the paLrwise comparisons revealed that the hours o f l i g h t usage in the autumn and spring were
s i g n i f i c a n t l y different, but the hours of l i g h t usage in the autumn were not s i g d f i c a n t l y d i f f e r e n t from those in summer and wtnter, and the hours sf l f g h t ueage in the s p r i n g were not significantly different f r o m those in the s u e r and winter.
The ANOVA also revealed t w o significant two-way interactions; the variable floor interacted with the variable quadrant and Mth the variable season. For the significant: flaorby-quadrant interaction, the Tukey t e s t revealed t h a t light usage walues for the four quadrants were the s a w on
floor 3 , on f l o o r
17
and on floor 20. However, on floor 6 , light usage in t h e southeast quadrant was significantly d i f f e r e n t from the l i g h t usage values in the other three quadrants. Similarly, m floor 13, l i g h t usagesin the southeast and southwest quadrants w e r e significantly d i f f e r e n t from the hours of lfght usage in the northeast and northwest quadrants, For the significant floor-by-season interaction, the average hours of l i g h t usage rra Floor 6 during the autumn was significantly d i f f e r e n t from the l i g h t usage
average hours f o r any other combination of floor and season. The three-wap interaction (floorby-season-by-quadrant) was not sfgnificant.
In total, it inferred that the variation
In
light usage between floors was large and due t o different a c t i v i t i e s on these floors. Switchingwas apparently done in unison for the four quadrants on each floor, except; on floors 6 and 13, where overtime a c t i v i t i e s took place in certain areas of those f l o o r s . Seasonal variations were small and seemed to be pr5marily due to o v e r t i e actfvities 5n the autumn on flour 6 . Daylight apparently had l i t t l e if any effect on hours a£ light usage. Of course the central switching locations were not cmducive t o occupant use of switches in
r e e p w a e to daylight froa the perimeter.
8. ESTIMATIONS OF ENERGY CONSUMPTION COST
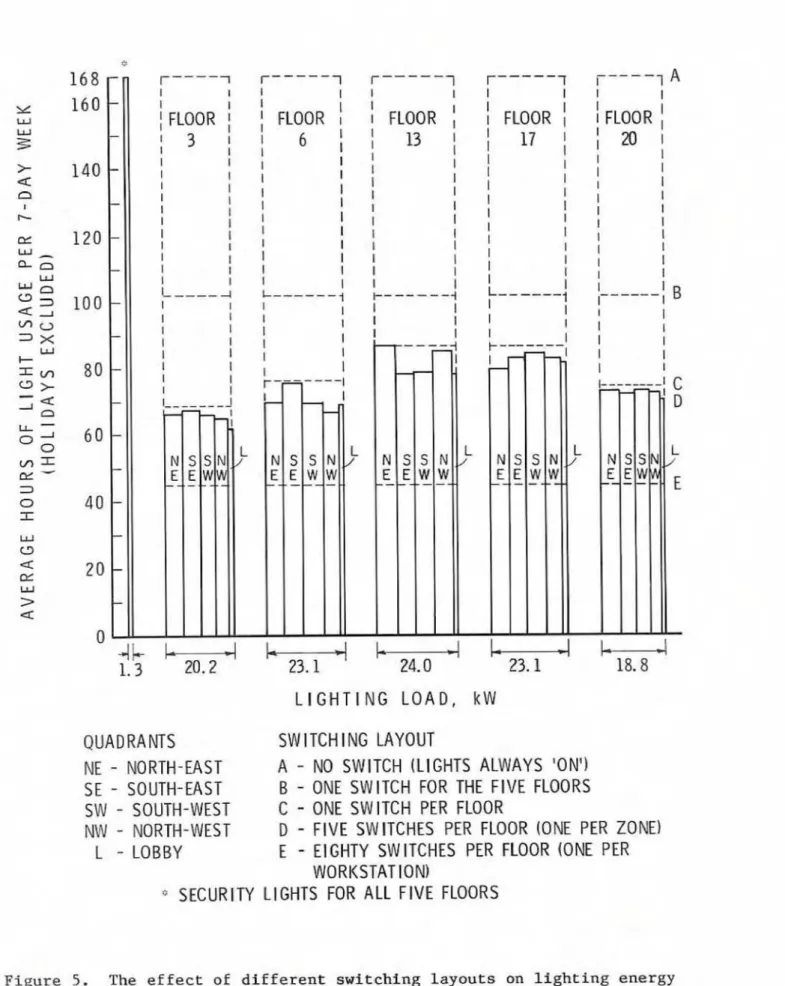
Figure. 5 was developed to display the lighting energy (power x t i m e ) consumed by the different quadrants and floors during t h i s s t u d y . The areas of the histograms are proportional to the lighting energy mosumptions in the different areas; the abscissa gives the power associated with lighting for a particular quadrant or f l o o r , and the ordinate gives the average hours of light usage. Such a figure can also conveniently represent the effects of d i f f e r e n t switching strategies on energy consumption.
FLOOR
'
3
1 I I I I 1 II
FLOOR i 1 6 1 I I 1 I I I L I I I 1 I 1 II
FLOOR,
I
u
I I I I I I I I II
FLOORI
17
1
I I 1 I I I I I I I I 1 I 1 1 I I I I I L--- I I 1 r----1 A I 1 FLOORI
; a 1
I I 1 I I IL I G H T I N G
L O A D ,k W
QUADRANTS
SWITCH
ING
LAYOUT
NE
-
NORTH-EAST
A
-
NO
SWITCH
(LIGHTS
ALWAYS
'OM')
SE
-
SOUTH-EASTB
-
ONFSWITCH FOR
THEFIVE FLOORS
SW
-
SOUTH-WEST
C-
ONESWITCH
PER
FLOORNW
-
NORM-WEST
D
-
FIVE SW UCHES
PERFLOOR
ION
PER ZONE) L-
LOBBYE
-
El GHTY SWITCHES
PER FLOOR(OM
PER
WORKSTAT
ION)
"ECURlTY
LIGHTS
FOR ALLFlVE FLOORS
Figure 5. The effect of different awltching layouts on lighting energy corrsumption. Eaexgy consrrmption equals connected lighting load (abscissa) rimes hours of light usage (ordinate),
8.1 Lighting t o a d (Power)
The lighting loads for the various quadrants and floors in Figure 5 (abscissa values) were estimated from the fixture a u n t s described in Section 3 and the accepted wattages for the different lamplballast
cambiflations. The power used by the t w o fixture (two lamp)/one ballast combination was assumed t o be 93 W, and the one fixture (one lamp and dne "non-light-producing tuba")/one ballast: combination w a s assumed t o u s e 30 W.
Both estimates rake into account line losses, voltage drops to the ballasts, and lamp wall temperature [ 2 0 ] . Again, $he width of each histogram in thfs figure is proportional t o the lightlng load for that quadrant or floor,
based on these estimates.
8.2 Hours of Light Usage (Time)
The nonholAday, weekly hours of l i g h t usage averages, as defined in Section
7.1,
for each monitored quadrant, are proportional to the heights of the histograms marked with s o l i d lines (layout D) in Figure 5.It was also p o s s i b l e to represent the estimated weekly hours of light
usage resulting from other switching arrangements (layouts A,B,C and E in
F i g u r e 5). For switching layout A {ao swftch), the l i g h t s wbuld s f q l y be
'Onv 168 hours per week ( t h i s was the case far security lights). For layout
B (one switch far the f i v e f l o o r s ) , the estimated weekly hours of light:
usage was determined by t h e following two s t e p s . F i r s t , the highest weekly hours of l i g h t usage for all twenty quadrants [,ive floors x four quadrants) were found for each week througbaut the year. Second. the average of thesa maximum w e e k l y values was determined and indicated by a dashed line (3 in F i g u r e 5 ) . A sixailar technique was used ro estimate the hours a£ l i g h t usage for layout C , one switch per floor. For t h i s estimate, the highest weekly hours of l i g h t usage far each floor [four quadrants per floor) were
found and the average
af
these maximum values was indicated by the dashed lines c o l l e c t i v e l y marked C in Ffgure 5 . (The dashed l i n e s marked C areusually higher than any ctE the quadrant averages a c t ~ l l y obtained and i n d i c a t e d w i t h the s o l i d l i n e s marked D, This is because the maximm light usage values for each week throughout the year, were not always associated with the same quadrant)
.
T h i s technique is satisfactory in estimating light usage if fewer
switches are used, but it cannot be used to e s t i ~ t e hours of l i g h t usage if more switches are added to fIoors, The results of a
PGfC
study conducted after the maaitariag p e r i o d in t h i s study, were used to estimate the hours of l i g h t usage associated with localdeed switching (marked E in Figure 5).Using watt-hour meters during 'before-and-after' spot checks, PUG found a 4OX reduction in energy cansrimptfoa fn thfs building after installing one local manual switch p e r wlorkstatiw [an average of 80 switches per floor)
and giving occupants instructions on the use of the light s w i t c h e s 113,141. Presumably the lighting load remained the same, so t h i s reduction in energy consumption must have been due t o a 40% reduction in the hours of light
usage. In the present study, the average l i g h t usage for the five monitored floors was 7 5 hours per week. Thus based on t k PWC study, the l i n e s marked
E i n Figure 5 indicate a 40% reduction in the average hours of usage for the
8.3 Energy Consltmptioa (Power x T i e )
The areas
of
the bistagramsin
Figure
5 represent the weekly energy consumption averages assolcfated w i t h each hypothetical switching arrangemeatand w i t h
the
actual monitored situation, The fourth column in TableI
gives an indication of the average annual lighting energy consumption Eor theactual and hypothetical arrangemente. Naturally, the case of no switckes produced the highest annual energy consumptian and localized switching produced the amallest.
8.4 Cost (Simple Pay-back Period)
The cost of electrical energy to the commercLal customer can be b r o h n
down i n t o three components, The consumption rate, the daytflne peak demand
rate and the power factor penalty rater Taking a l l of these factors together, PW'C baa arrived at a rate of 3 . 5 e k ~ h to represent t h e average energy cost far government b u - l l d i n g ~ %u Ottawa (1984 rate). Table 1 gives
the cost of annual lighting energy consumption for the five floors using
this average rate. Since 3.5$/kW h is fairly small compared to what is
charged in other parts of the country { e . g , 9 . 9 t $ / k ~ - h in Charlottetown,
ref, 21). an average rate af
lO+/kW*h
(including power factdr and daytime peak demand charges) w a salso
used(Table
I).The monetary savings resulting from reduced sonaumptioa can be misleading without a d e t a i l e d life cycle costing e s t h a t e . Such an
undertakidg is quite complex and a justification of more than the simplest assumptions is outside the scope of t h i s project. Nevertheless, the relative length of simple pay-back periods'fot the different switching arrangements for this particular buflding can be readily examined, baaed upon the annual cost of energy 5n Table 1,
Simple pay-back periods can be calculated from the r a t i o of the fncremental investmnt costs for swltehes to the incremental savings from u t i l i t y charges p e r year. PWC has estzmated that the average cost of
installing manual line voltage switches (as installed in t h i s building) i n the retrofit program was approximately $125 per switch (1984 prices). This
estimate reflecrs the cost of equipment, and labor but does not include t h e design of the switching layout or any of the site v i s i t s before, during or after the project, Including these latter costs for professional services, an approlrimate average value of $150 per srJltch* can be assumed. T a b l e 11 compares simple incremental pay-back periods for the d i f f e r e n t srfitchtng arrangements described
In
t h i s sectfon, f o r the t w o utility rates, assrmting$150 per switch.** Adding switches at t h i s fixed cost increases the simple
pay-back periods. The size of the increase w i l l depend on the effectiveness of the strategy used for reducing the lighting energy eonsumpt5on (i,e. the
r a t i o of switches installed t o the reduction in l i g h t usage obtained),
Payback periods will also increase with any increase in imtallatim c o s t
*Interesringly, t h i s value ie close t o what some ccmpaaieo claim t o charge (cas klpoiatl for an automatic coatrol system with local aver-riding
capabillffes in a large building.
*kThe i n s t a l l a t i o n cost per switch will vary with the quantity of switches installed. An increase in the c o a t p e r switch would increase the
incremental p a y b a c k period
for
the first:three
arrangements and slightlyTable I
Estimated impact of various switching layouts on average hours of l i g h t usage, annual lighting energy consumption and e l e c t r i c a l fighting energy
c o s t f o r five monitored floors in the Sir William Logan Building.
Average Annual Annual Annual annual lighting c o s t of c o s t of Lighting l i g h t energy energy1
,
energy, Switching l o a d , usage, usage, (3.5&/kW*h) (lOt/ktl-h)layout kW h k w h dollars dollars
.. no switch 109 8,760 955,000 33,400 95,500 1 switch (5 floors) 1 switch 109 3,920 428,000 15,000 42,800 f l o o r - - 1 s w i t c p 109 3,690 402,000 14,100 40,200 zone 1 switch 109 2,210 241,000 8,440 2 4 , 1 0 0 workstation
l ~ n n u a l c o s t of energy = (lighting load) x (average annual
l i g h t usage) x (average energy c o s t per kilowatt hour)
Table I1
Simple pay-backl p e r i o d s calculated for five floors using t w o utility r a t e s ,
for d i f f e r e n t retrofit s i t u a t i o n s . A fixed value of $150 p e r switch ( 1 9 8 4 price) was assumed.
Incremental Incremental savings
Number investment per year Simple increment a12 Switching of cost 3.5Q/kW* h 1 0 ~ / k ~ - h pay-back p e r i o d s
layout switches (dollars) ( d o l l a r s ) (dollars) 3.5ClkW- h 10Q/kW- h
Mo switch 0
-
--
-
-
I switch 5 f l o o r s 1 150 14,000 40,000 3.9 days 1.4 days 1 switch f l o o r 5 4,400 12,700 50 days 17 days 1 s w i t c dzone 2 5 900 2,600 3.3 years 1.2 years
1 switch work-
s t a t i o n 400 56,250 5,660 16,100 9 . 9 years 3.5 years
investment cost Q'*le ~ay-ba'k = savings per year
'Incremental' represents the change compared to the previous l i s t e d condition, not to any absolute value.
per switch and any decrease in connected l o a d s ( e . g . due to the
i n s t a l l a t i o n of more energy e f f i c i e n t lamps). But pay-back p e r i o d s will
decrease as u t i l i t y rates increase. Mortgage charges, i n f l a t i o n , reductfoa in heat produced by the lighting system, extended b a l l a s t and lamp l i f e , user satisfaction ( p r o d u c t i v i t y ) and other factors would also influence these pay-back periods in a more complete cost analysis.
9. COMCLUSXONS
The Light Auditors perforwd well throughout the year without any m a j o r problems. From the data collected with these devices it was determined that the average hours of light usage (75 hours per nonholiday week, including weekends) was higher than those reported in o t h e r s t u d i e s on comparable b u i l d i n g s [ 1 4 , 1 5 ] , but about the middle of the range in at l e a s t one other
study [22]. Real t i m e l i g h t usage and occupancy data w e r e not available so it w a s not possible t o determine whether t h e lights were always needed f o r that; amount of time each week, however, overtime activities evidently took place. Occupancy needs to be determined and i n thls regard the Light
Auditor, by i t s e l f , is n o t an ideal research tool.
The results of the statistical analyses showed that light usage in this building w a s a f f e c t e d by the floor, the season, the combination of f l o o r and season and the combination of floor and quadrant. T h i s complexity in l i g h t usage probably reflected d i f f e r e n t patterns of activities in the b u i l d i n g throughout the year. Presumably, any l i g h t i n g control strategy, either manual or automatic, would have to accomodate this variability in occupancy patterns, Otherwise, the building will be operated less efficiently, either
in terms of energy use or in terms of occupant: productivity and
satisfaction. For example, a regimented l i g h t i n g schedule for the whole building could result in premature light extinction at some locations where occupants ate still working and unnecessary light usage at other l o c a t i o n s where occupants have gone home.
The total energy consumption (and hours of l i g h t usage) w i l l decrease w i t h the number of switches i n s t a l l e d and operated, However as more
switches are added t o a building, the incremental reduction in energy consumption per switch will decrease. At some p o i n t , adding more switches w i l l not be economically f e a s i b l e . Some investors claim that pay-back p e r i o d s longer than two years are unattractive since b e t t e r return on investment can be made elsewhere. By this criterion and the simple payback a n a l y s i s in s e c t i o n 8 . 4 , t h e installation of 25 switches (and certainly 400 switches) in this b u i l d i n g was not economically a t t r a c t i v e . Only if the
cost of installing switches were reduced or if the p r i c e of e l e c t r i c a l energy increased, would a major switching retrofit of this type become f i n a n c i a l l y attractive,
10. ACKNOWLEDGEMENTS
T h i s study w a s initiated by Alan Levy, and we would like to express our
thanks f a r h f s p r e l i a n a r y work as well as h i s c o m n t s art the manuscript. The authors are also grateful for the data collection provided by b l s t o n Jaekel and the computer assistance provided by Michael Ouellette. We would
also like t b thank Ivalda P a s i n i at Public Works Canada (PWC) for his comments on the manuscript.
1. Levy, A.W., Lighting cantrals, patterns a£ lighting consumption, and energy conservation, IEEE Transactions on Industry Applications,
Vol. IA-16, lo. 3, 1980, p. 419-427. (Also a v a i l a b l e at the Natioual &search Council of Canada, Ottawa, PublZcation No. NRCC 18631).
2. R e a , M.S. and Jaekel, R.R., Lighting energy conservation: simple analytic methods with time-lapse photography. Lighting Research and Technology, Vol. 15, No. 2 , 1983, p . 77-82. (Also available at the National Research Council of Canada, O t t a w a , Publication
No. NRCC 22608).
3, Jenniags, R.E., Guidelines f o r lighting energy conservation in existing guvernmnt buildings. Public Work Canada, Standards and Guldelfnes, Technical Information Series EC-201, Ottawa, Nov. 1977.
4. Benenson, P. and N i d e s , J., Ltghting energy conservation in federal office b u i l d i n g s : fmplementatiun procedures and obstacles. LBL report. Lawrence Berkeley Laboratory, University of California,
LBTB-963, Berkeley, June 1999,
5. Hunt, D.R.G. and Crisp, V.H.C., Lighting controls: their current use and possible Improvement. Buildlng Research Establishment, Building Research Station, Energy Research,
Vol.
2, Garston,UK, 1978,
p* 349-3744.
6 . Rea, M.S., An overview of visual performance. Lighting Dmbgn a r ~ d Application, V o l , 12, No. 11, 1982, p. 35-41.
7. Royce, P.R., Lighting control: the user's p a i n t of v i e w . Lighting Control, Proceedings of the CEA/DBR Symposium, Ottawa, June: 28, 1984, m C C 23589.
8.
Verderber, R.R. and Rublnstein, F.M., mtual impacts of lightingcontrols and daylighting application^. L3L report, Energy and Environment Division, ~awrence' Berkeley Laboratory, University a£ Califorota, LEL-15627, Berkeley, Feb. 1983,
4. t o w r y , R. and Rea, M,S., Energy conservation through lighting controls. Lighting D e s i g n and A p p l i c a t i o n , VoL. 11, W. 9 , 1981, p. 33-35.
10. Crisp, V.B.C. and Henderson, G., The energy management of artificial I f ghting use. Lighting Research and Technology, Vol.
14,
No. 4, 1982, p. 193-206,11. Crisp, V.H.C., The light twitch in build5ngs. Lighting Research and Technolow, V o l . 10, NO. 2, 1978, p. 69-82.
12. Boyce, P.R., Observations of t h e manual switching of lighting. Lighting Research and Technology, Vol. 12, No. 4, 1980, p. 195-205,
13. Robertson, W., Light switching for energy conservation i n an office environment. Lighting Design and Application,
Vo1.14,
No.2,1984,
p. 35-40.14. Levy, A.W. and Robertson, W., Monitoring lighting energy consumption: techniques and results. Journal of the Illuminating Engineering Society, Vol. 10, No. 3 , 1981, p. 178-183. (Also available a t the
National Research Council of Canada, O t t a w a , Publication No. W C 19508).
15. Engineering Interface Ltd., Lighting energy conservation from Labelling switches
-
a study. National Research Council Canada, DBR contract report, No. 09SX.31155-1-4405, Wovember 1983.16. Lewy, A.W,, A new device for monitoring lighting energy consumption. Division oE B u i l d i n g Research, Na~ional Research Council Canada, BR Note 128, O t t a w a , March 1978. (Cette publication est ggalement p u b l i k en £rampis, sous le titre, Un nouveau d i s p o s i t i f de rggulation
de la cunsomwtion d'6nergie par les luminaires,
B W
128F).17. Levy, A.W. and Szanto, A . J . , A new l i g h t l u g energy monitor. Lighting Design and Application, Vol. 10, No. 9 , 1980, p. 36-37.
18. B.C- Hydra and Power Authority, Lightfog energy monitoring device
-
field t e s t , Project 7910, Energy Conservation D i v i s i o n , Vancouver, October. 1983.19. Myers, J . L . , Fundamentals of Experilaental Design, Second E d i t i o n , Allya and Bacon, Inc., Boston, 1972.
20, Trawick, I., Ballasts and retrofit lamps for energy savings. C a d i a n Electrical Association (CEA) Research Report, 009
U
SQA, Sept. 1981, p. 1, 2Q.21. Bnergy, Mines and Resources Caaada, Electricity Rates in Canada,
Electrical Energy Branch, EMR, Ottawa, 1983, p. 101.
22. Engineering Interface Ltd., Lfghting energy audit of school and office bufldings. National Research Council Canada, DBR contract report, Ma. 1SX80-00116, June 1981,
Recording Ferigds
There
were
ten different classes of recording periods in this study, depending upon the day on which the hours of light: usage were recorded. Readings were taken at the start and at the end of each recording period,Underlined letters denote the occurrance of holidays. Depending on the number of working days during a recording period, an appropriate r a t i o (as
ah- in the last two columns) was used to obtain weekly hours of l i g h t usage ( f i r s t week and second week) from the biweekly recording period. The dates of the lettered Boltdays ( t h i r d column) are given in Table A2.
Table A I
-
-Frequency of Tram f ormation
recording ratios
Group Recording Holidays (see periods In
no. periods Table A2) the
54
weeks 1st week 2nd week1 MWTPSSM 8
s/
51 5/20 for a l l 4 weeks Readings were taken after a four week period for group 10. Groups 2 , 5
and 10 contain a halfday, but each we& wdthin a recording period has f i v e worldng days, The reducrim in hours of light usage caused by the holiday in a period affected only the recording period that follow~d. The
transformatiw ratios are used to break down the data iato weekly values. The nuarerator is the number of full working days per week; the denominator is the number of full working days in the recording period. These values
are only approximations. mere w a s no method of determining the exact ratio.
Table A2
Statutory holidays during monitoring period D a t e Weekday Week number during
t h e 54 week period A Nov12179 Honday 5 3 Dee 25/79 Tuesday 11 C Dec 2 6 / 7 9 Wednesday 11 D Jan 1/80 Tuesday 12 E A p r i l 4/80 Friday 25 F April 7/80 Monday 26 G Piay 19/80 Monday 32 H J u l y 1 / 8 0 Tuesday 38 I h g 4/80 bnday 43 J S e p t 1/80 Monday
47
K Oct13/80 Monday 53Analysis of Variance (ANOVA)
In the analysis of
variance
CANOVA), data ate structured t o form amatrix. The matrix has
o
dimensions correspondfng t o the number ofvariables analyzed. In This experimental design, a three dimensional matrix was used corresponding to the three' variables f loar, quadrant and season,
The length o f these dimensions depends upon the number ~f levela within the variables. These leyels correspond to different quantitative or qualitative
categories of the varfables. In t h i s design, the variable called 'floor' has f i v e levels (3, 5, 13, 17, and 201, the variable c a l l e d 'quadrant' has four levels (northeast, northwest, southeast, and sout:hwest?, and the variable called 'season' has four levels (qutupn, winter, spring and summer)
These structured data are statfstfcally analyzed in several ways by the ANOVA. h e way the data are analyzed is to compare the averages for
d i f f e r e n t levels within a variable* If the average for one vartable level is much larger or smaller than the values in the other levels, then it is s t a t i s t i c a l l y different. The averages for the five floors, for example, can be compared to see if one or mare floors is statistically different from the
values for the ather levels. Similarly, the averages for the four quadrants and for the four seasons can be compared. Such s t a t i s t i c a l comparisons of the levels within a variable are called 'main-effects',
When s t a t i s t i c a l l y comparing the mafn-effect averages, the levels of
the
other variables are ignored, In other words, the averages for the different levels within aome main-effects are obtained regardless of the level for any other variable. For example, the main-effect average f o rfloor six is obtained without consideratton of quadrant or season; as long
as the datum was obtained on floor six, it is included in the average.
The combination of variables can be j u s t as, or more, important than the main-effects. These 'interactions' between variables can also be
statistically analyzed in the ANOVA. The averages for combinations of variable levels can be statistically compared in much the same way t h a t levels of the main-effects are analyzed. As with the aualysis for mafn-
effects, the l e v e l s
of
two or more variables (e-g. floor and quadrant) areincluded in the average (5.e. the varfable season is ignored).
If the difference between the averages f o r any two levels of one
variable is not the sa- for the same l e v e l s of the other variable(s), then
there is a significant interaction, So, for example, if the difference in average l i g h t usage is nor the same f o r any two quadrants rza all floors,
then the ANOVA ehows a significant: floor-by-quadrat interaction.
When pairs of variables are statistically analyzed, as in the f l o o r and quadrant combination, they are c a l l e d two-way interactions. When three variables are analyzed, they are c a l l e d threeray interactions. This categorization of interaction terms continues u n t f l all variable
combhations have been statistica1;ly examined t n the BEJOVA. In this ~ t u d y there were 3 two-way and 1 threeway interaction term.