Publisher’s version / Version de l'éditeur:
Vous avez des questions? Nous pouvons vous aider. Pour communiquer directement avec un auteur, consultez la première page de la revue dans laquelle son article a été publié afin de trouver ses coordonnées. Si vous n’arrivez pas à les repérer, communiquez avec nous à PublicationsArchive-ArchivesPublications@nrc-cnrc.gc.ca.
Questions? Contact the NRC Publications Archive team at
PublicationsArchive-ArchivesPublications@nrc-cnrc.gc.ca. If you wish to email the authors directly, please see the first page of the publication for their contact information.
https://publications-cnrc.canada.ca/fra/droits
L’accès à ce site Web et l’utilisation de son contenu sont assujettis aux conditions présentées dans le site LISEZ CES CONDITIONS ATTENTIVEMENT AVANT D’UTILISER CE SITE WEB.
Cold Regions Science and Technology, 9, 3, pp. 215-220, 1984-08
READ THESE TERMS AND CONDITIONS CAREFULLY BEFORE USING THIS WEBSITE. https://nrc-publications.canada.ca/eng/copyright
NRC Publications Archive Record / Notice des Archives des publications du CNRC :
https://nrc-publications.canada.ca/eng/view/object/?id=4597b5c8-8b27-49b7-975c-e093443e85b1 https://publications-cnrc.canada.ca/fra/voir/objet/?id=4597b5c8-8b27-49b7-975c-e093443e85b1
NRC Publications Archive
Archives des publications du CNRC
This publication could be one of several versions: author’s original, accepted manuscript or the publisher’s version. / La version de cette publication peut être l’une des suivantes : la version prépublication de l’auteur, la version acceptée du manuscrit ou la version de l’éditeur.
For the publisher’s version, please access the DOI link below./ Pour consulter la version de l’éditeur, utilisez le lien DOI ci-dessous.
https://doi.org/10.1016/0165-232X(84)90068-5
Access and use of this website and the material on it are subject to the Terms and Conditions set forth at
Measurement of shear strength of granular/discontinuous-columnar
sea ice
Ser
National Research
Conseil national
T:Il
,
N21d
II
I
*
Council Canada
de recherches Canada
no, 1232
c . 2
BrnG
MEASUREMENT OF SHEAR STRENGTH OF GRANULARIDISCONTINUOUS- COLUMNAR SEA ICE
by R.M.W. Frederking and G.W. Timco
ANALYZED
.
- wReprinted from
Cold Regions Science and Technology Vol. 9, (1984), p. 215
-
220DBR Paper No. 1232
Division of Building Research
Price $1.00 OTTAWA NRCC 23709
On a appliqu'e 3 d e l a g l a c e de m e r une m6thode d ' e s s a i d e c i s a i l l e m e n t f a i s a n t a p p e l
2
une f l e x i o n asym'etrique en q u a t r e p o i n t s . La m6thode permet d e r 6 d u i r e l ' i n c e r t i t u d e du champ d e c o n t r a i n t e s 6 . Les e s s a i s o n t Ct6 r 6 a l i s ' e s a v e c d e s 6 c h a n t i l l o n s d e g l a c e c o l u m n a i r e g r a n u l a i r e / d i s c o n t i n u e d e l a mer de B e a u f o r t . une t e m p g r a t u r e d e -13+
2 ° C e t2
une s a l i n i t ' e de 4 , 2 % , l a r 6 s i s t a n c e moyenne a u c i s a i l l e m e n t a 6 t & de 550 kPa; l 1 6 c a r t t y p e B t a i t de 120 kPa.Cold Regions Science and Technology, 9 (1984) 215-220
Elsevier Science Publishers B.V., Amsterdam - Printed in The Netherlands
MEASUREMENT OF SHEAR STRENGTH OF GRANULARIDISCONTINUOUS-COLUMNAR SEA ICE
R.M.W. Frederking and G.W. Timco
Geotechnical Section, Division of Building Research, National Research Council, Ottawa K I A OR6 (Canada)
(Received January 25, 1984; accepted in revised form March 26, 1984)
ABSTRACT
A method o f performing shear tests using asym- metrical four-point bending was applied to sea ice. The method leads to less uncertainty in the stress field created. The tests were performed on specimens o f granular/discontinuous-columnar ice obtained from the Beaufort Sea. For a test temperature o f -13
+
2 ' ~ and salinity o f 4.2%, the average shear strength was 550 kPa with a standard deviation o f 120 kPa.1. INTRODUCTION
In many situations, ice covers interacting with structures or existing ice features are subjected to biaxial stress conditions involving tensile and com- pressive stresses. This condition is known as shear. Analytical predictions of load associated with this behaviour require information on ice strength under such loading conditions. Information on shear strength can also be used to help determine the failure envelope of ice under multiaxial stress condi- tions.
Torsion, direct shear and punching are the primary methods of generating shear stresses. Shear testing, however, presents difficulties both in performing experiments and interpreting results. This is mainly due to problems associated with generating a stress condition that corresponds to the one assumed when analysing the test results. Normally it is assumed that a uniform shear stress is generated on a plane of failure, but in many cases indeterminate normal stresses are also generated on the plane of failure.
This paper presents a method for generating a condi- tion of pure shear stress by using asymmetrical four- point bending on specimens of sea ice.
2. REVIEW OF SHEAR TESTS OF SEA ICE
Butkovitch (1956) conducted tests with a double shear device (see Fig. 1 (a)). A cylindrical specimen (76 mm in diameter, 300 mm long) was fixed at both ends to a cylindrical support. The central section was loaded at right angles to the long axis of the speci- men. Shear, therefore, occurred on two circular surfaces 76 mm in diameter. The total area of these two surfaces (9120 rnm2) was used to calculate the shear strength. The specimens were made from cores of first-year sea ice in which the long axis was parallel to the growth direction and to the long axis of the columnar grains. The salinity of the ice was about 6%. Average shear strength was 1600 kPa in the temperature range -5 to -7'C and 2300 kPa in the range -10 to -1 3 ' ~ .
Paige and Lee (1967) and Dykins (1971) conducted single shear tests using a standard 76 mm diameter core as a specimen (see Fig. l(b)). The specimen, of length equal to the diameter, was loaded over a semicircular area at each end. The loading was oriented so that a failure plane was generated along the length of the specimen. A relief hole was provided in the central section to reduce confinement effects. Paige and Lee (1967) carried out tests on specimens made from cores of natural sea ice. Since the long axes of these cores were in the growth direction, the shear failure plane of the specimen was parallel to the long axes of the columnar grains. The shear
L O A D I N G
P L A T E N S T ,
iP
"--SHEAR P L A N E
( a ) B U T K O V I T C H ( 1 9 5 6 1 D O U B L E S H E A R A P P A R A T U S
Fig. 1. Shear loading apparatus.
.SPEC I M E N
5
strengths were in the range of 500 to 1200 kPa with a significant dependence on brine volume. Dykins
(1971) used laboratory-grown columnar-grained
saline ice and obtained strengths in the range of 100
to 250 kPa. Pounder and Little (1959) carried out single direct shear tests on sea ice of various tempera- tures and grain structures. They obtained strengths in the range of 20 to 1000 kPa.
One of the main problems with these shear tests is that not only shear stress, but also norm'al stress, is created on the shear plane. Furthermore, the mag- nitude of this normal stress cannot be determined with certainty. In the technique used by Butkovitch
(1956), for example, normal stresses due to flexure
are generated on the two shear planes. Also, it was assumed that the shear stress was uniform on the failure plane. This is highly unlikely. The specimens used by Paige and Lee (1967) were undoubtedly pressed against the wall of the confining cylinder, producing a normal stress on the shear plane. Paige and Lee (1967) and Dykins (1971) analyzed their results on the basis of a uniform shear stress over the entire failure plane. There is clearly a need for test techniques that overcome some of these shortcomings. A new technique will be described in the next section.
S P E C l M E N S H E A R P L A N E C O N F I N I N G C Y L I N D E R D I A . ( b ) P A l G E A N D LEE ( 1 9 6 7 ) A N D D Y K I N S ( 1 9 7 1 ) - N O R M A L S T R E S S R E L I E F H O L E
3. ASYMMETRICAL FOUR-POINT BENDING
APPARATUS FOR SHEAR TESTS
The shear tests reported here were performed using asymmetrical four-point bending (Slipetz et al.,
1978). Load is applied at four points on a beam so
that a high shear stress condition is created in the mid-section of the beam. The geometry of load appli- cation and resulting shear forces and bending moment are illustrated in Fig. 2. At the centre of the beam
(x = 0) there is a condition of pure shear and no bending. Slipetz et al. (1978) performed Moire strain analysis and finite element analysis to examine the stress distribution at the centre of the beam. The shear stress distribution on this plane was found to be parabolic, the maximum shear stress at the mid-point of the beam being given by
where P is total applied load, b is specimen thickness, h is specimen depth, and a relates to the loading, geometry. They also found that normal stresses,
rx and T,,, along x = 0 were typically less than 10%
of 7.
Depending on the slenderness ratio of the beam (the ratio of h to I), a critical bending stress could be
U P P E R
u
U P P E R-
X LOW;R T P L A T E h O- P a P lie S H E A R F O R C E D i i i c R A h t 1'' B E N D I N G M O h l E N i D I A G R A MFig. 2. Asymmetric four-point loading apparatus and shear farce and bending moment diagrams.
created at a point f, resulting in a bending failure initiating at that point rather than shear failure. The maximum bending stress is given by
The ratio of the maximum shear stress to the maxi- mum bending stress is given by
The loading arrangement selected was such that
a = 0.1 and the specimen geometry such that h/l -213. Therefore the ratio of the shear stress to the flexural stress was 1.67.
The preceding assumes that simple beam theory applies, i.e. it ignores local stresses generated by the concentrated forces acting on the beam. Timoshenko and Goodier (1951) have examined the effect of these concentrated forces. Their analysis indicates that at the centre of the beam, x = y = 0 , the following normal stresses are generated, rX -0.257 and T~ - - 0 . 8 ~ , where T as defined m
eqn. ( 1 ) is taken as positive. For analysis purposes these normal stresses have been neglected, but they can be determined and taken into account if desired.
A test apparatus built following this design is
shown in Fig. 3. Two aluminum plates transferred the load from the test machine (via bars and balls) to the specimen. Two bars, 12 mm in diameter, were used at the inboard loading points and two balls, 12 mm in diameter, at the outboard loading points. This enabled the nonparallelism of the specimen to be accommodated without introducing additional torsional loads. The upper and lower plates, through which load P i s applied, are free to rotate about the load application point. Loading was carried out on a 60 kN capacity "Tri-Test 50" screw drive test machine.
Fig. 3, Illustration of shear specimen set up between loading platens.
4. SPECIMEN PREPARATION
Specimens were made from large blocks of sea ice recovered during a May field visit to Tarsiut in the southern Beaufort Sea. Six blocks, 0.5 m long, 0.3 m wide and 0.3 m thick, were chain-sawed from the exposed edge of a 1.3 m.thick upthrust piece of rafted ice. The blocks were extracted as two adjacent columns of three blocks each. The relative orienta- tions and positions of the blocks were recorded and maintained. The blocks were transported to Tuktoyaktuk for testing in a small cold room. Two
,
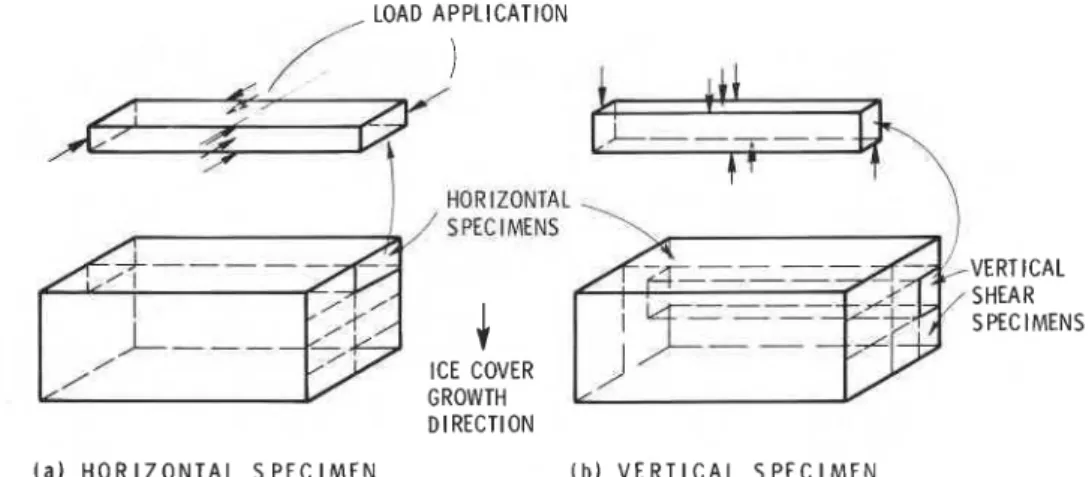
LOAD APPLICATION HORIZONTAL/
SPECIMENSJ.
ICE COVER GROWTH D l RECTl ON SPECIMENS ( a ) H O R I Z O N T A L S P E C I M E N ( b ) V E R T I C A L S P E C I M E NFig. 4. Orientation of specimens in blocks and loading directions.
basic specimen orientations were selected to generate shear on a vertical surface in the ice cover: in one case the loading direction was perpendicular to the growth direction (horizontal shear) and in the other case it was parallel to the growth direction (vertical shear). One group of three blocks was trimmed to make a total of 22 horizontal shear specimens (see Fig. 4(a) for typical specimen orientations). The other blocks were trimmed to make four horizontal shear speci- mens, 12 vertical shear specimens plus a number of compression specimens (Fig. 4(b)). The specimens were cut on a band saw and then planed on a power planer to final dimensions of 400 mm in length, 50 mm in width and 100 mm in depth.
The grain structure of the ice was determined by examining a number of thin vertical and horizontal sections. The structure was essentially granular over 1.2 m of the ice thickness examined, with occasional bands of discontinuous-columnar ice 20-30 m m
thick. This thickness of granular ice is surprising, but Weeks and Akley (1983) have pointed out that it could be caused by frazil ice, which appears to be prevalent in Arctic and Antarctic waters. Average grain size was 2-4 mm and salinity was 4
*
0.5%. There was no systematic variation in structure, grain size or salinity through the depth of the ice cover. The ice has been termed granular/discontinuous- columnar and its structure is described in detail in Timco and Frederking (1984).5. TEST RESULTS
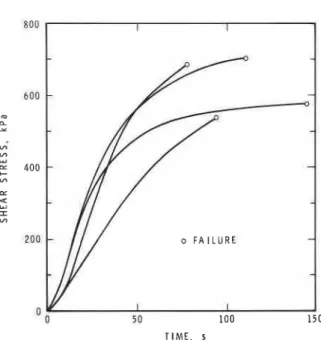
Testing was carried out at two rates of loading, 1 and 5 mmlmin, although a few tests were run at 0.1 and 0.5 mm/min. Some typical stress-time curves are presented in Fig. 5 for a nominal loading rate of 5 mmlmin and in Fig. 6 for a nominal loading rate of 1 mmlmin. Shear stress is the maximum value
0
0 10 20 3 0
T I M E , s
Fig. 5. Shear stress-time curves for loading at 5 mm/min.
I
-
-
-
T I M E , S
Fig. 6. Shear stress-time curves for loading at 1 mm/min.
at the midpoint of the sample (see eqn. (1)). In all cases failure could be described as abrupt with an instantaneous drop-off of load. Sometimes cracks could be heard preceding failure. The actual failure plane always extended between the two inner load application points, as would be expected. At loading rates of 5 mmlmin, the load-time curves were generally linear. However, at rates of 1 mmlmin and lower, the load-time curves were definitely non- linear. In these lower rate tests, some indentation caused by the bars was noted, so the nonlinearity could be attributed to local yielding, reducing the loading rate. I I , ' " I , I I I , , I " ] 8 I , # " & ' 6 H O R I Z O N T A L A A a A V E R T I C A L *e
'
A-
a A A -A-
A A n A-
a n-*
A I I 8 1 1 1 1 1 1 1 I l l l l l l L A V E R A G E S T R E S S R A T E , k P a 5 - 'Fig. 7. Shear strength vs. average stress rate, Beaufort sea ice, May 1983, -14°C.
All the test result:: have been plotted in terms of shear strength versus average shear stress rate (shear strength divided by time to failure) in Fig. 7. There is no strong functional dependence of strength on either rate or specimen orientation. Examination of shear strength in terms of depth in the ice cover also showed no significant trends. Given the granular structure and random orientation of the grains through the 1.2 m depth of the ice, the similarity in shear strength for vertical and horizontal specimens is not surprising. The average shear strength is 550 kPa ? 120 kPa. For an average test temperature of -13 ? 2 ' ~ and salinity of 4.2% ? 0.5 the corre- sponding brine volume is 0.0 19.
0 P A l G E A N D LEE ( 1 9 6 7 ) D Y K I N S ( 1 9 7 1 )
-
A B U T K O V I T C H ( 1 9 5 6 ) 0 T H I S S T U D Y-
- - 0-
d
T
Fig. 8. Shear strength as a function of the square root of brine volume. Note that the data from the literature are for columnar-grained ice, whereas the results of this study are for granular ice.
6. DISCUSSION
In Fig. 8, the shear strength results of this test series and those reported in the literature for first year ice are plotted against brine volume. The results of Paige and Lee (1967) and Dykins (1971), which were both for columnar grained sea ice with shear stress applied in the growth direction, differ by about
a factor of four. There is no apparent explanation for this large difference. Butkovitch's (1956) results which were for shear across the long axes of the columnar grains are substantially higher than the other results as would be expected. Pounder and Little (1959) reported a shear strength of about 500 kPa for granular sea ice, a value remarkably close to that obtained in this study.
It is interesting to note that ice of a similar grain structure and at a similar temperature and salinity had a flexural strength of about 1000 kPa (Timco and Frederking, 1983), or about twice the shear strength. This is to be expected if the flexural strength is equivalent to the tensile strength.
Average shear strength with error bars equal to the standard deviation are presented in a number of cases (see Fig. 8). The standard deviation is generally quite large (30 to 50% in the case of Butkovitch (1956) and Dykins (1971)). On the other hand, the results of this series have a standard deviation of 20%. This smaller variation can be attributed to both the test technique and specimen preparation.
7. CONCLUSION
(1) Asymmetric four-point loading, with its more well-defined shear condition, produced greater con- sistency in shear strength results than had previously been obtained.
(2) Average strength of granular/discontinuous- columnar grained sea ice under a pure shear loading condition was 550 kPa.
(3) For a test temperature of -13
+
2 ' ~ and salin-ity of 4.2%, strength was independent of loading rate over the range 1 to 100 kPa s-'.
ACKNOWLEDGEMENTS
The authors would like to thank Gulf Canada Resources Ltd. for the opportunity to perform these experiments. The logistics, transportation and accom- modation support provided made this test program possible. This paper is a joint contribution of the Divisions of Mechanical Engineering and Building Research, National Research Council Canada, and is published with the approval of the Directors of the Divisions.
REFERENCES
Butkovitch, T.R. (1956). Strength studies of sea ice. Snow, Ice and Permafrost Research Establishment, Res. Rep. RR-20, Willarnette, Illinois.
Dykins, J.E. (1971). Ice engineering - material properties of saline ice for a limited range of conditions. Naval Civ. Eng. Lab., Tech. Rep. R720, Port Huenerne, California. Paige, R.A. and Lee, C.W. (1967). Preliminary studies on sea ice in McMurdo Sound, Antarctica, during "Deep Freeze 65". J. Glacial., 6(46): 515-528.
Pounder, E.R. and Little, E.M. (1959). Some physical proper- ties of sea ice, I. Can. J. Phys., 37: 443-473.
Slepetz, J.M., Zagaeski, T.F. and Novello, R.F. (1978). In-plane shear tests for composite materials. Rep No. AMMRC TR78-30 Army Materials and Mechanics Research Center, Watertown, Massachusetts.
Timco, G.W. and Frederking, R.M.W. (1983). Flexural strength and fracture toughness of sea ice. Cold Reg. Sci. Technol., 8(1): 35-41.
Timco, G.W. and Frederking, R.M.W. (1984). An investiga- tion of the failure envelope of granular/ discontinuous-columnar sea ice. Cold Reg. Sci. Technol., 9(1): 17-27.
Timoshenko, S. and Goodier, J.N. (1951). Theory of Elasticity. Second Edition, McGraw-Hill Book Company, New York.
T h i s paper, w h i l e being d i s t r i b u t e d i n r e p r i n t form by t h e D i v i s i o n of B u i l d i n g Research, remains t h e c o p y r i g h t of t h e o r i g i n a l p u b l i s h e r . It should n o t be reproduced i n whole o r i n p a r t w i t h o u t t h e permission of t h e p u b l i s h e r . A l i s t of a l l p u b l i c a t i o n s a v a i l a b l e from t h e D i v i s i o n may be o b t a i n e d by w r i t i n g t o t h e P u b l i c a t i o n s S e c t i o n , D i v i s i o n of B u i l d i n g R e s e a r c h , N a t i o n a l R e s e a r c h C o u n c i l of Canada, O t t a w a , O n t a r i o , KIA 0R6.