HAL Id: hal-03143047
https://hal-amu.archives-ouvertes.fr/hal-03143047
Submitted on 16 Feb 2021
HAL is a multi-disciplinary open access
archive for the deposit and dissemination of
sci-entific research documents, whether they are
pub-lished or not. The documents may come from
teaching and research institutions in France or
abroad, or from public or private research centers.
L’archive ouverte pluridisciplinaire HAL, est
destinée au dépôt et à la diffusion de documents
scientifiques de niveau recherche, publiés ou non,
émanant des établissements d’enseignement et de
recherche français ou étrangers, des laboratoires
publics ou privés.
Distributed under a Creative Commons Attribution| 4.0 International License
decompression sickness with neurological disorders
Sébastien de Maistre, Sandrine Gaillard, Jean-Charles Martin, Simone
Richard, Alain Boussuges, Sarah Rives, Anne-Virginie Desruelle, Jean-Eric
Blatteau, Catherine Tardivel, Jean-Jacques Risso, et al.
To cite this version:
Sébastien de Maistre, Sandrine Gaillard, Jean-Charles Martin, Simone Richard, Alain Boussuges, et
al.. Cecal metabolome fingerprint in a rat model of decompression sickness with neurological disorders.
Scientific Reports, Nature Publishing Group, 2020, 10, �10.1038/s41598-020-73033-z�. �hal-03143047�
Cecal metabolome fingerprint
in a rat model of decompression
sickness with neurological
disorders
Sébastien de Maistre
1, Sandrine Gaillard
2, Jean‑Charles Martin
3, Simone Richard
2,
Alain Boussuges
4, Sarah Rives
4, Anne‑Virginie Desruelle
4, Jean‑Eric Blatteau
1,
Catherine Tardivel
3, Jean‑Jacques Risso
4& Nicolas Vallée
4*Massive bubble formation after diving can lead to decompression sickness (DCS), which can result in neurological disorders. We demonstrated that hydrogen production from intestinal fermentation could exacerbate DCS in rats fed with a standard diet. The aim of this study is to identify a fecal metabolomic signature that may result from the effects of a provocative hyperbaric exposure. The fecal metabolome was studied in two groups of rats previously fed with maize or soy in order to account for diet effects. 64 animals, weighing 379.0_20.2 g on the day of the dive, were exposed to the hyperbaric protocol. The rats were separated into two groups: 32 fed with maize (Div MAIZE) and 32 fed with soy (Div SOY). Gut fermentation before the dive was estimated by measuring exhaled hydrogen. Following hyperbaric exposure, we assessed for signs of DCS. Blood was analyzed to assay inflammatory cytokines. Conventional and ChemRICH approaches helped the metabolomic interpretation of the cecal content. The effect of the diet is very marked at the metabolomic level, a little less in the blood tests, without this appearing strictly in the clinic status. Nevertheless, 37 of the 184 metabolites analyzed are linked to clinical status. 35 over‑expressed compounds let suggest less intestinal absorption, possibly accompanied by an alteration of the gut microbial community, in DCS. The decrease in another metabolite suggests hepatic impairment. This spectral difference of the ceca metabolomes deserves to be studied in order to check if it corresponds to functional microbial particularities.
When diving, the gases breathed in through the regulator are dissolved in the body tissues progressively during the descent to the seabed. During the decompression phase they may give rise to the production of bubbles, even when there are no procedural faults. When bubbles form in excessive quantities in the blood and tissues, symptoms of decompression sickness (DCS) may appear1. Conventionally it is acknowledged that the quantity of
venous bubbles has a positive correlation to the risk of DCS2,3. However, there is high intra- and inter-individual
variability in terms of bubble formation for the same dive profile.
Neurological lesions with spinal cord and brain injury are the origin of the most serious and most frequently encountered symptoms in decompression sickness (DCS)3. Despite the reference treatment with hyperbaric
oxygen therapy, 20 to 30% of patients have sequelae after medical treatment for neurological DCS4. The
identi-fication and control of new factors favoring DCS is therefore a major challenge.
This study focuses more especially on the products linked to the activity of the digestive system and its micro-biota. The microbiota is mostly composed of strict anaerobic micro-organisms which produce by fermentation, from exogenous (undigested carbohydrates and proteins) and endogenous (mucopolysaccharides, cell debris or even enzymes) substrates, proteins and amino-acids, intermediate metabolites (succinate, lactate) and also
open
1Service de médecine Hyperbare Expertise plongée, Hôpital d’Instruction des Armées Sainte-Anne, BP
600, 83800 Toulon Cedex 9, France. 2Université de Toulon, CS 60584, Toulon Cedex 9, France. 3UMR INRA
12060/INSERM1263/AMU C2VN, Plateforme Métabolomique, Faculté de Médecine la Timone, 13385 Marseille Cedex, France. 4Institut de Recherche Biomédicale des Armées-Equipe de Recherche Subaquatique
terminal metabolites such as short chain fatty acids (acetic, propionic and butyric acids), ammonia and gases including hydrogen5,6. In diving, it has been shown that the digestive tract could have an influence on the
occur-rence of decompression sickness through the activity of the intestinal microbiota7–12. In fact, during dives using
hydrogen as the diluent gas for O2, the metabolism of hydrogen by the native intestinal microbiota of pigs could
protect against DCS, by the intermediary of a reduction in the body burden of H27. Conversely, during a
previ-ous study we have shown that the bacterial fermentation of undigested sugars, during the dive, is accompanied by a greater incidence of DCS, including during dives using a diluent gas other than hydrogen11,12. A part of the
hydrogen formed by fermentation in the intestine diffuses through the intestinal barrier into the entire body. This endogenous hydrogen could have a detrimental effect in DCS. It could contribute to a direct increase in the inert gas burden during hyperbaric exposure, and be excreted in the form of bubbles during the decompression phase. Less intuitively, increased fermentation over the long term with production of hydrogen before the dive would limit the risk of DCS due to the possible antioxidant and neuroprotective properties of the hydrogen10.
The metabolic pathways for the hydrogen by the intestinal microbiota, and more generally, the fecal metabolome in the risk of DCS must, therefore, be specified.
In this context, we seek to understand the interactions between accident-provoking hyperbaric exposures and the cecal metabolome, thus involving the intestinal microbiote and the host organism. Insofar as intestinal activity varies as a function of diet, comparing the metabolome of rats fed identically would not have been sufficiently restrictive to isolate the influence of diet in the event of an accident. We have decided to expose two series of rats, previously fed with maize (cereal) or soy (legume), to accident-provoking protocols. These seeds are of different composition, with in particular different patterns of fermentability13,14, and they could therefore influence the
metabolites distribution in the intestine 15,16{Coward, 1972 #7327},17,18. The fecal metabolome of rats was analyzed in
order to detect the effect of diet initially, and therefore better spotlight by a statistical process a metabolomic signature which could result from the specific effects of the accident-provoking hyperbaric exposure.
We hypothesize that a fecal metabolome fingerprint linked to DCS could be identified.
Equipment and methods
Animals and ethical statement.
All procedures involving experimental animals complied with Euro-pean Union rules (Directive 2010/63/EU) and French law (Decree 2013/118). The Ethics Committee of the Institut de Recherche Biomédicale des Armées approved this study in 2016. Sprague–Dawley male rats (Harlan laboratory, France) were housed in an accredited animal care facility, at 22 ± 1 °C. They were kept in cages both during rest and during the experiments and maintained on a regular day (6:00 am–6:00 pm)/night (12 h) cycle. Before the beginning of the study, food (kibble from Harlan Laboratories, 18% protein) and water were provided ad libitum.In agreement with our Ethics Committee, we took inspiration from the Swiss veterinary guide to establish a form for monitoring the welfare of the animals19. A dedicated observer was responsible for scoring (from 0 to
3) the stress and pain felt by each animal. 0 corresponds to a zero degree of stress and three is the maximum. A degree of stress of 3 in one case or a total score of 12 represents a criterion for stopping the procedure. The items refer to vocalization, licking, the presence of tears, aggression or withdrawn behavior, labored breathing, motor or locomotor disorders with paralysis for example. In this study, no score reached 12, and it was not necessary to resort to anticipated euthanasia.
At the end of the experimentation, the animals were anaesthetized by induction with isoflurane (Bellamont, firstly at 5% then 2%), in order to save time and minimize stress, then by intraperitoneal injection (1 ml syringe, Omnican, B. Braun, Melsungen, Germany) of a mixture of ketamine (Imalgene 1000, 100 mg/kg, AstraZeneca, London, UK), acepromazine (Calmivet, 1,65 mg/kg, Vétoquinol S.A., Lure, France) and xylazine (Rompun 2%, 16 mg/kg, Bayer HealthCare, KVP, Kiel, Germany).
Batches and food.
30 days before the hyperbaric exposure, the rats (300–325 g; 9–10 weeks old) were separated into two equal groups and fed with maize or soy, at a rate of 30 g per day. 64 animals, 32 fed with maize (MAIZE) and 32 fed with soy (SOY), weighing 379.0_20.2 g (median_interquartile) the day of the dive, were exposed to the hyperbaric protocol.The animals were fed by our technician and the rats were identified by a code unknown to the staff in charge of the physical examination, then sorted according to their weight in order to balance the dive groups. The clinic was established by another staff and the coding was only revealed afterwards for processing the results.
Exhaled hydrogen.
Exhaled hydrogen was measured before the dive in order to evaluate gut fermentation. For all rats, the amount of H2 measured in exhaled air provides a measurement of the rate of H2 productionresulting from the bacterial fermentation of carbohydrates in the gut (and hence diffusing throughout the body via the bloodstream). To measure H2 in exhaled air, we considered that the breathing rate in rats is constant over
time, with a mean rate of 225 ml min−1. The literature provides a resting value of 27.27 ± 2.39 ml min−1 100 g−1
(mean ± standard deviation) for Sprague–Dawley rats20. The weight of the rats we studied was 379.0_20.2 g
(median_interquartile). However, taking into account the stress induced by the measurement process, we used a breathing rate double that of the value in the literature for unstressed, resting rats. For each measurement, each rat was placed in a clean, dry polyvinyl chloride (PVC) cylinder (internal diameter 75 mm, length 200 mm, i.e., an internal volume of 883 ml). Both ends were hermetically sealed using plastic discs with holes in the middle, allowing air in at one end and the collection of gases at the other end. Air was circulated by a special aerator (Rena Air 200, France) set to a constant flow rate of 225 ml ml min−1 which was controlled by the rise of a soap
bubble in an inverted 100 ml test tube that was pierced at the bottom. After 5 min (to allow time for the gases to mix inside the cylinder, allowing for the dead space, i.e., that not occupied by the animal), successive
meas-urements of H2 (ppm) in the air coming out of the cylinder were performed by means of a three-way tap. H2
was measured using a mobile exhaled H2 analyzer (Gastrolyser, Respur International, France). The results were
recorded one hour before pressurization.
Hyperbaric exposure.
To remain comparable, we have graciously used the protocol of our previous experiences9,10,12,13. Batches of 8 freely-moving rats (4 per cage and 4 per group) were subjected to the hyperbaricprotocol, which generates decompressions sickness, in a 200 L caisson with three observation portholes. The protocol has two compression speeds. The animals were subjected to an air compression procedure at a speed of 10 kPa min−1 up to an absolute pressure of 200 kPa (corresponding to a depth of 10 m of seawater);
and then a speed of 100 kPa min−1 up to a pressure of 1000 kPa (corresponding to a depth of 90 msw) where
they remained for 45 min. The rats were then decompressed at a speed of 100 kPa min−1 up to 200 kPa, and
then a speed of 10 kPa min−1 until return to normal pressure, adhering to 5-min stages at 200 kPa (10 msw) and
160 kPa (6 msw) with a final stage of 10 min at 130 kPa (3 msw). The decompression speed was automatically controlled by a computer connected to an Analogue/Digital converter (NIUSB-6211, National Instrument, USA), itself connected to a solenoid valve (Belimo LR24A-SR, Switzerland) and a pressure transmitter (Pressure Transmitter 8314, Bürkert Fluid Control Systems, Germany). The program used to control the compression and decompression speeds was devised by a laboratory engineer at DASYLab (DASYLab National Instruments, USA). The compressed air was supplied by a diving compressor (Mini-Verticus III, Bauer Comp Holding, Germany) coupled to a 100-L unit at 30 MPa, and connected to a pressure relief valve (LTHS 400 0086, ALPHAGAZ, Rousset, France). The oxygen analysis was performed using a micro-fuel electrochemical cell (G18007, Teledyne Electronic Technologies, Analytical Instruments, USA). The CO2 produced by the animals was captured with
soda lime (< 300 ppm, GE Healthcare, Helsinki, Finland). The gases were mixed by a fan, and the temperature inside the caisson was measured with a heat probe (Pt 100, Eurotherm, France).
Diagnoses and behavioral tests.
The physical examination for the rats was conducted by the main experimenter. It was established over a 30-min observation period with the collection of clinical signs, where the respiratory difficulties, motor disorders, convulsions, and death were referenced with a time index. Then, these observations were completed by a Motor Performance Score (MPS), from 10 to 0, comprising specific tests for (loco)motor disorders 21: the beam-walk test from 1 to 7 (agility test on a 1.5 m long and wide plank calibratedfrom 7.7 cm to 1.7 cm, and placed 1.1 m above the void) was practiced two weeks before the dive and after the dive. It involved allowing the rat to move on an ever-narrower board above the void. The rollover test consisted of a simulated fall situation causing a reflex rollover in the animal so that it fell on its paws. It was assessed on a score of 0 to 2. The toe-spreading reflex test22 assessed motricity and, more especially, the functional impairment
of the sciatic nerve (SFI Index). It was based visually on the spreading of the toes where 2 is a normal state, 1 a weak spread and 0 complete inability to spread the toes. This test was seconded by the diagnosis of motor impair-ment of the hind paws (MIHP), where a score of 5 indicates normal motricity, 4 a rat which limps, 3 a paw which is stretched and does not go back into place spontaneously, 2 a paw spontaneously to the rear, 1 a paw that no longer moves but is still capable of muscle contraction and 0 an inert paw.
Clinical status.
To remain comparable, we have graciously used the same protocol of our previous experiences9,10,12,13. The DCS status was attributed when the rat presented serious neurological signs in the formof paresis or paralysis of at least one limb, convulsions and/or reduced performance in SFI, MIHP locomotor tests, with a beam walk test score reduced by at least 2 points. The other rats were considered to be No DCS.
Anesthesia and sacrifice.
30 min after coming out of the hyperbaric chamber, all the animals were anes-thetized by induction with isoflurane (Bellamont, firstly at 5% then 2%), then by intraperitoneal injection (1 ml syringe, Omnican, B. Braun, Melsungen, Germany) of a mixture of ketamine (Imalgene 1000, 100 mg/kg, Astra-Zeneca, London, UK), acepromazine (Calmivet, 1,65 mg/kg, Vétoquinol S.A., Lure, France) and xylazine (Rom-pun 2%, 16 mg/kg, Bayer HealthCare, KVP, Kiel, Germany).At the end of the experiment, rats were sacrificed by an injection of sodium pentobarbital (200 mg/kg IP; Sanofi, Paris, France).
Blood analyses.
We have used our previously described protocol 9,10,12,13. Briefly, the blood counts wereperformed from 15 µl blood taken from the tip of the tail and diluted in the same volume of 2 mM EDTA (Sigma, France). The analysis was performed using an automaton (Scil Vet abc, SCIL Animal Care Company, France) on samples taken 60 min before or 30 min after exposure to the hyperbaric protocol. The values for the second blood sample were corrected depending on the variation in the hematocrit.
Cytokine detection.
We have graciously reproduced our analysis protocol9,10,12,13. Under anesthesia, bloodsamples were collected by an intra-aortic puncture to determine the values of plasmatic cytokine levels. Blood was collected in sterile 4 ml tubes containing lithium heparin (BD Vacutainer, BD-Plymouth, UK) and, within 30 min, plasma was separated out by simple centrifugation at 1200 g and 4 °C for 15 min. The supernatant was kept at − 80 °C until testing.
The pro-inflammatory cytokine IL-1β and oxidative stress markers TBARS and GPX were assayed using a rat ELISA kit (ELISA Kit, Antibodies-Online GmbH, Germany) and QuantiChrom TBARS Assay Kit and Enzy-Chrom Glutathione Peroxidase Assay Kit (BioAssay Systems, CA, USA). Samples, standards, and quality controls were all run in duplicate. All standards and quality controls were made up as recommended by the supplier.
Fecal metabolome.
Immediately before sacrifice, the cecum was separated from the rest of the digestive tract after ligation. The cecum was weighed and then opened using a scalpel. Part of its contents was placed in a 1.5-ml Eppendorf tube and kept at − 80 °C until metabolomic analysis.100–150 mg of cecal content were homogenized in cooled methanol (3µL/mg feces) at − 20 °C. Samples were vortexed for 1 min and incubated at − 20 °C for 30 min. Samples were then centrifuged for 15 min (11,000 × g, 4 °C). The supernatant recovered from each sample was filtered through 10 KDa filter tubes by centrifuging for 45 min (11,000 × g, 4 °C). The extracts obtained were then dried using a stream of nitrogen and then frozen at − 80 °C.
LCMS metabolomic analyses were performed essentially as described earlier23. All the dried polar extracts
were first reconstituted with 150 µl acetonitrile/water (50:50; v:v). The samples were separated using high per-formance liquid chromatography (UPLC) ultimate 3000 (Thermo Scientific), coupled to a high-resolution mass spectrometer (HRMS), Q-Exactive Plus quadrupole-orbitrap hybrid equipped with electrospray ionization source (H-ESI II). The chromatographic separation was performed on a binary solvent system using a HILIC column (Merk,SeQuant ZIC-HILIC, 150 mm × 2.1 mm, 5 μm, 200 A) at 25 °C with a flow rate of 0.25 ml min−1. The
injection volume for both columns was 5 μl. The mobile phase for the HILIC column separation consisted of a combination of solvent A (100% water, 16 mM ammonium formate) and solvent B (100% acetonitrile 0.1% formic acid). The following gradient conditions were used: 0 to 2 min, isocratic 97% B;, 2 to 10 min, linear from 97 to 70% B; 10 to 15 min, linear 70 to 10% B; 15 to 17 min, isocratic 10% B; 17 to 18 min linear from 10 to 97% B; from 18 to 22 min isocratic 97% B. The separated molecules were analyzed in both positive and negative ionization modes in the same run. The repeatability of the analysis was checked by analyzing interspaced (1 out of every 5 samples) quality control samples (QC).
Data processing and molecule identification: All the raw data generated by the LCMS were converted to mzXML by ProteoWizard (Version 2.0), and then processed by MZmine 2.26. The identification of the metabo-lites was performed by using an in-house database referencing more than 800 metabometabo-lites with their chroma-tographic retention time acquired with a HILIC column, together with their exact mass and MSMS spectra obtained in positive and negative ionization modes, including their adducts and neutral losses. These led to Level 1 (MSMS, retention time, MS) or 2 identification (retention time, MS).
The MS metabolomics data from feces were merged into a single dataset together with the other correspond-ing biological data and microbiota measurements, givcorrespond-ing rise to 185 variables per rat.
Statistical analyses.
The blood count analyses are calculated according to an individual variation percent-age. For the groups the data is expressed in median and interquartile. Most series of values fell between 0 and 1 and the distribution was positively skewed. Prior analysis, scale-contracting transformation was applied with log(X + 1). The difference is analyzed using 2-way ANOVA (type III SS) on clinical status and diet, comprising interactions, followed by post-hoc Tukey’s (HSD) and Benjamini-Hochberg’s (False Rate Discovery) tests. Prin-cipal component analysis (Pearson correlation coefficient), agglomerative hierarchical clustering (AHC) (dis-similarity; Euclidean distance; Ward’s method) helped by k-means clustering were used to design the heat map and volcano plot, from normalized data of the 185 features of the 65 diving rats. The software was Xltat Biomed from Addinsoft. Maximum acceptable alpha level was 5%.Results
Clinical observation.
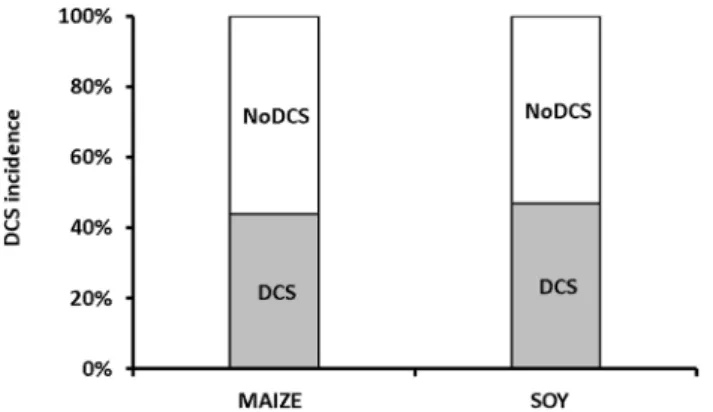
The hyperbaric protocol did indeed generate decompression sickness. The incidence of clinical signs of neurological DCS (Fig. 1) is not significantly different between the groups of rats fed on maize and those fed on soy (n = 32/32, Levene median p = 0.806), with 44% and 47% of rats symptomatic respectively (Fig. 1). 8 and 7 rats succumbed to the sequelae of their DCS (MAIZE n = 8; SOY n = 7). Finally, there are no significant differences in any of the clinical examinations that are directly related to diet.Figure 1. Percent of symptomatic rats 30 min after an at-risk decompression as a function of diet. Grey blocks were attributed to DCS status, i.e. when the rats presented neurological signs. White blocks represent the proportion of rats that shown no clinical sign (NoDCS).
Blood and exhaled hydrogen analysis.
The diet modified a certain number of blood parameters in rats exposed to the hyperbaric protocol (Figs. 2 and 3).The SOY rats had more platelets before the dive (median_interquartile. PLAMAIZE = 450_80 × 103/
µl; PLASOY = 478_106 × 103/µl; p = 0.022). This difference was more marked between the NoDCS MAIZE and
SOY rats (p = 0.024). However, there does not appear to be any significant difference concerning their mobiliza-tion (p = 0.654). The red corpuscles were smaller in the SOY rats (MCVMAIZE = 48.0_3.0 µm3; MCVSOY = 44.0_5.3
µm3; p = 0.006) and this difference continued after the dive (MCV
MAIZE = 47.0_5.0 µm3; MCVSOY = 43.0_7.2 µm3;
p = 0.003). No other count difference (post-correction) linked to diet or clinical status was observed after the dive (Fig. 2).
The level of IL-1β is higher in SOY rats after diving (median ± interquartile IL-1βMAIZE = 0.24_0.12 pg/
ml; IL-1βSOY = 0.68_0.16 pg/ml; p < 0.0001). No significance was noted for TBars and GPX (Fig. 3).
The level of exhaled hydrogen is higher in the SOY rats (median ± interquartile H2MAIZE = 0.044_0.069 ppm/g; H2SOY = 0.122_0.087 ppm/g; p = 0.001) and more specifically in the DCS rats
(Fig. 3).
Metabolomic analysis of feces.
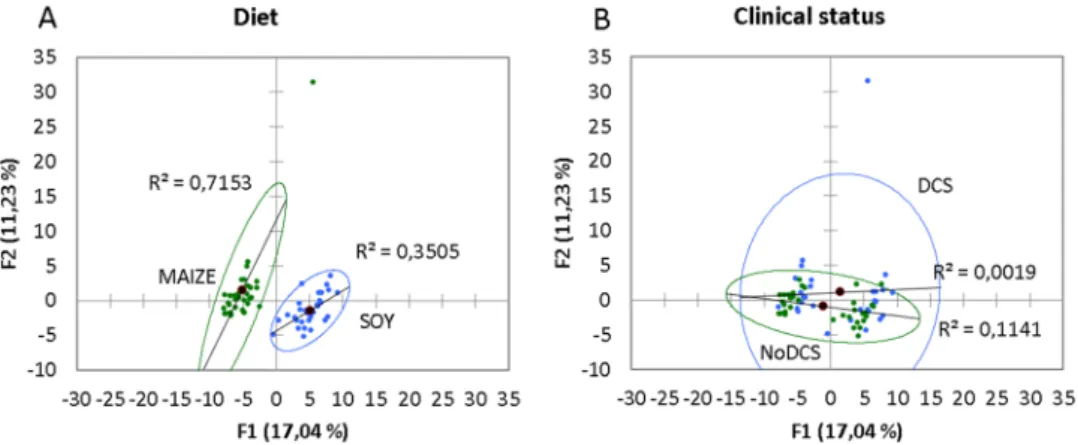
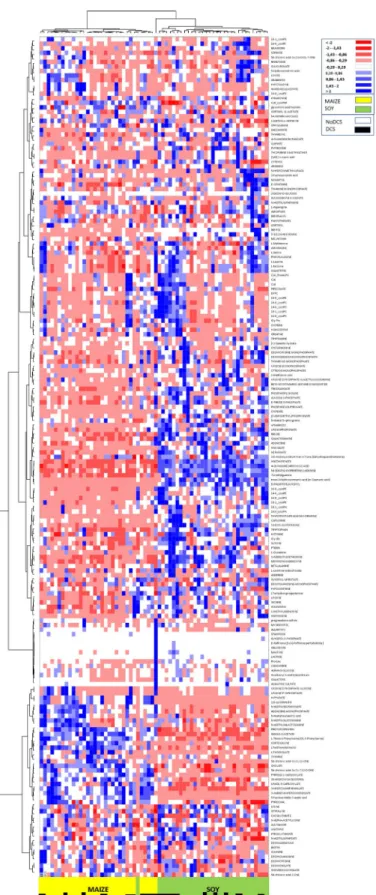
The principal component analysis (PCA; Pearson test) (Fig. 4) of the fecal metabolome of 64 rats highlights two distinct groups linked to diet, where the axes F1 and F2 explain 28% of the variability. A similar PCA conducted on the clinical status did not show any particular group.An Ascending Hierarchical Classification (AHC) was conducted in the context of the Heat Map established according to the intensity of the 184 compounds analyzed (Fig. 5). Following the evolution of the variances according to the number of classes, there is an inflection point in the 3rd class. This division explains 67% of the Figure 2. Blood cells count before and after the hyperbaric exposure. * notes significant difference (p < 0.05) for a whole diet group and # denotes difference between infra-groups. Yellow blocks represent the rats fed with maize. Green blocks represent the rats fed with Soy Blocks with dots indicate rats displaying symptoms of decompression sickness (DCS).
Figure 3. Concentrations of IL-1β TBars and GPX in blood and amount of hydrogen in exhaled air of rats submitted to a provocative decompression protocol. Yellow blocks represent the rats fed with maize. Green blocks represent the rats fed with Soy Blocks with dots indicate rats displaying symptoms of decompression sickness (DCS).
intragroup variability. Even though this distribution highlights 3 groups, 2 actually appear. Effectively the test spotlights 3 groups of rats (sorted according to the values of the compounds) but one group contained just a single rat, and was itself was situated between the 2 other groups. This means there were only 2 groups remain-ing, composed solely of either MAIZE or SOY rats. The effect of the diet is actually very marked. Finally, the distribution into 2 groups explains 86% of the intra-class variance. Therefore, the ACH of the Heat Map makes it possible to see distinctly on the abscissa a separation of the diets with rats fed on maize on the left (yellow) and those fed with soy on the right (green). An over-expression of the compounds in the feces of rats fed on soy is therefore visible in blue on the section at mid-height to the right of the map. The maize diet seems to favor an over-expression of the compounds situated in the bottom left of the map.
In addition, a more discreet dichotomy appears between the DCS and NoDCS rats, with a concentration at the center of the DCS rats (shown by black squares on the abscissa) whether they are MAIZE or SOY. It can be noted by vertical projection that for two thirds of the map there is a panel of molecules for which expression seems to be linked to clinical status.
The ANOVA (Type III SS with post-hoc Tukey (HSD) and Benjamini-Hochberg (FRD)) with two factors (Clinical status x Diet) has been performed for the 185 compounds in the 65 diving rats. The Venn diagram (Fig. 6 + Supplementary data 1 for the list of metabolites) from this analysis enables the effects linked to clinical status or diet to be seen, as well as their interactions. Out of the 185 compounds analyzed, 103 were significantly influenced by diet and 37 differed with clinical status.
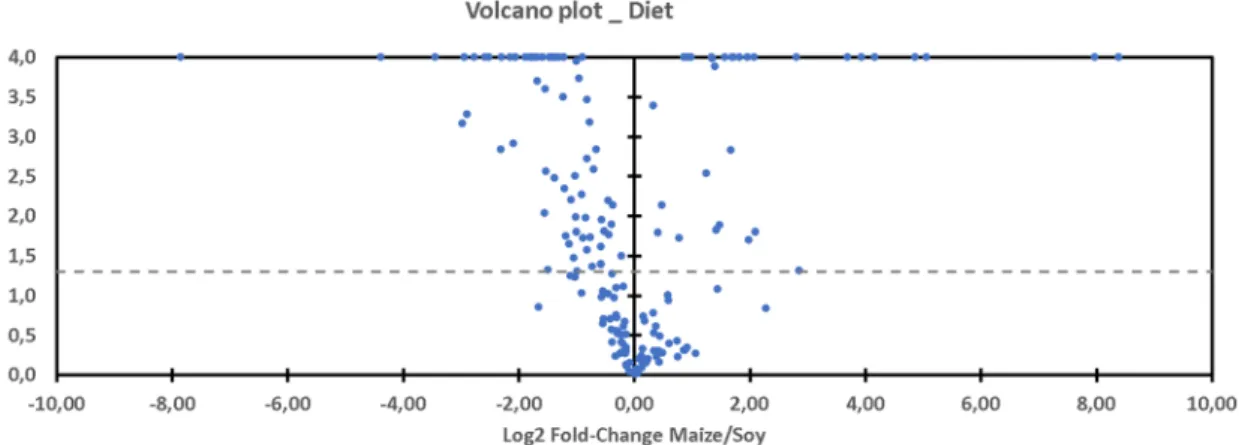
It can be observed on Graph 7 (Volcano Plot, Fig. 7) that the expression in the rat feces of a large part of the metabolites is favored by the soy diet (71 versus 32) compared with the maize-based regime. It is therefore noted that the soy diet has a tendency to increase the quantity of amino-acids and saturated lysophospholipids, and to reduce that of cholic acids in the feces. As the study focuses on DCS, the details of the effects of the diet are not discussed here.
In the case of diagnosis of decompression sickness, 35 metabolites are over-expressed and 2 under-expressed compared with those present in the feces of healthy rats (Volcano Plot, Fig. 8).
Amongst the metabolites linked to clinical status (Fig. 6), 11 are common to diet without there being any interaction (18-0_LysoPC, 18-0_LysoPE, 18-1_LysoPE, C18, carnosine, deoxyadenosine monophosphate, gly-cine, histidine, lithocholate, phosphorylcholine, tricosanoate). On the other hand, 4 other common compounds experience the effects of the interaction of 2 significant factors (dipalmitoylglycerol, hippurate, 2,6-quinolinediol, Gly-Gly). These 4 metabolites are all increased in the case of DCS, even though soy increases the expression of dipalmitoylglycerol and Gly-Gly, and decreases the expression of hippurate and of 2,6-quinolinediol. 2 other compounds would be modified (p = 0.025 and p = 0.040) by the joint action of diet and clinical status, without there being any pure effect due to diet alone or clinical status (glycerol-myristate p = 0.156, N-acetylasparagine p = 0.192), which indicates an antagonist effect of the 2 factors. 1 compound (kynurenine) is increased in the case of DCS (p = 0.027), and this effect is potentialized by the maize diet whereas it is not with soy (p = 0.043). Finally, 3 other compounds modified by diet (5b-cholanic acid-3a-OL-12-ONE p = 0.001, 5′-deoxyadenosine p = 0.0001, pyridoxal p < 0.0001) see their expression changed in the case of DCS (p = 0.037, p = 0.042, p = 0.034) but they do not seem to exercise determinism on the genesis of DCS.
Discussion
Impact of the hyperbaric protocol.
The protocol has caused decompression sickness with neurological clinical signs. As expected, diet per se is not enough to induce DCS but we have been able to establish a link between the expression of fecal metabolites and the illness.Effects of diet.
The purpose of this study is not to analyze and discuss exhaustively the influence of a diet on the different variables studied, but to identify the points influenced by these two diets in order to focus better on those which vary in the case of DCS. So we made the choice to describe only briefly the effects linked to food. Figure 4. Principal component analysis (PCA) plot of fecal metabolome as a function of (A) diet (Soy and Maize) or (B) clinical status (DCS or NoDCS).Figure 5. Heat Map, i.e. hierarchical clustering of fecal metabolomes from rats (n = 64) fed with maize (yellow) or soy (green). Black squares denote DCS status. Fold change for each metabolite is represented by a color. Intensity values are normalized, from red (Min: − 2) to blue (Max: + 2).
Figure 6. Venn diagram with metabolites influenced by diet or clinical status, with interactions. This graph is composed using 2-way ANOVA results.
Figure 7. Volcano plot showing metabolomic data. Differential expression of fecal metabolites (n = 185) in rats exposed to the hyperbaric protocol (n = 64) favored by maize (right) or soy (left). The dashed line shows where p = 0.05 with points above the line having p < 0.05 and points below the line having p > 0.05.
Figure 8. Volcano plot showing metabolomic data. Differential expression of fecal metabolites (n = 185) in rats exposed to the hyperbaric protocol (n = 64) favored by DCS (left) compared to NoDCS (right). The dashed line shows where p = 0.05 with points above the line having p < 0.05 and points below the line having p > 0.05.
We have been able to determine that diet has influenced initial blood parameters Thus, the SOY rats have more platelets but their mobilization does not seem to be more affected. It is also noted that the volume of their erythrocytes is lower24. Amongst other things, this would tend to indicate that they are older or that their pool is
renewed less frequently. However, the volume is not changed after the dive. Amongst the causes of microcytosis are inflammation (see below) and iron deficiencies24, but soy is reputed to be richer in iron, compared to maize18.
In addition, these two parameters do not seem to determine the occurrence of DCS.
At the same time, the levels of exhaled hydrogen are higher in SOY rats, particularly in the DCS SOY rats, which could be a sign of more significant intestinal fermentation in these subjects. This result could be expected given the fermentable nature of soy. During a previous study we have already mentioned that the endogenous production of hydrogen by bacterial fermentation could have a beneficial effect over the long term, arguing for its neuroprotective effects10, or conversely harmful in the short term due to its participation in the expansion
of bubbles11. The absence of clinical difference in this study does not favor any of these scenarios in particular,
so this suggests an equilibrium related to their antagonism. An alternative explanation would be to consider hydrogen as an indicator of a susceptibility to DCS, without necessarily being a cause.
Although not significant as far as clinical status is concerned, the measurement of IL-1β is higher in the SOY rats after diving, which indicates the existence of inflammation.
As far as the fecal metabolome is concerned, as expected its composition depends on diet. So 103 out of the 185 metabolites identified vary as a function of diet (Suppl data 1). As the purpose of our study was principally to understand better the mechanisms of decompression sickness, using two different diets has enabled us to spotlight the metabolites which seem to be an indication for DCS. However, it goes without saying that these metabolites could not exist without food, and that by nature they are therefore influenced by diet and also by microbial activity. Finally, this method has enabled us to restrict our analysis to 37 metabolites.
Metabolome in DCS.
Out of the 37 metabolites linked to clinical status, about fifteen are common to the diet, including 4 which are modulated synergistically.Expression of metabolites indicating an alteration of the host.
The identification of the metabo-lites incriminated in DCS accentuates several large chemical families (Fig. 9) where, in animals suffering from Figure 9. Clustering by chemical and biological similarities of the 37 metabolites significantly altered as a function of clinical status (ref. Venn diagram). The surface of the rectangles takes into account the number of metabolites. A chemical compound is 1 unit and the total area is 37 units. The striped areas correspond to an under-expression and the solid areas to over-expression.DCS, an over-representation of amino-acids (9/37) and dipeptides (5/37), lysophosphatidylcholines (6/37) and other phospholipidic derivatives (2/37) is found. This excess basically suggests less degradation and also less absorption by the intestine. Furthermore, noted in these animals is decreased expression (checkers in Fig. 9) of a fatty acid (2-hydroxycaproic acid) and particularly cholic acid, lithocholate, which is one of the biliary acids, the function of which is to help absorb dietary fats by the formation of micellae. Their second role is to inhibit (by an antiseptic or even antibiotic effect) the proliferation of the bacteria in the upper part of the digestive tract. However, a larger role is now attributed to biliary salts throughout the body25. Coumarins are also found, which
are not very soluble and also require a vector to be absorbed. This coumarin, C18 or 7-[(3-chlorobenzyl)oxy]-4-[(methylamino)methyl]-2 h-chromen-2-one, is an inhibitor of monoamine oxidase-B, which is abundant in the muscular layers of the rats’ colon. Its administration increases dopamine which inhibits colon motility26, which
suggest mobility of the colon in DCS. This deserves to be confirmed.
This observation poses the problem of the integrity of digestive function in the context of DCS. As it happens, liver disorders have already been mentioned in DCS in humans27,28 and animals19,29,30.
Expression of metabolites indicating an alteration in the intestinal microbiota.
An increase in hippurate is observed in the DCS rat group, and more especially in the MAIZE DCS. In rats and also humans an increased quantity of this metabolite is regularly associated with a greater bacterial diversity in the microbiota31–33even though it is also described as the marker for the abundance of bacteroides, the most important group of anaerobic Gram-negative bacilli in the intestine34. At the same time there is an excess of phosphorylcholine
(cho-line), a molecule which in vaccination strategies35,36 activates the immune system. Phosphorylcholine is
con-tained in all Gram-positive and Gram-negative bacteria, and its detection by the M cells (microfold cells) of the cecum, during bacterial over-representation or when there is a digestive tract lesion allowing infiltration, could participate in the inflammatory syndrome that is regularly described in DCS. More globally, the over-expression of this choline suggests that the bacterial populations have been affected. Another interesting marker of the microbiota that could corroborate this alteration of these populations is creatine which is normally excreted from the host by the action of the intestinal microbiota37. In this study the fecal levels of creatine were raised
in the DCS rats compared with the NoDCS rats. Studies show an increase of these molecules in the biofluids of mice treated with antibiotics25,38 and in Germ Free mice39. As for the reduction in 2-hydroxycaproic acid, it could
also signify a decrease in the activity of the anaerobic microbiota: its increase has been shown in buccal micro-bial community rich in anaerobic germs40. It is therefore worth investigating whether the accident-provoking
protocol alters the expression of this metabolite by the microbiota as antibiotics do. A similar action could be expected by the high levels of oxygen (max inhaled PiO2: 2000 mbars) caused by the hyperbaric protocol on the essentially anaerobic bacteria.
Furthermore, xanthine, the pyroglutamate, derivatives of nucleotides and nucleosides, myoinositol, and the diglyceride (dipalmitoylglycerol) are over-represented.
Expression of metabolites suggesting inflammation.
Although it is speculative, it seems that in all the animals suffering DCS a reorganization of the activity of the intestinal microbiota emerges following a change in diet, which has moved from a standard diet to one based on soy or maize. This generally involves the overgrowth of bacterial populations (increased phosphorylcholine) which are trying to adapt to the new diet. This regularly involves an inflammatory reaction on the part of the host41. In the MAIZE DCS rats, thisinflammatory response can be the consequence of a reorganization of the microbiota as is also suggested for the increase in hippurate31–34. As it happens, inflammation in the MAIZE DCS rats is suggested by the joint
increase in kynurenine from the tryptophan metabolism42,43 and in 2,6 quinolinediol with antibiotic properties,
which is thought to control an explosive development of the microbial community. It seems to be limited to the intestine44. Conversely in the SOY DCS rats, it would seem that the inflammatory mechanism differs where there
is only an increase in the IL-1β in the blood.
Finally, it seems that the inflammatory phenomenon, wherever it comes from, is detrimental if there is expo-sure to an at-risk decompression protocol.
Metabolomic analysis by ChemRICH.
We also decided to submit our results to the ChemRICH database45 in order to access enrichment statistics and also to take into account differential expression rates(https ://www.chemr ich.fiehn lab.ucdav is.edu), and in this way compare our interpretations from the bibliog-raphy. It was possible to propose 185 compounds accompanied by the p-values and their variation factor. 183 compounds were accepted. This approach was conducted to analyze the effects of the diets (Supplementary data 2 with Fig. 11) and those linked to clinical status.
The graph from the ChemRICH database (Fig. 10), which uses their chemical similarity to group together the metabolites that are significantly altered depending on clinical status, makes it possible to note a general increase in the quantity of amino-acids, dipeptides, and also saturated and unsaturated lysophosphatidylcholines in the feces of rats affected by DCS.
As regards the excess of dipeptide in the feces, these results seem to show less protein breakdown in the intestine with, at the same time, less absorption of amino-acids. On this graph a larger amount of lysophosphati-dylcholine, and constituents of the bacterial membranes is seen.
This result agrees with the previous result even though the ChemRICH analysis only shows 22 compounds, including only 12 of the 37 metabolites deemed to be significantly altered by ANOVA-2.
Moderation and openness.
It must be remembered that this work has not studied cecal composition exhaustively and that it is possible that metabolites which were not analyzed in this study may play a determinant role.We have shown that a certain number of cecal metabolites are linked to DCS without making a direct link between diet and diagnosis. However, as this study was linked to maize and soy, it is not possible to exclude the fact that another diet could have an influence on a large number of compounds linked to clinical status and thus actually induce DCS. Conversely, it would seem interesting to determine a diet, or even modulate the intestinal microbiota, with the purpose of targeting this range of metabolites and thus seek to reduce the impact of the hyperbaric protocol.
We have mentioned less absorption and possible liver failure on the basis of the identification of specific metabolites, but it seems necessary to specify that the metabolites measured here are the fruit of digestion of exogenous (nutrition) and endogenous (intestinal cell debris, etc.) substrates, which are themselves subject to microbial activity (fermentation), and that as such it remains difficult to identify their exact source correctly. The identification of the bacterial sources present would probably make it possible to clarify this point. Neverthe-less, a complete study would be necessary to discern the effects of diving and hyperoxia on the various bacte-rial strains (strictly anaerobic or not) and their RNA integrity, while knowing which falls under the diet. This proposal involves considerably increasing the number of animals required to know the situation before diving.
Finally, from a clinical point of view, it would be interesting to consider how much the alteration of the bacte-rial community affects the prognosis in the short and medium term, and consequently whether it too should be the subject of investigation. As a result, it should be taken into account in DCS therapeutic in order to improve its condition or avoid further degrading it, by limiting the side effects of hyperbaric oxygen therapy on anerobic species for example.
Conclusion
This study shows for the first time the spectral fingerprint of the ceca metabolome in animals exposed to a pro-vocative decompression, while evaluating the diet effects. On the one hand, statistical analysis shows a general over-expression (35/37 metabolites) of amino-acids, dipeptides, and lysophosphatidylcholines, and on the other a reduction in lithocholate, a biliary salt in animals suffering of decompression sickness. These results suggest Figure 10. ChemRICH set enrichment statistics diagram. Each disc reflects a significantly altered family of metabolites. Enrichment p-values are given by the Kolmogorov–Smirnov test. Disc sizes represent the total number of metabolites in each group set. Red discs present Increased metabolites while blue ones show decreased compounds in NoDCS rats compared to DCS rats. Intermediates color have both increased and decreased metabolites. For example, there are fewer amino-acids in the feces of NoDCS rats, which is to say that there are more in DCS rats. Insert: volcano plot showing the metabolic dys-regulation in rats exposed to a provocative dive, detailing which of the most significantly altered metabolites were not mapped to metabolic pathways.
an intestinal disorder with alteration in the microbial community with the liver being affected, probably linked to inflammation, but additional studies must verify this more specifically.
More generally, we have demonstrated that the choice of a diet, insofar as it modifies the fecal metabolome, may favor the over-expression of some metabolites linked to the pathology. Even though the diet alone may not be enough to induce decompression sickness, it would seem prudent to verify, in future studies, whether other diets can limit this expression and thus reduce the impact of hyperbaric exposures.
Received: 13 February 2020; Accepted: 11 September 2020
References
1. Bert, P. Barometric Pressure (La Pression Barométrique). (Bethesda, MD: Undersea Medical Society). Translated by Hitchcok, MA. and Hitchcok, FA in 1978 (1978).
2. Sawatzky, K. D. & Nishi, R. Y. Assessment of inter-rater agreement on the grading of intravascular bubble signals. Undersea Biomed.
Res. 18, 373–396 (1991).
3. Brubakk, A. O., Neuman, T. S. & Elliott, D. H. Bennett and Elliott’s Physiology and Medicine of Diving. (Saunders, 2003). 4. Gempp, E. & Blatteau, J. E. Risk factors and treatment outcome in scuba divers with spinal cord decompression sickness. J. Crit.
Care 25, 236–242. https ://doi.org/10.1016/j.jcrc.2009.05.011 (2010).
5. Bernalier-Donadille, A. Principales fonctions métaboliques de la flore intestinale de. l’homme (Flore microbienne intestinale. Physi-ologie et pathPhysi-ologie digestive, Montrouge, 2004).
6. Louis, P. & Flint, H. J. Formation of propionate and butyrate by the human colonic microbiota. Environ. Microbiol. 19, 29–41. https ://doi.org/10.1111/1462-2920.13589 (2017).
7. Kayar, S. R. & Fahlman, A. Decompression sickness risk reduced by native intestinal flora in pigs after H2 dives. Undersea Hyperb.
Med. 28, 89–97 (2001).
8. Kayar, S. R., Fahlman, A., Lin, W. C. & Whitman, W. B. Increasing activity of H(2)-metabolizing microbes lowers decompression sickness risk in pigs during H(2) dives. J. Appl. Physiol. 1985(91), 2713–2719. https ://doi.org/10.1152/jappl .2001.91.6.2713 (2001). 9. Kayar, S. R. et al. Decompression sickness risk in rats by microbial removal of dissolved gas. Am. J. Physiol. 275, R677-682 (1998). 10. de Maistre, S., Vallee, N., Gaillard, S., Duchamp, C. & Blatteau, J. E. Stimulating fermentation by the prolonged acceleration of gut
transit protects against decompression sickness. Sci. Rep.8, 10128, https ://doi.org/10.1038/s4159 8-018-28510 -x (2018). 11. de Maistre, S. et al.Colonic Fermentation Promotes Decompression sickness in Rats. Sci. Rep.6, 20379, https ://doi.org/10.1038/
srep2 0379 (2016).
12. de Maistre, S. et al. Gut fermentation seems to promote decompression sickness in humans. J. Appl. Physiol. (1985)121, 973–979, https ://doi.org/10.1152/jappl physi ol.00503 .2016 (2016).
13. Jonathan, M. C. et al. In vitro fermentation of 12 dietary fibres by faecal inoculum from pigs and humans. Food Chem. 133, 889–897 (2012).
14. Tian, L. et al. Effect of oat and soybean rich in distinct non-starch polysaccharides on fermentation, appetite regulation and fat accumulation in rat. Int. J. Biol. Macromol. 140, 515–521 (2019).
15. Coward, D. G. & Whitehead, R. Experimental protein-energy malnutrition in baby baboons: Attempts to reproduce the pathologi-cal features of kwashiorkor as seen in Uganda. Br. J. Nutr. 28, 223–237 (1972).
16. Williams, C. D. A nutritional disease of childhood associated with a maize diet. Arch. Dis. Child. 8, 423 (1933). 17. Golden, M. H. & Ramdath, D. Free radicals in the pathogenesis of kwashiorkor. Proc. Nutr. Soc. 46, 53–68 (1987).
18. Leng, B. et al. Severe gut microbiota dysbiosis caused by malnourishment can be partly restored during 3 weeks of refeeding with fortified corn-soy-blend in a piglet model of childhood malnutrition. BMC Microbiol. 19, 277 (2019).
19. Cosnard, C. et al. Thirty-five day fluoxetine treatment limits sensory-motor deficit and biochemical disorders in a rat model of decompression sickness. Front. Physiol. 8, 604. https ://doi.org/10.3389/fphys .2017.00604 (2017).
20. Gungor, B., Adiguzel, E., Gursel, I., Yilmaz, B. & Gursel, M. Intestinal microbiota in patients with spinal cord injury. PLoS ONE
11, e0145878. https ://doi.org/10.1371/journ al.pone.01458 78 (2016).
21. von Euler, M., Akesson, E., Samuelsson, E. B., Seiger, A. & Sundstrom, E. Motor performance score: a new algorithm for accurate behavioral testing of spinal cord injury in rats. Exp. Neurol.137, 242–254, https ://doi.org/10.1006/exnr.1996.0023 (1996). 22. Pockett, S. & Gavin, R. M. Acceleration of peripheral nerve regeneration after crush injury in rat. Neurosci. Lett. 59, 221–224
(1985).
23. Rosique, C. et al. Assessment of the effects of repeated doses of potassium iodide intake during pregnancy on male and female rat offspring using metabolomics and lipidomics. J. Toxicol. Environ. Health A 82, 603–615. https ://doi.org/10.1080/15287 394.2019.16254 74 (2019).
24. Blann, A. & Ahmed, N. Blood Science: Principles and Pathology. (Wiley, 2014).
25. Swann, J. R. et al. Systemic gut microbial modulation of bile acid metabolism in host tissue compartments. Proc. Natl. Acad. Sci.
108, 4523–4530 (2011).
26. Liu, C.-Z. et al. Rasagiline, an inhibitor of MAO-B, decreases colonic motility through elevating colonic dopamine content.
Neu-rogastroenterol. Motil. 30, e13390. https ://doi.org/10.1111/nmo.13390 (2018).
27. L’Abbate, A. et al. Post-dive ultrasound detection of gas in the liver of rats and scuba divers. Eur. J. Appl. Physiol. 111, 2213–2219. https ://doi.org/10.1007/s0042 1-011-1857-8 (2011).
28. Vallee, N., Gaillard, S., Peinnequin, A., Risso, J. J. & Blatteau, J. E. Evidence of cell damages caused by circulating bubbles: high level of free mitochondrial DNA in plasma of rats. J. Appl. Physiol. 1985(115), 1526–1532. https ://doi.org/10.1152/jappl physi ol.00025 .2013 (2013).
29. Vallee, N. et al. Fluoxetine protection in decompression sickness in mice is enhanced by blocking TREK-1 potassium channel with the “spadin” antidepressant. Front. Physiol. 7, 42. https ://doi.org/10.3389/fphys .2016.00042 (2016).
30. L’Abbate, A. et al. Gas embolization of the liver in a rat model of rapid decompression. Am. J. Physiol. Regul. Integr. Comp. Physiol.
299, R673-682. https ://doi.org/10.1152/ajpre gu.00699 .2009 (2010).
31. Barbara, G. et al. Gut microbiota, metabolome and immune signatures in patients with uncomplicated diverticular disease. Gut
66, 1252–1261. https ://doi.org/10.1136/gutjn l-2016-31237 7 (2017).
32. Swann, J. R. et al. Variation in antibiotic-induced microbial recolonization impacts on the host metabolic phenotypes of rats. J
Proteome Res 10, 3590–3603. https ://doi.org/10.1021/pr200 243t (2011).
33. Pallister, T. et al. Hippurate as a metabolomic marker of gut microbiome diversity: Modulation by diet and relationship to metabolic syndrome. Sci. Rep. 7, 13670. https ://doi.org/10.1038/s4159 8-017-13722 -4 (2017).
34. Bajaj, J. S. et al. Systems biology analysis of omeprazole therapy in cirrhosis demonstrates significant shifts in gut microbiota composition and function. Am. J. Physiol. Gastrointest. Liver Physiol. 307, G951-957. https ://doi.org/10.1152/ajpgi .00268 .2014 (2014).
35. Ohori, J., Iuchi, H., Maseda, Y. & Kurono, Y. Phosphorylcholine intranasal immunization with a 13-valent pneumococcal conjugate vaccine can boost immune response against Streptococcus pneumoniae. Vaccine https ://doi.org/10.1016/j.vacci ne.2019.10.043 (2019).
36. Trolle, S. et al. Intranasal immunization with protein-linked phosphorylcholine protects mice against a lethal intranasal challenge with Streptococcus pneumoniae. Vaccine 18, 2991–2998. https ://doi.org/10.1016/s0264 -410x(00)00089 -x (2000).
37. Wyss, M. & Kaddurah-Daouk, R. Creatine and creatinine metabolism. Physiol. Rev. 80, 1107–1213 (2000).
38. Romick-Rosendale, L. E. et al. NMR-based metabonomics analysis of mouse urine and fecal extracts following oral treatment with the broad-spectrum antibiotic enrofloxacin (Baytril). Magn. Reson. Chem. 47, S36–S46 (2009).
39. Marcobal, A. et al. A metabolomic view of how the human gut microbiota impacts the host metabolome using humanized and gnotobiotic mice. ISME J. 7, 1933 (2013).
40. Antiabong, J. F., Jardine, D., Boardman, W., Brown, M. H. & Ball, A. S. A molecular ecological approach to the detection and desig-nation of the etiological agents of a model polymicrobial disease. J. Vet. Diagn. Invest. 25, 467–472. https ://doi.org/10.1177/10406 38713 49362 8 (2013).
41. Maslennikov, R., Pavlov, C. & Ivashkin, V. Is small intestinal bacterial overgrowth a cause of hyperdynamic circulation in cirrhosis?.
Turk. J. Gastroenterol. 30, 964–975 (2019).
42. Keszthelyi, D., Troost, F. J. & Masclee, A. A. Understanding the role of tryptophan and serotonin metabolism in gastrointestinal function. Neurogastroenterol. Motil. 21, 1239–1249. https ://doi.org/10.1111/j.1365-2982.2009.01370 .x (2009).
43. Sorgdrager, F. J. H., Naudé, P. J. W., Kema, I. P., Nollen, E. A. & Deyn, P. P. D. Tryptophan metabolism in inflammaging: From biomarker to therapeutic target. Front. Immunol.10, https ://doi.org/10.3389/fimmu .2019.02565 (2019).
44. Walker, A. K., Kavelaars, A., Heijnen, C. J. & Dantzer, R. Neuroinflammation and comorbidity of pain and depression. Pharmacol
Rev 66, 80–101. https ://doi.org/10.1124/pr.113.00814 4 (2014).
45. Barupal, D. K. & Fiehn, O. Chemical Similarity Enrichment Analysis (ChemRICH) as alternative to biochemical pathway mapping for metabolomic datasets. Sci. Rep. 7, 14567. https ://doi.org/10.1038/s4159 8-017-15231 -w (2017).
Author contributions
S.d.M and N.V. for conception and design of research; S.d.M., S.G., J.-C.M., C.T., J.-J.R. and N.V. performed the experiments; S.d.M., J.-C.M. and N.V. analyzed data; S.d.M., S.G., Si.R., A.B., J.-E.B., J.-C.M., C.T., A.-V. D. J.-J.R., Sa. R. and N.V. interpreted the results of the experiments; N.V. prepared the figures; N.V. drafted, edited and revised the manuscript; S.d.M and N.V. approved the final version of the manuscript.
Funding
The work should be attributed to the “Institut de Recherches Biomédicales des Armées” laboratories. It is sup-ported by Grant No. SAN-1-0516 from the Direction Générale de l’Armement of the French Army, Paris, France.
Competing interests
The authors declare no competing interests.
Additional information
Supplementary information is available for this paper at https ://doi.org/10.1038/s4159 8-020-73033 -z. Correspondence and requests for materials should be addressed to N.V.
Reprints and permissions information is available at www.nature.com/reprints.
Publisher’s note Springer Nature remains neutral with regard to jurisdictional claims in published maps and institutional affiliations.
Open Access This article is licensed under a Creative Commons Attribution 4.0 International License, which permits use, sharing, adaptation, distribution and reproduction in any medium or format, as long as you give appropriate credit to the original author(s) and the source, provide a link to the Creative Commons licence, and indicate if changes were made. The images or other third party material in this article are included in the article’s Creative Commons licence, unless indicated otherwise in a credit line to the material. If material is not included in the article’s Creative Commons licence and your intended use is not permitted by statutory regulation or exceeds the permitted use, you will need to obtain permission directly from the copyright holder. To view a copy of this licence, visit http://creat iveco mmons .org/licen ses/by/4.0/.