Publisher’s version / Version de l'éditeur:
Journal of the Illuminating Engineering Society, 23, Summer 2, pp. 72-85, 1994
READ THESE TERMS AND CONDITIONS CAREFULLY BEFORE USING THIS WEBSITE.
https://nrc-publications.canada.ca/eng/copyright
Vous avez des questions? Nous pouvons vous aider. Pour communiquer directement avec un auteur, consultez la
première page de la revue dans laquelle son article a été publié afin de trouver ses coordonnées. Si vous n’arrivez pas à les repérer, communiquez avec nous à [email protected].
Questions? Contact the NRC Publications Archive team at
[email protected]. If you wish to email the authors directly, please see the first page of the publication for their contact information.
NRC Publications Archive
Archives des publications du CNRC
This publication could be one of several versions: author’s original, accepted manuscript or the publisher’s version. / La version de cette publication peut être l’une des suivantes : la version prépublication de l’auteur, la version acceptée du manuscrit ou la version de l’éditeur.
Access and use of this website and the material on it are subject to the Terms and Conditions set forth at
Performance of compact fluorescent lamps at different ambient
temperatures
Collins, B. L.; Treado, S. J.; Ouellette, M. J.
https://publications-cnrc.canada.ca/fra/droits
L’accès à ce site Web et l’utilisation de son contenu sont assujettis aux conditions présentées dans le site LISEZ CES CONDITIONS ATTENTIVEMENT AVANT D’UTILISER CE SITE WEB.
NRC Publications Record / Notice d'Archives des publications de CNRC:
https://nrc-publications.canada.ca/eng/view/object/?id=3cbbcdaf-df0f-4a3d-a888-cc63bd89f53a https://publications-cnrc.canada.ca/fra/voir/objet/?id=3cbbcdaf-df0f-4a3d-a888-cc63bd89f53aPe rform a nc e of c om pa c t fluore sc e nt la m ps a t diffe re nt a m bie nt
t e m pe ra t ure s
N R C C - 3 7 8 4 6
C o l l i n s , B . L . ; T r e a d o , S . J . ; O u e l l e t t e , M . J .
S u m m e r 1 9 9 4
A version of this document is published in / Une version de ce document se trouve dans:
Journal of the Illuminating Engineering Society, 23, (2), Summer, pp. 72-85, 94
http://www.nrc-cnrc.gc.ca/irc
The material in this document is covered by the provisions of the Copyright Act, by Canadian laws, policies, regulations and international agreements. Such provisions serve to identify the information source and, in specific instances, to prohibit reproduction of materials without written permission. For more information visit http://laws.justice.gc.ca/en/showtdm/cs/C-42
Les renseignements dans ce document sont protégés par la Loi sur le droit d'auteur, par les lois, les politiques et les règlements du Canada et des accords internationaux. Ces dispositions permettent d'identifier la source de l'information et, dans certains cas, d'interdire la copie de documents sans permission écrite. Pour obtenir de plus amples renseignements : http://lois.justice.gc.ca/fr/showtdm/cs/C-42
72
...
Performance of Compact Fluorescent Lamps at
Different Ambient Temperatures
B.L. Collins (1), SJ. Treado (1), and MJ. Ouellette (2)
Introduction
Compact fluorescent lamps are used to replace in· candescent lamps to aid in energy conservation in commercial and domestic lighting applications. In particular, they offer the benefits of much longer life and lower operating costs in a reasonably similar package.2 Some of the performance characteristics familiar to residential users may differ for the newer lamp technology. Such characteristics include response to ambient thermal conditions, sensitivity to lamp position, flicker, harmonics, etc. Of particular concern is the response to ambient thermal condi· tions, since lamps are used in unconditioned spaces, such as garages, basements, barns, and similar spaces where they may be subjected to extremes in temperature, both hot and cold. While it is well known that fluorescent lamp performance is determined by the cold spot on the lamp and can be affected by the ambient temperature in the room,5 the extent to
which these findings, particularly for extreme in temperatures, apply to compact fluorescent lamp ap· plications is not well understood.
In conjunction with the Institute for Research in Construction (IRC) at the National Research Council, Canada (NRCC), the Lighting Group at the National Institute of Standards and Technology (NIST) con-ducted an experimental evaluation of twelve sets of different types of compact fluorescent lamps at six different ambient temperature conditions. An addi-tional set of incandescent lamps was also evaluated for comparison. A total of three lamps were tested for each of the thirteen lamp types, both compact fluores-cent and incandesfluores-cent.
Procedure
Using a large environmental chamber, NIST per· formed a number of tests on the compact fluorescent samples at six different ambient temperatures. The in· tent of the research project was to investigate the sen· sitivity of different compact fluorescent lamp types to various ambient temperatures, rather than to characterize the performance of specific lamps. Thus, Authors' affiliations: I. Building and Fire Research Laboratory, Gaithersburg, MD. 2. National Research Council Canada, Ottawa, ON, Canada
THIS PAPER WAS PRESENTED AT THE 1993 IESNA ANNUAL CONFERENCE
while no attempt was made to select identical lamp types from various manufacturers, test lamp samples were selected to cover a range of lamp/ballast types to enable some assessment of the effects of lamp type, ballast type, and the presence of an enclosure on temperature sensitivity. The compact fluorescent lamps were provided by NRCC/IRC and had been burned-in for approximately 100 hrs prior to the NIST tests. Details of the experimental procedure are discussed in a companion report by Collins, Treado, and Ouellette.3 Each set of tests involved
measure-ments of a set of three identical compact fluorescent lamps mounted base-up on a metal frame suspended in the environmental chamber. Lamps were mounted on each of three arms radiating from a central area. The entire array was suspended from an overhead arm. Each lamp was approximately 60 em from its neighbors and suspended about 1 m above a diffuse white plate and photocell used to monitor light out-put during the testing.
Lamps 1-12 consisted of sets of three identical compact fluorescent lamps, while lamp 13 was a set of three 60-W incandescent lamps used as the reference lamp for comparison. The incandescent lamps, which are known not to be sensitive to temperature, were in-cluded for reference measurements and to provide a means for checking instrumentation stability. All the compact fluorescent samples were designed to operate at 120 V AC. Power ratings ranged from 13 to 28 W. The lamp sets are described as follows:
Lamp 1: T4 13-W twin tube with plug in magnetic ballast
Lamp 2: 16-W globe with integral ballast and screw in base
Lamp 3: T4 20-W quad tube with integral ballast and screw in base
Lamp 4: T4 18W globe with integral ballast and screw in base
Lamp 5: T4 13-W quad tube with integral ballast and screw in base
Lamp 6: Lamp 5 with a globe
Lamp 7: T4 26-W quad tube with external ballast and mounting hardware
...
Lamp 8: T5 24-W twin tube with external ballast and mounting hardware
Lamp 9: T5 28-W quad tube with external ballast and mounting hardware
Lamp 10: T4 13-W twin tube with separate ballast adapter and screw base
Lamp 11: 13-W twin tube with integral ballast and screw in base
Lamp 12: Low voltage (12 V) 13W twin tube with separate ballast and mounting hardware
Lamp 13: 60-W frosted incandescent aquarium lamp
Lamps 3 and 4 contained integral electronic ballasts, while all the other lamps had magnetic-core ballasts, either separate or integraL Lamps 7 and 8 included high-power-factor-correction circuits, while lamp 8 also contained a constant illumination circuit intended to provide constant illumination throughout a range of voltages. Since there were three samples for each lamp type, individual lamps in a set were designated as A, B, and C.
Lamp performance was evaluated for a total of six temperatures ranging from 45 °C to 18 °C, including the burn-in temperature of 25 °C. The temperatures included 45, 25, 10, 0, -9, and -18 °C (113, 77, 50, 32, 16, and 0 °F). Temperature in the environmental chamber was maintained to within
±
1.5 °C. At each temperature condition, the following parameters were measured:• lamp ignition time or failure
• time to luminous equilibrium and electrical stabilization
• relative luminous flux density at a point 1 m below the central point
• electrical power in watts and volt amps
• minimum lamp wall or globe temperature as applicable
• relative luminous efficacy • total harmonic distortion • power factor
In addition lamp performance was assessed for a simulated frost condition in which lamps were misted at -4 °C and time to ignition determined.
The luminous output of the lamps was measured in two ways, by measuring illuminance beneath the lamp array, and by measuring the luminance of a white tile also located beneath the lamps. Two measurement methods were used to control for possible changes in the responsiveness of the illuminance photocell due to ambient temperature. The silicon photocell was mounted 1 m below the center of the lamps and at· tached to a datalogger that recorded light output con· tinuously, allowing for a determination of luminous
73
equilibrium. The silicon cell was a photovoltaic cell with a Vx filter, and a cosine diffuser connected to an amplifier. A Minolta luminance meter was used to measure luminance from the white plate located at the center of the three lamps also located 1 m below the mounting center for the three lamps after equilibrium, allowing the determination of lamp light output (relative to the same lamps at other temperatures). This meter was positioned about 2 m from the plate at about 30° from normal for the measurements, and was removed from the chamber between measurements to minimize all thermal effects.
It should be noted that since the photometric distribution of the various lamp types differed, lamp light output cannot be compared across lamp types. Such a comparison would have required the measure· ment oflamp total luminous flux (such as would be ob· tained in an integrating sphere or distribution photometer). However, the intent of the project was to investigate the effect of ambient temperature on lamp performance, not to compare various lamps, a task for which relative light output as measured is well suited. Relative light output was measured once the lamps had been determined to be at luminous and electrical equilibrium. The temperature of each of the three lamps was measured by means of a thermocouple at· tached to the bottom tip of each lamp (or globe where applicable) and connected to the datalogger as well. A fourth thermocouple monitored ambient temper· ature in the environmental chamber. The four temperature and luminous photocell outputs were recorded by the datalogger every 5 min. All photocells and thermocouples were located in the environmental chamber throughout the measurement period. The photocell manufacturer reported minimal sensitivity to temperature extremes for the visible range at the temperatures tested.
A power profiler recorded electrical information in· eluding voltage, current, power, total harmonic dis tor· tion, power factor, and changes in electrical characteristics of the lighting systems over time. All elec· trical recording equipment was located in a room out· side the environmental chamber to maintain temperature stability. (Luminance readings were taken rapidly once the lamps had reached equilibrium using the luminance meter which was normally kept outside the chamber.) Power to the lamps was provided by means of a regulated power supply which maintained an input voltage at 122
±
1 V and THD±
3 percent. The low voltage system was powered by a 20.Ydc power supply operating at 12±
0.1 V.The three lamps were mounted on the test apparatus prior to beginning each test session and setting the temperature in the environmental chamber. After the environmental chamber (and lamps) had stabilized
JOURNAL of the Illuminating Engineering Society Summer 1994
74
at the pre-determined test temperature, the lamps were ignited. Time to ignition was measured in seconds. Lamp wall and ambient temperature were measured and recorded every 5 min, while the electrical parameters were continuously monitored and record-ed. In addition, a record oflamp system input electrical conditions was taken at the beginning and end of a test session for each lamp type. Lamp relative light output (luminance) was measured at the end of each test ses-sion using the luminance meter. Throughout each test session, lamp light output was monitored using a silicon photocell. (This output is referred to subsequently as photocell output.) Lamps were considered to be at equilibrium. when three light output (photocell) readings taken consecutively within 15 min did not dif· fer by more than
±
1 percent. Data are reported for all three lamps combined except where failure of one or more lamps occurre.d.Experimental results
Lamp performance was measured for ambient tem-peratures in the following order: 25, 45, 10, 0, -9, - 18, -4 with mist, and 25
oc
again. The baseline condition, 25 °C, was repeated at the end to determine changes in lamp performance or the extent of lamp degradation as a function of thermal stress and operation. The re-sults for the repeated condition are designated as 25R. In addition, where one of the lamps failed dur-ing the course of the data collection, measures were repeated at 25oc
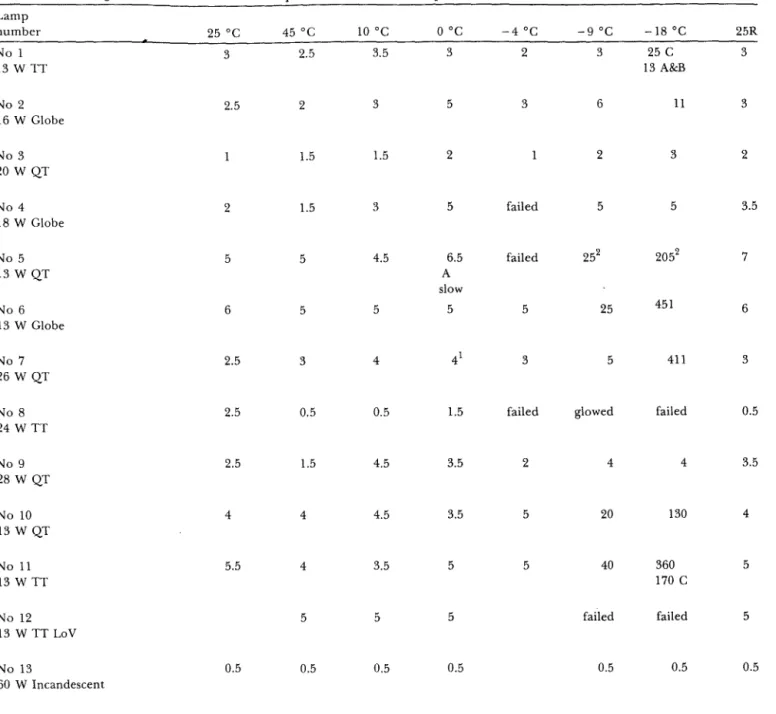
with only two lamps (noted as 25-2 in the table).Table 1 summarizes the results for the time to lamp ignition or failure (when appropriate). Lamps were con-sidered to have failed if they did not ignite within 5 min of being started. Since three lamps were as-sessed, there were three possibilities for failure. No lamps failed for temperatures greater than 0 °C. At 0 °C, however, there were two failures. Lamp 7B broke when tapped gently during the mounting procedure, and lamp 8B refused to start at this temperature. At -9 °C lamp 5C refused to start, as did all three lamps in group 8. At -18 °C, lamp 5C ignited only after the wires in its socket were tightened. Lamp 12 refused to start at temperatures below 0 °C, with one lamp fail· ing at the initial 25
oc
condition. This lamp failed because an uninsulated diode was shorted out after touching the "live" ballast housing. As a result, much less complete data were obtained for lamp 12. Lamp SA (and consequently 6A) began to experience ignition problems at 10 °C. It required adjusting the socket and twisting the lamp to get it to ignite. It finally failed com-pletely at -18 °C. Most lamps evidenced problems at the coldest conditions (- 18oc
or 0 °F) with only lamps 3, 4, 9, and 13 starting rapidly.Table 2 summarizes lamp performance data
ob-...
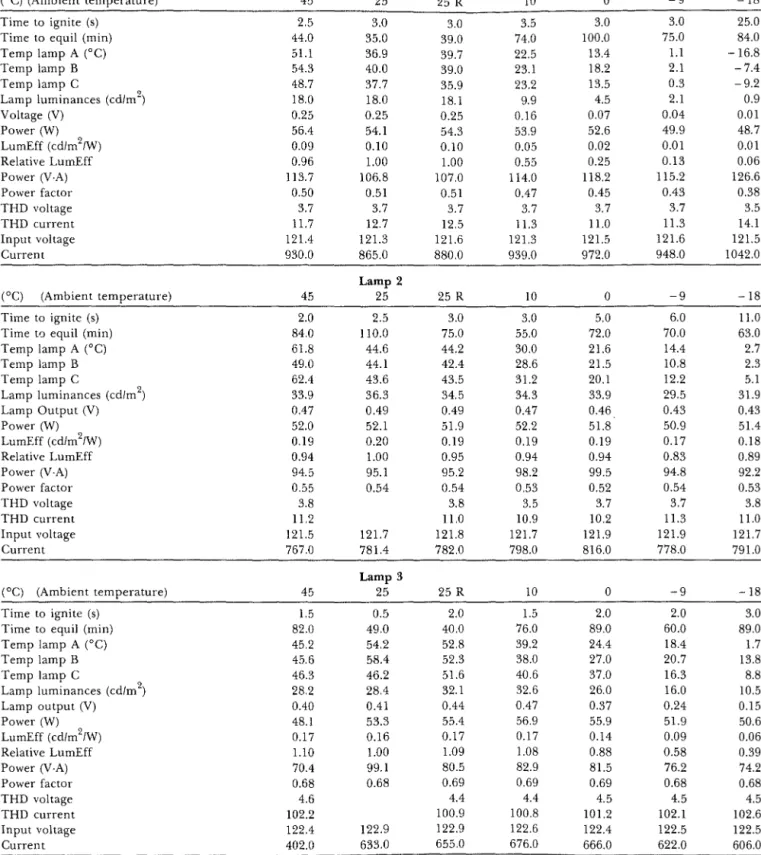
tained once the lamps had achieved thermal and luminous equilibrium. This table presents data on time to ignition (in seconds), time to luminous equilibrium (in minutes), temperature at the bottom tip of each lamp, lamp luminance in cd/m2
, lamp
light output (in nominal volts), luminous efficacy (in cd/m2/W), relative luminous efficacy (relative to
per-formance at 25 °C, lamp input power in watts and volt amps, power factor, total harmonic distortion (for voltage and current), input voltage, and input current for each test. (Blanks in the table represent conditions for which no data were obtained.)
The next set of data discussed pertain to the time to luminous equilibrium, as well as for total light output over time for all lamps except lamp 12. Luminous equilibrium was defined as three consecutive readings that did not deviate by more than 1 percent from the immediately preceding measurement. Data for deter-mining luminous equilibrium were typically collected for 60-90 min in 5 min increments following igni-tion. Relative light output was determined by averag· ing the last three photocell readings, and then dividing each prior reading by this mean.
For lamp 1, light output was almost identical for 25 and 45 °C, with time to equilibrium achieved rapidly and maintained for 1 to 1.5 hrs. At 10 °C light output reached the same levels but then declined to a new, much lower equilibrium level after 60- 70 min. At even cooler temperatures, light output peaked and then declined markedly with equilibrium occurring after about 60 -70 min. Relative light output declined steadily over time at the cooler temperatures to a value ofless than half that at 25 °C. Unlike lamp 1, the data for lamp 2 showed much less variation over time as a function of temperature, although the data show-ed a peculiar initial decline in output for the two higher temperatures followed by a return to approx-imately the same light output obtained for the other temperatures. Total light output was much higher than for lamp 1 and was much less affected by changes in room temperature; perhaps because of the presence of a globe that insulated it. The time to luminous equilibrium and the relative light output for lamp 3 was about the same regardless of tempera-ture. The overall light output was highly temperature dependent, dropping markedly for temperatures below 0 °C. Lamp 3 did not really reach a stable equilibrium at either -9 or - 18 °C during the 90 min of operation.
Lamp 4 demonstrated much less decline in light output than lamp 3 as a function of time and ambient temperature. For most of the ambient temperatures, light output was relatively constant after about 30 to 60 min. At - 18 °C, however, there was a noticeable decline in light output after about an hour at that
...
75
Table !-Time to ignition in seconds for each lamp set at each ambient temperatureLamp number 25 oc 45 oc 10 oc 0 oc -4°C -9oC -18 °C 25R No 1 3 2.5 3.5 3 2 3 25
c
3 13 W TT 13 A&B No 2 2.5 2 3 5 3 6 11 3 16 W Globe No 3 1.5 1.5 2 2 3 2 20 W QT No 4 2 1.5 3 5 failed 5 5 3.5 18 W Globe No 5 5 5 4.5 6.5 failed 252 2052 7 13 W QT A slow No 6 6 5 5 5 5 25 451 6 13 W Globe No 7 2.5 3 4 41 3 5 411 3 26 W QTNo 8 2.5 0.5 0.5 1.5 failed glowed failed 0.5
24 WTT No 9 2.5 1.5 4.5 3.5 2 4 4 3.5 28 W QT No 10 4 4 4.5 3.5 5 20 130 4 13 W QT No 11 5.5 4 3.5 5 5 40 360 5 13 W TT 170
c
No 12 5 5 5 failed failed 5 13 W TT LoV No 13 0.5 0.5 0.5 0.5 0.5 0.5 0.5 60 W Incandescent 17C just broke before 0 ° C condition due to its increased fragility in the cold 2
A failed
temperature. The data suggests that light output for lamp 4 reached an early peak, dropped back and then increased for the coldest and warmest temperatures. Light output for this set of lamps [which also had a surrounding globe] appeared relatively unaffected by temperature.
On the other hand, luminous output for lamp 5 was noticeably reduced at the two coldest temperatures, with an initially higher output followed by a decline after about 20 to 30 minutes at -9 and -18 °C. One of the lamps (C) in set 5 actually failed at these temperatures. At temperatures above - 9 °C, light out-put from these lamps tended to reach an equilibrium
relatively rapidly and maintain it, however. When these same lamps were placed in an enclosure (for the lamp 6 configuration), the surrounding globe ap-parently insulated them from the effects of the colder ambient temperatures since light output for lamp 6 was higher at both - 9 and - 18 °C and was more stable over time, than for lamp 5.
Lamp 7 tended to reach equilibrium early, with relatively little fluctuation in output over time. There was a marked decline in light output as temperature deviated from 25 °C, however. (It should be pointed out that the data at the lowest temperatures represent the output of only two lamps since one was broken
76
...
Table 2-Summary of Test Results for Each Lamp Set as a Function of Ambient Temperature Lamp 1
( 0C) (Ambient temperature) 45 25 25 R 10 0 -9 -18
Time to ignite (s) 2.5 3.0 3.0 3.5 3.0 3.0 25.0
Time to equil (min) 44.0 35.0 39.0 74.0 100.0 75.0 84.0
Temp lamp A (0C) 51.1 36.9 39.7 22.5 13.4 l.l -16.8
Temp lamp B 54.3 40.0 39.0 23.1 18.2 2.1 -7.4
Temp lamp C 48.7 37.7 35.9 23.2 13.5 0.3 -9.2
Lamp luminances (cdim2) 18.0 18.0 18.1 9.9 4.5 2.1 0.9
Voltage (V) 0.25 0.25 0.25 0.16 0.07 0.04 0.01 Power (W) 56.4 54.1 54.3 53.9 52.6 49.9 48.7 LumEff (cd/m2/W) 0.09 0.10 0.10 0.05 0.02 0.01 0.01 Relative LumEff 0.96 1.00 1.00 0.55 0.25 0.13 0.06 Power (V·A) 113.7 106.8 107.0 114.0 118.2 115.2 126.6 Power factor 0.50 0.51 0.51 0.47 0.45 0.43 0.38 THD voltage 3.7 3.7 3.7 3.7 3.7 3.7 3.5 THD current 11.7 12.7 12.5 11.3 11.0 11.3 14.1 Input voltage 121.4 121.3 121.6 121.3 121.5 121.6 121.5 Current 930.0 865.0 880.0 939.0 972.0 948.0 1042.0 Lamp 2
(OC) (Ambient temperature) 45 25 25 R 10 0 -9 -18
Time to ignite (s) 2.0 2.5 3.0 3.0 5.0 6.0 11.0
Time to equil (min) 84.0 110.0 75.0 55.0 72.0 70.0 63.0
Temp lamp A (°C) 61.8 44.6 44.2 30.0 21.6 14.4 2.7
Temp lamp B 49.0 44.1 42.4 28.6 21.5 10.8 2.3
Temp lamp C 62.4 43.6 43.5 31.2 20.1 12.2 5.1
Lamp luminances (cdim2) 33.9 36.3 34.5 34.3 33.9 29.5 31.9
Lamp Output (V) 0.47 0.49 0.49 0.47 0.46 0.43 0.43 Power (W) 52.0 52.1 51.9 52.2 51.8 50.9 51.4 LumEff (cd/m2/W) 0.19 0.20 0.19 0.19 0.19 0.17 0.18 Relative LumEff 0.94 1.00 0.95 0.94 0.94 0.83 0.89 Power (V·A) 94.5 95.1 95.2 98.2 99.5 94.8 92.2 Power factor 0.55 0.54 0.54 0.53 0.52 0.54 0.53 THD voltage 3.8 3.8 3.5 3.7 3.7 3.8 THD current 11.2 11.0 10.9 10.2 11.3 11.0 Input voltage 121.5 121.7 121.8 121.7 121.9 121.9 121.7 Current 767.0 781.4 782.0 798.0 816.0 778.0 791.0 Lamp 3
(OC) (Ambient temperature) 45 25 25 R 10 0 -9 -18
Time to ignite (s) 1.5 0.5 2.0 1.5 2.0 2.0 3.0
Time to equil (min) 82.0 49.0 40.0 76.0 89.0 60.0 89.0
Temp lamp A (°C) 45.2 54.2 52.8 39.2 24.4 18.4 1.7
Temp lamp B 45.6 58.4 52.3 38.0 27.0 20.7 13.8
Temp lamp C 46.3 46.2 51.6 40.6 37.0 16.3 8.8
Lamp luminances (cdim2) 28.2 28.4 32.1 32.6 26.0 16.0 10.5
Lamp output (V) 0.40 0.41 0.44 0.47 0.37 0.24 0.15 Power (W) 48.1 53.3 55.4 56.9 55.9 51.9 50.6 LumEff (cd/m2/W) 0.17 0.16 0.17 0.17 0.14 0.09 0.06 Relative LumEff 1.10 1.00 1.09 1.08 0.88 0.58 0.39 Power (V·A) 70.4 99.1 80.5 82.9 81.5 76.2 74.2 Power factor 0.68 0.68 0.69 0.69 0.69 0.68 0.68 THD voltage 4.6 4.4 4.4 4.5 4.5 4.5 THD current 102.2 100.9 100.8 101.2 102.1 102.6 Input voltage 122.4 122.9 122.9 122.6 122.4 122.5 122.5 Current 402.0 633.0 655.0 676.0 666.0 622.0 606.0
during the setup for 0 °C). Nonetheless, light output complete failure at temperatures below 0
oc.
Unlike was noticeably diminished for these two lamps at the most of the other lamps, light output for these lamps coldest temperatures with reduced output apparent was actually lower at 25oc
than at 10 or 45 °C. Light even at 10 °C. output increased at 10 °C for the first minutes, before Lamp 8 also showed marked effects of temperature returning to values similar to those at 45 °C. This with a noticeable decline in light output at 0 °C and lamp contained a constant illumination circuit which78
Thble 2-Continued
(0C) (Ambient temperature)
Time to ignite (sec) Time to equil (min) Temp lamp A (0 C) Temp lamp B Temp lamp C Lamp luminances (cd/m2) Lamp Output (V) Power (W) LumEff (cd/m2/W) Relative LumEff Power (V-A) Power factor THD voltage THD current Input voltage Current 45 3.0 80.0 59.1 62.4 62.5 27.1 0.37 93.46 0.08 0.75 165.6 0.56 8.3 138.8 122.1 798.0 Lamp 7 25 2.5 70.0 52.6 54.8 42.6 36.0 0.49 93.39 0.11 1.00 171.4 0.54 8.8 153.4 122.0 771.0
...
25 R 10 4.0 128.0 35.2 39.1 36.1 28.6 0.42 92.26 0.09 0.80 168.3 0.55 8.7 154.4 122.5 755.0 0 4.0 79.0 31.9 32.4 28.6 14.7 0.22 60.95 0.07 0.63 91.97 0.66 6.3 113.6 122.5 751.0 -9 5.0 142.0 3.9 23.1 Broken 5.2 0.08 58.01 0.03 0.23 90.9 0.64 6.3 115.2 122.5 742.0 -18 411.0 82.0 10.7 -3.1 2.6 0.04 55.41 0.01 0.12 89.82 0.62 6.3 119.5 122.5 733.0 Lamp 8 °C (Ambient temperature) 45 25 25 R 10 0 -9 -18 Time to ignite (s)Time to equil (min) Temp lamp A (0C) Temp lamp B Temp lamp C Lamp luminances (cd/m2) Lamp Output (V) Power (W) LumEff (cd/m2/W) Relative LumEff Power (VA) Power factor THD voltage THD current Input voltage Current (0C) (Ambient temperature) Time to ignite (s) Time to equil (min) Temp lamp A (0C) Temp lamp B Temp lamp C Lamp luminances (cd/m2) Voltage (V) Power (W) LumEff (cd/m21W) Relative LumEff Power (V-A) Power factor THD voltage THD current Input voltage Current 0.5 35.0 52.0 54.1 52.1 16.5 0.23 100.8 0.05 0.96 103.5 0.98 4.0 10.9 122.0 845.0 45 1.5 56.0 63.0 66.4 67.7 30.8 0.42 103.7 0.09 0.93 240.2 0.43 3.2 8.4 119.9 2010.0 2.5 50.0 42.1 43.3 41.8 17.7 0.24 104.5 0.05 1.00 107.3 0.97 4.0 11.6 122.0 869.0 Lamp 9 25 2.5 62.0 58.1 70.4 51.6 33.6 0.46 105.4 0.09 1.00 225.6 0.47 3.3 8.4 120.0 1872.0
lowest two temperatures, with output at -9 °C initial· ly being the same as that at 45 °C, but then im· mediately falling off to about 60 percent of the out· put, and that at - 18 °C steadily declining after the first five min and reaching a final value of about 15 percent of that at the baseline condition. Output at 45
Summer 1994 JOURNAL of the Illuminating Engineering Society 0.5 31.0 39.1 41.9 39.6 19.4 0.27 106.6 0.05 1.07 109.0 0.98 4.0 11.9 122.0 893.0 25 R 3.5 54.0 50.8 50.9 49.2 35.6 0.49 106.9 0.10 1.05 225.9 0.47 3.3 9.2 120.1 1880.0 0.5 79.0 24.6 29.0 25.0 14.7 0.22 104.3 0.04 0.83 106.7 0.98 4.0 13.0 121.9 875.0 10 4.5 65.0 32.3 42.1 35.9 36.7 0.53 106.5 0.10 1.08 217.6 0.49 3.3 8.1 120.1 1812.0 1.5 59.0 16.2 16.2 3.7 0.06 64.9 0.02 0.34 66.6 0.97 121.8 547.0 0 3.5 49.0 24.8 29.6 19.6 26.8 0.39 105.6 0.07 0.80 225.7 0.47 3.2 7.1 119.9 1882.0 44 min -8.5 -8.5 -8.6 0.0 0.01 29.1 0.00 0.00 111.8 0.26 3.8 24.5 121.7 919.0 -9 4.0 89.0 20.6 21.2 14.5 14.1 0.20 102.8 0.04 0.43 237.1 0.43 3.1 6.7 119.9 1972.0 -18 4.0 89.0 2.0 9.2 5.2 7.3 0.10 0.9 0.02 0.23 240.4 0.42 119.7 2008.0
°C was actually slightly below that at 0 °C, although there was greater variability in the time to equilibrium for the latter. Relative light output was reasonably stable after 5 to 15 min of operation for temperatures above -9 °C, however. As with lamp 9, lamp 11 also displayed a peculiar drop in light output at 45 °C at
25 5: 5· 2· 21 0. 61. 0. 0. 92 0. I 11 12: 75 25 0. Wセ@ 0. 1. 74. 0.
...
79
'
"
セ@Thble 2-Continued
I
Lamp 10
!
(OC) (Ambient temperature) 45 25 25 R 10 0 -9 -18
Time to ignite (s) 4.0 4.0 4.0 4.5 3.5 20.0 130.0
f
Time to equil (min) 29.0 30.0 29.0 44.0 59.0 85.0 73.0 セ@
Temp lamp A (0C) 65.9 57.6 52.9 39.0 31.2 15.5 4.1 ',j
t
Temp lamp B 50.5 56.2 53.1 41.6 29.8 23.5 6.9 > Temp lamp C 74.0 53.9 50.3 38.9 33.9 19.4 12.3r
Lamp luminances (cdlm2) li 15.9 17.8 ,18.9 19.5 16.9 10.1 3.57
Lamp Output (V) 0.22 0.25 0.27 0.29 0.25 0.15 0.06' •
Power (W) 60.39 59.17 57.89 55.95 55.68 56.83 54.81r
LumEff (cdlm2/W) 0.08 0.09 0.10 0.10 0.09 0.05 0.02'
k Relative LumEff 0.87 1.00 1.08 1.16 1.00 0.59 0.21e
Power (VA) 113.05 121.10 104.40 97.71 98.76 108.0 ll0.1I
I Power factor 0.55 0.49 0.55 0.57 0.56 0.53 0.5 ,,f THD voltage 3.5 3.7 3.7 3.8 3.7 3.8 3.7 THD current 10.7 10.7 11.3 12.8 12.7 11.0 10.9 Input voltage 121.4 121.6 121.5 121.7 121.5 121.6 121.6 Current 919.0 873.0 859.0 806.0 813.0 889.0 905.0 Lamp 11 (0C) (Ambient temperature) 45 25 25 R 10 0 -9 -18Time to ignite (sec) 4.0 5.5 5.0 3.5 5.0 40.0 360.0 1
Time to equil (min) 59.0 62.0 19.0 61.0 80.0 59.0 103.0
I
Temp lamp A (0C) 57.0 50.7 49.8 36.0 24.8 7.9 -2.6
'!
Temp lamp B 58.3 48.3 49.3 36.3 31.6 17.2 5.2 l Temp lamp C 62.2 47.1 46.0 32.4 31.5 13.9 1.7!
Lamp luminances (cdlm2) 17.6 13.8 18.2 18.4 14.8 9.1 4.6 Voltage (V) 0.25 0.19 0.25 0.26 0.22 0.13 0.08I
LumEff (cdlm2/W) 0.09 0.09 0.12 0.12 0.09 0.06 0.03 I Relative LumEff 1.00 1.00 1.32 1.35 1.07 0.67 0.35 Power (W) 58.3 45.7 45.59 45.23 45.8 44.66 43.2 Power (VA) 107.6 88.4 84.71 81.86 83.8 88.06 87.29 Power factor 0.54 0.52 0.54 0.55 0.55 0.51 0.49 THD voltage 3.8 3.8 3.8 3.8 3.9 THD current 10.3 11.2 10.8 9.7 9.7 Input voltage 122.0 122.0 121.7 122.0 121.7 121.8 121.8 Current 882.0 724.6 696.0 671.0 682.0 722.0 717.0Lamp 12 (lamp voltage boosted to 13 V to get start)
I
(0C) (Ambient temperature) 45 25 25 R 10 0 -9 -18
f
Time to ignite (s) 5.0 5.0 5.0 5.0 failed I
Lamp luminances (cdlm2) 10.6 6.5 3.5 i ! I ! Lamp 13 セ@ 1 (0C) (Ambient temperature) 45 25 25 R 10 0 -9 -18 I 0.5 0.5 0.5 Q Time to ignite (s) 0.5 0.5 0.5 0.5
I
Time to equil (min) 15.0 20.0 19.0 16.0 15.0 15.0 15.0 I !
Temp lamp A (0C) 66.4 56.9 52.7 38.2 27.6 17.8 10.7 \
f
Temp lamp B 66.7 55.0 57.8 41.2 34.6 23.5 14.1I
Temp lamp C 67.7 58.1 53.4 38.0 33.0 17.4 14.7 Lamp luminances (cd/m2) 12.7 13.6 13.6 12.6 12.6 13.7 13.5I
Lamp Output (V) 0.18 0.19 0.19 0.19 0.19 0.20 0.20'
LumEff (cdlm21W) 0.02 0,02 0.02 0.02 0.02 0.02 0.02 ( Relative LumEff 0.94 1.00 1.01 0.93 0.93 1.02 1.00 Power (W) 164.7 166.3 164.8 164.9 165.0 164.6 165.1 Power (VA) 165.1 166.4 164.9 165.0 163.1 164.7 165.0 Power factor 1.0 1.0 1.0 1.0 1.0 1.0 1.0 THD voltage 3.9 3.9 3.9 3.9 3.9 3.9 THD current 3.9 3.9 4.0 3.9 4.0 4.0 Input voltage 121.6 122.9 121.9 121.9 121.8 121.8 122.0 Current 1353.0 1374.0 1353.0 1354.0 1354.0 1353.0 1354.080
the end of the test period. Before that, light output values for the four warmest temperatures were com· parable, with only the data for 0 °C declining slightly over time. Inspection of the data suggests that the light ·output peaked early and then declined over time, but never really reached equilibrium at - 9 and - 18 °C. As to be expected there was relatively little effect of temperature on time to equilibrium or light output for the incandescent lamp, lamp 13. Comparable data were not available for the low voltage lamp, lamp 12, which had numerous electrical problems during the data collection and failed to ignite at temperatures below 0 °C.
Examination of the data for the twelve sets of com· pact fluorescent lamps demonstrates that most were markedly affected by temperature extremes, display· ing noticeable reductions in light output at the colder temperatures with frequent reductions to 10-20 per· cent or less of their output at the baseline 25 °C temperature. In addition, lamps 1, 3, 5 (and 6), 7, 8, 9, 10 and 11 showed great variability in time to equi· librium. Light output and time to equilibrium were reduced for lamp 1 at 10 °C, while lamps 5, 9, and 10 displayed reduced output at 45 °C. Addition of extra humidity, by using a fine mist at -4 °C caused lamps 4, 5, and 8 to fail to ignite. Of course, lamp 8 failed outright at -9 °C. Only lamps 2 and 4, which had ex· ternal globes, were relatively unaffected by the colder temperature extremes. Light output for these two lamps was reduced at the two warmer temperatures (25 and 45 °C), however. Lamp 4 contained an integral electronic ballast, as did lamp 3 which demonstrated much greater temperature sensitivity than lamp 4. These data suggest that presence of an enclosure, or globe, improved performance at colder temperatures as indicated by the results for lamps 2 and 4. Even the poor performance of lamp 5 at low temperatures was improved by the addition of an enclosure, as can be seen from the data for lamp 6. In contrast, the presence of a globe appeared to reduce light output at the warmest temperatures. Nonetheless, tempera· ture extremes, both low and high, reduced overall light output and increased the time to luminous equilibrium for almost all the compact fluorescent lamps studied.
Because of the difficulty of comparing perform· ance for different lamps from Table 2, some of the key data are summarized graphically. In the following figures the upper plot refers to lamps 1 through 6, while the lower plot presents data for lamps 7 through 13. Figure 1 which presents time to ignition as a func· tion of ambient temperature for temperatures greater than - 18 °C makes it very clear that time to ignition was greatly affected by temperatures below 0 °C, par· ticularly lamps 5, 6, 7, 10 and 11 (as well as 8 which
...
Compa<ison of Lamps 1 - 6
Time for Lamp Ignition for Terrperatures Greater than -18C
"' " D c 0 , u Jl
::
c セ@ 15 セ@ c <>•o
0_,L
0セLセ
P@
GセG@ セ@
" D c 0 u Jl c 0 セ@ Terrperature -e-Lamp 1 -+-Lamp2 -tr-Lamp3 ---*- Lamp "' -+-Lamp 5 -J.-Lamp 6Compa< ison of Lamps 7 to 13
T1me to Ignition for Temperatures Greater Than -18C
:"
セ@
:
"セ@ P⦅LNLlMセZZ]Aッセ]ZAZ]セLセッ@
S]Lセ
P@
セセセセj@
Temperature in Degrees Ce Is ius
--a- Lamp 7 ----e- Lamp 8 セl。ュー@ 9 """'*"""Lamp 10 -+--Lamp 11 --J.-Lamp 13
Figure !-Ignition time for all lamps at ambient temperatures abov -18 °C
failed completely at these temperatures.) For thes' lamps, ignition time increased from less than 5 s to 4( or more s. At - 18 °C, the time to ignition increase< to 400 to 500 s for lamps 5, 6, 7, 10, and 11. At the sam time, ignition time for the incandescent lamp, 13, n
mained at less than 0.5 s, regardless of changes in am bient temperature.
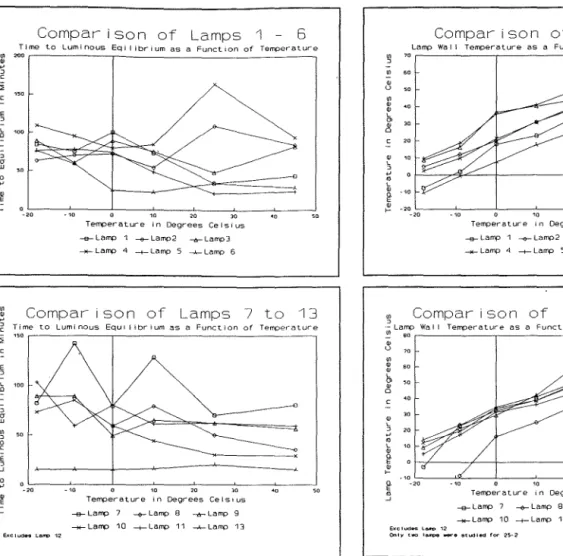
Figure 2 summarizes the data presented above o: time to equilibrium as a function of ambien temperature. While there may be a trend toward ir creasing time with decreasing temperature, these tw plots demonstrate a great deal of variability in th general trends. Table 2, which indicates the time t, equilibrium for lamps 2, 4, 8, and 10 between the fin test at 25 °C and the second, suggests that they rna not have been fully burned in at the beginning of th experiment. Figure 3 plots the lamp outer wall (tir: temperature (for the warmest of the three lamps) as function of ambient temperature. These two graph make it very clear that lamp tip temperature decline' markedly as ambient temperature decreased whic probably explains the drop in performance that o<
...
Comparison of Lamps
1 - 6Time to Luminous Eqll ibrium as a Funct1on of Temperature
セ@ セ@ ... 0 c :> :c E 0 ·-L :9 ; rr UJ 3
•
E >- 0 ·20 0 10 20 30Temperature in Degrees Celsius
-e-Lamp 1 セ@ Lamp2 --.!r-Lamp3 セl。ュー@ "l -+-Lamp 5 MMNセNMMl。ュー@ 6
セ@
Comparison of Lamps 7 to
13セ@ Time to Luminous Equ11 ibrlum as a Function of Temperature
:i E 0 E 0 _J 0 ... ,: 0 -20 Exc I ude9 lセ@ 12 0 20 30
Temperature in Degrees Cels1us
--e-Larrp 7 セl。ュー@ 8 --.!r-Lamp 9
---?f-Larrp 10 -+-Lamp 11 MMNセNMMl。ュー@ 13
Figure 2-Time to luminous equilibrium at different ambient temperatures.
curred with lower temperatures. By 10 °C lamp tip temperature for lamps 1, 6, and 7 was below 30 °C which is below the temperature for which optimum performance is expected for fluorescent lamps (IESNA, 1984). By -9 °C, all lamps had lamp tip temperatures below this temperature. Lamp tip temperature was something of a misnomer for lamps 2, 4, and 6 which were comprised of a globe around the lamp itself. Comparison of the temperatures for lamps 5 and 6 in Figure 15 demonstrate the likely thermal effects of the globe with lamp 5 having the warmest and lamp 6 having the coolest temperatures. Lamp apparent power in volt amps as a function of temperature tended to remain relatively stable over temperature for most lamps. Some lamps, such as 2, 4, 10, 11, and 13, displayed almost no variation in volt amps across temperatures. The ones with the greatest variation were 1, 3, 5, 6, 7 and 8. The latter two varied of course, because of the loss of one or more lamps at cold temperatures. Input current for the different am-bient temperatures tended to decrease for lamps 1 and 4, but remain relatively constant for the other
Comparison of Lamps 1-6
Lamp Wa 1 1 Temperature as a Funct 1 on of Room Temperature
セ@ U >O セ@ セ@ セ@ L
l
30 c 20 セ@ 10 0 ... セ@ L セ@ セ@ セ@ - 2 o - 2 L o - - - ' : : - - - " - - - " ' , o - - - : ' : - - - - : ' : - - - - : ' : - - - : ' Temperature 1 n Degrees Ce Is 1 us--e- Lamp 1 ---e-Lamp2 --6-Lamp3 ---.Lamp -4 -+-Lamp 5 --Jo...-Lamp 6
セ@
Compar i son of Lamps
7to
13·-Lamp Wall Temperature as a Funct1on of Ambient Temperature
セ@ ッLMMMセMMLMMMMMMMMMMMMMML@ セ@ u
•
L セ@ 20 セ@ L '0 セ@ セ@ セ@ >-セ@ セ@ Exc iセ@ l--.:> 12 0 10 20 30Temperature 1n Degrees Cels1us
--e--Larrp 7 セl。ュー@ 8 ---tr-Lamp 9
"'*-Larrp 10 -1--Lamp 11 NNNNLNセNMl。ュー@ 13
Only two la,oros _.., studied for 25-2
81
Figure 3-Lamp outer wall temperature at different ambient temperatures.
lamps (except 5, 6, and 8 which experienced ignition problems at temperatures below - 9 °C). The power factor generally was around 0.55 with some variations due to temperature (primarily for lamp 1). Power fac-tor did not vary much for different temperatures (ex-cept lamp 8 which was close to failure at -9 °C), and was generally about 0.55 for all lamps except 3, 8, and of course 13 which was at 1 as expected. Only lamp 8 of the compact fluorescents had a power factor near 1, which dropped dramatically for -9 °C to about 0.25. (This lamp contained a high power factor correc-tion circuit as well as a constant illuminacorrec-tion circuit.) The data for harmonic distortion, for both current and voltage, demonstrate little variation in these parameters as a function of temperature for the per-formance of the different lamps. Lamps 3 and 4 had higher total harmonic distortions for both current and voltage regardless of temperature.
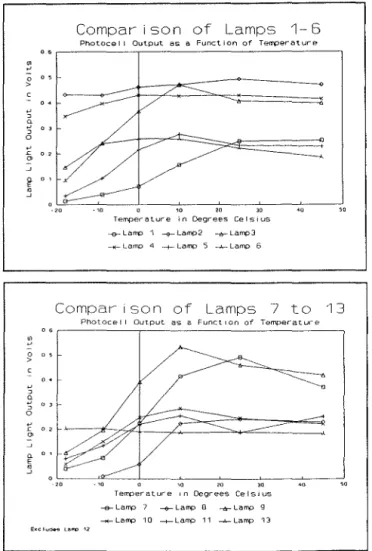
Figure 4 presents data on lamp light output as measured by the photocell for the different ambient temperatures. Although they are not plotted, the measured luminance data are virtually identical with
82
the photocell output (even though the measurements were obtained with different procedures and in-struments). Figure 4 shows a generally declining out· put with decreasing temperature.
Lamps 1, 3, 6, 7, and 9 demonstrated a sharp decrease in luminance and photocell output with temperature, with lamps 1 and 7 showing a decrease by 10 °C. The decline in output was much less pronounced for lamps 2, 4 and, of course, 13. The repeated measures at 25 °C demonstrated relatively little change from the initial measures. Lamp apparent power in volt amps as a func· tion of temperature tended to remain relatively stable over temperature for most lamps. Some lamps such as 2, 4, 10, 11, and 13 displayed almost no variation in volt amps across temperatures. The ones with the greatest variation were 1, 3, 5, 6, 7 and 8. The latter two varied, of course, because of the loss of one or more lamps at cold temperatures. Input current for the different am· bient temperatures tended to decrease for lamps 1 and 4, but remain relatively constant for the other lamps (except 5, 6, and 8 which experienced ignition problems at temperatures below - 9 °C). The power factor generally
!': 0 > セ@ (}_ ,., 0 0 ,., £
"
_, g-3 0 > ,., 0 セ@ 0 ,., £"
_, (}_ E セ@ _,Comparison of Lamps 1-6
Photoce 1 l Output as a Funct ron of Temperature
0
-20 0 10 20 30
Temperature in Degrees Cels1us
--a-Lamp 1 --.r-Lamp2 -n--Lamp3
セ@ Lamp 4 --+---Lamp 5 ...J... Lamp 6
Comparison of Lamps 7 to 13
Photocell Output as a Funct 10n of Temperatur-e
0 2
0 10 <'0 30
Temperature 1n Degrees Celstus
--e-Lamp 7 --I?-Lamp 8 -b-Lamp 9
""*""Lamp 10 -+-Lamp 11 MNセNMl。ュー@ 13 E><clu,... Le.I'I'Q 12
Figure 4-Measured light output at different ambient temperatures.
...
was around 0.55 with some variations due to temperature (primarily for lamp 1). Power factor did not vary much for different temperatures (except lamp 8 which was close to failure at -9 °C), and was generally about 0.55 for all lamps except 3, 8, and of course 13 which was at 1 as expected. Only lamp 8 of the compact fluorescents had a power factor near 1, which dropped dramatical· ly for -9 °C to about 0.25. (This lamp contained a high power factor correction circuit as well as a con· stant illumination circuit.) The data for harmonic distortion, for both current and voltage, demonstrate little variation in these parameters as a function of temperature for the performance of the different lamps. Lamps 3 and 4 had higher total harmonic distortion for both current and voltage regardless of temperature.
While the primary means for monitoring the light output of the lamps was a silicon photocell located within the environmental chamber, a supplemental pro-cedure for measuring light output was developed to ac· count for any thermal instabilities of the photocell. In this procedure, the luminance of a white tile located below the lamps was measured to evaluate whether the photocell response changed with ambient temperature. For these measures, a luminance meter which was kept outside the environmental chamber, was brought into the chamber very briefly to measure the luminance of the white tile. Because the luminance of the tile is pro-portional to lamp light output, and independent of am· bient temperature, it could verify the thermal stability of the photocell and provide further data on the light output of the lamps for a standard condition, although it did not, of course, provide absolute luminance data. Comparison of the photocell and luminance meter measures indicated insignificant temperature dependence for the photocell under the range of testing conditions, with differences for individual lamps ranging from 0.009 to 0.18. The average difference bet· ween meter readings for all lamps for all temperatures was 0.014 with a standard deviation ofO.OOl. There was good agreement between the two types of measures with the best agreement occurring at 10 and 25 °C. This analysis thus indicates that the photocell remained suf-ficiently stable over temperature that comparisons bet· ween the performance of different lamps at different temperatures can be made.
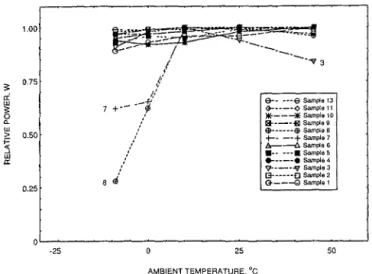
Figures 5 and 6 plot the data for the lamps normaliz-ed to their individual maximums for ready comparison of lamp performance on a single plot. Lamps may also be compared relative to performance at a reference temperature such as 25 °C.3 Figure 5 plots input
power in watts as a function of temperature for the dif. ferent lamps. As can be seen, input wattage generally remained relatively constant with marked decreases on· ly for lamp 3 at 45 °C, and for lamps 7 and 8 at - 9
...
and - 18 °C (because one or more lamps failed at the low temperatures). Inspection of the data in Table 2 in· dicates that the incandescent lamp, 13, required the greatest power although lamps 7, 8 and 9 (being 24 W or more) required more power than the other lamps.
While total lamp lumen output was not measured directly, the photocell data provide a measure of relative luminous output. Consequently, a form oflamp efficacy could be calculated for each set of lamps at different thermal conditions. This comparison was termed relative luminous efficacy and is only an approxima· tion because the lamps differed in size and distance from the photocell. As a result the photocell could not measure the total luminous distribution.
Figure 6 presents a comparison of relative luminous efficacy normalized to the same lamp's maximum per· formance at any temperature. Examination of Figure 6 makes it very clear that the relative luminous efficacy for the incandescent lamp, 13, remained relatively con· stant as temperature varied. All the compact fluores· cent lamps, however, showed reduced output at the col· der temperatures, with markedly reduced output at -18 °C. Only lamps 2 and 4 appeared to be somewhat unaffected by temperature with relative luminous ef· ficacies greater than 0.8 throughout the experiment. Lamps 1 and 8, on the other hand showed markedly reduced efficacy even at 10 °C with a pronounced decline for lower temperatures. Comparison of lamps 5 and 6 reveals that when the globe was used, relative luminous efficacy increased, but when it was not used efficacy dropped dramatically at 0° and -9 °C. This is likely due to heating of the lamp when enclosed by the globe. Efficacy declined markedly for both con· figurations at - 18 °C, however. Inspection of the lower plot reveals that lamps 9, 10, and 11 actually increased their efficacy at 10 °C, while 7 and 8 began to decline. (Relative efficacy for these two lamps was, of course, markedly affected by the failure of one or more lamps below 10 °C.) Despite the decreases in relative luminous efficacy, for most of the temperature tests, relative luminous efficacy remained greater for the compact fluorescent lamps compared with that of the incandes· cent. For temperatures above - 9 °C, relative luminous efficacy was much greater for the compact fluorescents, despite their declining output at colder temperatures. By 0 °C, only two lamps, 1 and 8, had efficacies below that of the incandescent lamp. By -18 °C, the efficacy for lamps 1, 5, 8 (which had totally failed), 7 (which was lacking one lamp but which had been well above lamp 13 even for 0 °C), 9 and 10 had fallen below that of lamp 13. At least two lamps, 2 and 4, maintained reasonably high relative luminous efficacies throughout all the test temperatures. Even at -18 °C their relative efficacy was six to eight times that of the incandescent lamp.
83
Finally, a comparison of performance for the dif-ferent lamps at 25 °C taken at the beginning and end of the testing sessions for the data on time to equilibrium, light output, and relative lamp efficacy suggests that the lamps were not harmed by the ther· mal extremes (as we had hypothesized that they might be.) Rather the data suggest that the 100 hrs of burn time prior to the thermal testing may not have been quite long enough to age and stabilize the lamps completely-or that the procedures for data collection may have increased in stability during the course of the experiment.
Conclusions and recommendations
The most important conclusion to be reached from these data is that temperature variations from the nor· mal temperature of 25 °C greatly reduced lamp light
1.00 ;l: 0.75 0: w ;l: 0 a. w > 0.50 i= :'i w
"'
0.25 -25 セセMBAZU@ ::.'1 ..:1
-- i=-I
セMNNNセMNNNセMNNN@ I ·-. . .., 3 I / j'LNLセW@
s e' 25 AMBIENT TEMPERATURE. 'Ca-----e Sample 13
セMMMM\^@ Sample 11 *---*Sample 10 9---B Sample 9 e---e Sample a +-- --+ Sample 7 ORMセs。ューャ・V@ •-- ---• Sample 5 • - - - - • Sample 4 v---v Sample 3 (3---0Sampia2 Q.---G Sample 1 50
Figure 5-Effect of temperature on power consumed by compact fluorescent systems. >-セ@ Li: u. 0 75 w 0.50 w > セ@ w
"'
-25 25 AMBIENT TEMPERATURE. °C ・MMMMMYセQS@ \イMMMMos。セ@ II ZNMMMBJsゥセ|P@ QSMMMMMbs。セゥャ@ ・MMMMMMDs。セX@ +----+Sampl$1 OQイMMセs。セV@ ·-- ---·Sample5 ᄋMMMMᄋs。セセ@ カMMMMBGvs。セS@ gMMMMMMᆪjs。セR@ G---0 SafT\Pl<ll 50Figure 6-Effect of temperature on relative efficacy of compact fluores· cent systems.
JOURNAL of the Illuminating Engineering Society Summer 1994
r
hセ@
i
f
84
output and increased the time to luminous equilibrium. Lamps that were markedly affected by temperature displayed noticeable reductions in light output-sometimes being reduced to 10-20 percent or less of their output at the baseline 25 °C temperature. Outright failure occurred in other cases. In addition, their time to equilibrium demonstrated much greater variability. This finding is in accordance with results generally found for conventional fluorescent lamp per· formance.8 The only design factor that appeared to moderate this finding was the presence of an outer globe surrounding the fluorescent tube. Lamps using this configuration did not suffer the declines in light output at low temperatures experienced by the other compact fluorescents. Their light output declined for higher temperatures, however.
Despite reductions in performance due to temperature extremes, the other major conclusion is that the compact fluorescent lamps remained noticeably more efficient than the comparison in· candescent lamp until very low temperatures (usually below freezing, 0 °C) were reached. These lamps con· sistently produced more light output for less power in· put, as compared with the reference incandescent lamp. This effect varied for lamp type-those with an
enclos-ing globe tended to demonstrate less performance decrement at the lower temperatures. The low voltage system was not particularly successful, however, perhaps because of the novelty of the design which resulted in inadequate isolation of the electrical components in the test situation. As others have reported, power fac· tor for the compact fluorescents was typically low, around 0.55, for the compact fluorescent designs studied, while harmonic distortion was noticeably higher for three of the lamps studied. Flicker index was in line with reported data for other types of fluores-cent lamps.5
The data suggest that the selection of a particular compact fluorescent system should be based on its likely application. If the space is likely to be cold, then a lamp with an integral enclosure (or globe) should be selected for maximum light output. If it is likely to be hot (above 25 °C) then such an enclosure is likely to overheat the lamp, resulting in lower light output. Still another fac· tor for design consideration is the marked variation in size of the different lamps and ballasts. In addition, for some of the lamps the ballast was an integral compo· nent of the fixtures, whereas for others, such as lamps 7, 8, and 9, the ballast was separate and required wir-ing before use. Finally, the compact fluorescents studied here tended to decrease in light output over the time of operation at extreme temperatures, particularly when stressed by temperature, another factor which may be of concern in some applications.
...
References
l. Arseneau, R. and Ouellette, MJ. 1992. Effects of harmonics on the performance of compact fluorescent lamps. Proceedings of the International Conference on Har· monies in Power Systems. Atlanta GA, Sept 23-25.
2. Bouwknegt, A. 1982. Compact fluorescent lamps.
1
of the IES 11:(204-212).3. Collins, B.L., Treado, SJ. and Ouellette, MJ. 1992. Evaluation of compact fluorescent lamp performance at dif ferent ambient temperatures. Gaithersburg, MD: National Institute of Standards and Technology. NISTIR 4935. 4. Finn, D., and Ouellette, MJ. 1992. Compact fluores-cent lamps: What you should know. Progressive Architec-ture: 89-92.
5. Illuminating Engineering Society of North America. 1984. IES Lighting Handbook; Reference Volume. New York: IESNA, Chapter 8.
6. Ouellette, MJ. and Arseneau, R. Effects of under-voltage on the performance of compact fluorescent systems. Proceedings of Annual Conference of IEEE Industry Applications Society.
7. Ouellette, MJ. 1992. Photometric errors with com-pact fluorescent sources. Proceeding of Annual Conference of IEEE Industry Application Society.
8. Siminovitch, MJ.; Rubenstein, F.M.; and Verderber, R.R. 1984. Determining lamp ballast system perfor-mance with a temperature-controlled integrating chamber.
1
of the IES. 14:364-3 78.9. Treado, SJ. and Bean,
J.W.
1990. Measurement and evaluation of lighting and HVAC interactions. Gaithers-burg, MD: National Institute of Science and Tech-nology, NISTIR 4429.10. Treado, SJ. and Bean,
JW.
1991. The interaction of lighting, heating and cooling systems in buildings. Gaithersburg, MD: National Institute of Standards and Technology, NISTIR 4701.Acknowledgements
This report is an appendix to the CEA Report 9038 U 828 entitled "The Evaluation of Compact Fluorescent Lamps for Energy Conservation:' Inquiries to the CEA may be addressed to Suite 1600, One Westmount Square, Montreal, PQ Canada. The authors would like to acknowledge the support of the Canadian Electrical Association and Energy, Mines and Resources Canada, as well as the National Research Council Canada and the US National Institute of Standards and Technology. We would also like to thank Phil Sanders for the initial instrumentation of the lamp testing apparatus at NIST. This project could not have been completed without his efforts. We would also like to thank Pete Rothfleish and Dave Ward who were responsible for the operation of the environmental chamber in which the lamps were tested.
...
Discussion
The light output of a fluorescent lamp is greatly af-fected by the mercury pressure. The mercury pressure can be controlled by a cold spot on the lamp. Another possibility of mercury pressure control is by an amalgam in the lamp. The major benefit of an amalgam is the large temperature range over which the mercury pressure, and consequently the light output ofthe lamp, is kept almost constant. Lamps 2 and 4 in your test have a light output that is almost independent of the am· bient temperature. Is it possible that this temperature independence is largely caused by the use of an amalgam and to a lesser extent to the pressure of an outer globe?
P.M. den Breeijen
Philips Lighting Company The authors conclude that lamps which have a cover surrounding the discharge tube do not exhibit reduc· ed light output at low ambient temperatures. Can the authors conclusively state that the cover produces this effect, or could it be due to an amalgam in the lamp which controls the mercury vapor pressure over a wide ambient temperature range?
Authors' response
A. Serres and]. Schlejen Philips Lighting Company
To P.M. den Breeijen, A. Serres, and]. Schlejen
The discussors raise the issue of the possible presence of an amalgam in lamps 2 and 4. Subsequent checking revealed that these two lamps did, in fact, have an amalgam. As the discussors point out, this may have been responsible for some of the temperature effects. Comparison of the performance of lamp 5 with lamp 6 (which consisted merely of adding a globe to lamp 5) also substantiates the idea that the globe played an important role in shielding the lamp from the cold temperature. It is likely that the two factors contribute to lamp performance under cold temperatures. Further research should be conducted to separate the effects of amalgam from thermal shielding on the per-formance of compact fluorescent lamps.