HAL Id: hal-00195266
https://hal.archives-ouvertes.fr/hal-00195266
Submitted on 10 Dec 2007HAL is a multi-disciplinary open access archive for the deposit and dissemination of sci-entific research documents, whether they are pub-lished or not. The documents may come from teaching and research institutions in France or abroad, or from public or private research centers.
L’archive ouverte pluridisciplinaire HAL, est destinée au dépôt et à la diffusion de documents scientifiques de niveau recherche, publiés ou non, émanant des établissements d’enseignement et de recherche français ou étrangers, des laboratoires publics ou privés.
SUBCELLULAR IMAGING OF DYNAMIC PROTEIN
INTERACTIONS BY BIOLUMINESCENCE
RESONANCE ENERGY TRANSFER.
Vincent Coulon, Martin Audet, Vincent Homburger, Joël Bockaert, Laurent
Fagni, Michel Bouvier, Julie Perroy
To cite this version:
Vincent Coulon, Martin Audet, Vincent Homburger, Joël Bockaert, Laurent Fagni, et al.. SUBCEL-LULAR IMAGING OF DYNAMIC PROTEIN INTERACTIONS BY BIOLUMINESCENCE RES-ONANCE ENERGY TRANSFER.. Biophysical Journal, Biophysical Society, 2007, epub ahead of print. �10.1529/biophysj.107.117275�. �hal-00195266�
This un-edited manuscript has been accepted for publication in Biophysical Journal and is freely available on BioFast at http://www.biophysj.org. The final copyedited version of the paper may be found at http://www.biophysj.org.
SUBCELLULAR IMAGING OF DYNAMIC PROTEIN INTERACTIONS BY BIOLUMINESCENCE RESONANCE ENERGY TRANSFER
Vincent Coulon 1,2 , Martin Audet 3 , Vincent Homburger 1 , Joël Bockaert 1 , Laurent Fagni 1 , Michel Bouvier 3
and Julie Perroy 1*
From the Institut de Génomique fonctionnelle 1
, CNRS UMR5203; INSERM U661; University of Montpellier, Montpellier, France
Laboratoire de Dermatologie Moléculaire-EA3754 2
, UFR Médecine Site NORD UPM/IURC, Montpellier, France
Department of Biochemistry, and Groupe de Recherche Universitaire sur le Médicament 3
, Institute of Research in Immunology and Cancer, Université de Montréal, Montréal, Qc. Canada
*Address correspondence to: Julie Perroy, IGF, 141 rue de la Cardonille 34094 Montpellier Cedex05. Tel: +33 467142960; Fax: +33 467542432; E-mail: julie.perroy@igf.cnrs.fr
Keywords : BRET imaging – dynamic spatio-temporal protein-protein interactions – living cells –
setting up experimental conditions -
Abstract
Despite the fact that numerous studies suggest the existence of receptor multiprotein complexes, visualization and monitoring of the dynamics of such protein assemblies remains a challenge. In the present study we established appropriate conditions to study spatio-temporally-resolved images of such protein assemblies using bioluminescence resonance energy transfer (BRET) in mammalian living cells. Using covalently linked
renilla-luciferase and yellow fluorescent proteins, we depicted the time course of dynamic
changes in the interaction between the V2-vasopressin receptor and β-arrestin induced by a receptor agonist. The protein-protein interactions were resolved at the level of sub-cellular compartments (nucleus, plasma membrane or endocytic vesicules) and in real time within tens of seconds to tens of minutes time frame. These studies provide a proof of principle, as well as experimental parameters and controls required for high resolution dynamic studies using BRET imaging, in single cells.
Introduction
Protein functions rely on their ability to engage into specific protein–protein interactions and to form complexes that are dynamically regulated by stimuli. Several approaches have therefore been developed to study the occurrence and dynamic of protein–protein interactions in living subjects (1). Among them, resonance energy transfer (RET) technologies are becoming increasingly popular. This is in part due to the development of numerous fluorescent and luminescent organic molecules or proteins amenable to RET and readily usable in biological
systems (2). More importantly, Fluorescence (FRET) or Bioluminescence resonance energy transfer (BRET) allow to study real time interactions among proteins expressed in their correct location, in living systems (3-5). FRET and BRET are proximity based assays that rely on the non-radiative transfer of energy between donor and acceptor molecules according to the Förster mechanism. The efficacy of the energy transfer depends primarily on: (1) the overlap between the emission and excitation spectra of the donor and acceptor molecules, respectively; and (2) the close proximity and orientation of the donor and acceptor entities (6, 7). It varies inversely with the 6th power of the distance and cannot occur for distances exceeding 100A for most RET partners currently used. This absolute distance-dependence between donor and acceptor allows to monitor protein–protein interactions by attaching RET-compatible donor and acceptor molecules to the proteins studied. In FRET, donor and acceptor are both fluorescent molecules and thus initiation of the energy transfer requires the excitation of the donor fluorophore by an external light. For BRET, the energy donor is a bioluminescent molecule that emits energy upon addition of an organic substrate. One significant advantage of BRET over FRET resides precisely in that difference that no external light excitation is required to initiate BRET. Consequently, BRET circumvents cell autofluorescence, direct excitation of the acceptor fluorophore by external excitation light, or donor fluorophore photobleaching. This results in a higher signal to background ratio and facilitates analysis of the signals generated making BRET a technology of choice for measurements using microplate readers (8).
Despite the excellent signal/ background ratio provided by BRET, the low level of light emission intrinsic to the bioluminescent luciferase reaction and the lack of sensitivity of the cameras classically used for microscopy studies have hampered the use of BRET for the localization of protein complexes at the sub-cellular level (9). Until recently, FRET was the only RET approach allowing to dynamically study the subcellular distribution of protein complexes. Unfortunately, the limitations of FRET also apply to microscopy studies. In particular, the acceptor fluorophore is directly excited and there is bleed-through of the donor fluorescence into the acceptor detection channel, making it difficult to precisely quantify the FRET efficiency especially when the local stoichiometry of the donor and acceptor are not known and their relative contribution to background signals difficult to assess (10-12). In addition, the use of an external light source may complicate certain type of experiments as a result of photo-toxicity or the undesirable activation of photo-sensitive biological processes (13). Because BRET instead of FRET circumvent many of these difficulties, the development of BRET-based microscopy offers complementary approaches that increase our ability to study the spatio-temporal dynamics of protein interactions in living cells. Today, the enhanced sensitivity of microscopy, electron multiplying cooled charge-coupled device (EMCCD) cameras and improved bioluminescence probe facilitate luminescence imaging at the single-cell level (14). Because it does not require illumination, bioluminescence imaging circumvents phototoxicity and therefore improves imaging in living subjects (15). Thanks to these recent advances in physics BRET experiments were recently performed at the cellular level in plant seedlings. In these experiments, the weak light derived from bioluminescence did not photobleach the sample or cause autofluorescence, a particularly acute issue in plant cells because of the presence of chlorophyl (16). Finally, using an improved BRET strategy, De etal. imaged protein interactions in a single line cell and cells located deep within small living subjects (17). The present work went further in the BRET imaging development by establishing the appropriate experimental conditions to visualize and quantify dynamics of protein-protein interactions at the sub-cellular level, in single mammalian cells.
Material and Methods
Plasmids – The pDsRed-N1 plasmid was obtained from Clontech. We used the plasmid phRluc from BioSignal Packard to construct the plasmids coding for the different fusions. The fusion plasmids phRluc-EYFP and phRluc-EGFP2 were generated as previously described (18). In these
constructs, the Rluc is fused to the fluorescent protein variant with a 26 amino acid linker (GDLASSREFSRVCRISGARSVLKLGA). The phRluc-EYFP-NLS plasmid was obtained by introducing a sequence coding for a Nuclear Localization Signal PKKKRKV (19) within phRluc-EYFP between the ApaI and BamHI restriction sites, in frame with the C-terminus coding sequence of Rluc-EYFP. The construction of pcDNA3.1-Rluc-β-arr2 and pRK5-V2RYFP were previously described (20). The R393E and R395E mutations were inserted using PCR site-directed mutagenesis to obtain the Rluc-β-arr2(R393E, R395E) construct.
HEK293 cell culture and transfection - HEK293 cells culture and transfection were previously described (21). For experiments using the fusion constructs, distinct pools of cells were transfected with phRluc-EYFP alone, or phRluc-EGFP2 and pDsRed-N1 (transfection reporter).
Twenty-four hours after transfection, the two populations of transfected cells were pooled and cultured for an additional 24 h in glass bottom culture dishes (P35GC-0-14-C, MatTek Corporation).
BRET measurements in cell population using a spectrophotometric plate reader - Cell population BRET measurements were previously described (20).
BRET imaging – BRET imaging studies were performed using a dedicated inverted fluorescence microscope Axiovert200M (Zeiss) in which all luminescent diodes were taken off and the light source was deviated with an optical fiber of 1.5 m long to limit light interferences. The microscope was installed into a black box, impermeable to environmental light pollution. All images were obtained with a Plan-Apochromat 63X/1.40 Oil M27 objective at room temperature. First, transfected cells were identified using a monochromatic light and appropriated filters to excite YFP or GFP (exciter HQ480/40 #44001– emitter HQ525/50 #42017, Chroma) and DsRed (exciter HQ540/40 #59313 – emitter HQ600/50 #65886, Chroma). Light source was then switched off until the end of the experiment. Coelenterazine H (CoelH, 20 µM) was applied 10 min before acquisition, except when indicated otherwise. Images were collected using a cascade 512B camera from Photometrics (equipped with an EMCCD detector, back-illuminated, On-chip Multiplication Gain), mounted on the base port of the microscope. Sequential acquisitions of 30 sec (except when specified otherwise in the text) were performed at 5 MHZ – Gain 3950, bining 1, with emission filters D480/60nm (#61274, Chroma) and HQ535/50nm (#63944, Chroma) to select em480 and em535 wavelengths respectively. The acquisition software was Metamorph (Molecular Devices). To determine the average intensity of em480 and em535 (or later 535 nm / 480 nm ratio), we calculated the mean intensity for each images of pixels within a square region drawn on the cell of interest using Image J software (NIH). The signal to background ratio corresponds to the previous average intensity signal over the mean background signal recorded in an adjacent equal surface without cells. The background value (from a cell-free region) was subtracted from the em480 and em535 raw images. A subsequent median filter was applied to obtain the em480 and em535 illustration images of the figures. It is important to note that this treatment reduced the noise in the active image by replacing each pixel with the median of the
neighboring pixel values. Therefore, the median filter masked the isolated pixels with ratio values in areas with near-background luminescence that tend to be highly variable or even undefined (division by zero). The pixel-by-pixel 535 nm /480 nm ratio were calculated by dividing the absolute blue or yellow intensities per pixel of images obtained at 535 nm over 480 nm. These numerical ratios (comprised between 0 and 1.5) were translated and visualized with a continuous 256 pseudo-color look-up table (LUT) as displayed in the figures. Table 1 defines all the variables used to perform BRET imaging. To follow Rluc-β-arr recruitment to the stimulated V2R-YFP receptor (fig. 5m-n), CoelH 20 µM was applied 10 minutes before the first image acquisition whereas AVP 1 µM was added immediately after the first acquisition. We performed ten sequential acquisitions of 30 sec in each channel every 2 minutes for 20 minutes of agonist stimulation.
Statistical analysis - The distribution of median 535 nm / 480 nm ratios for each cell was analyzed using Kaleidagraph software. Statistical analyses on 535 nm / 480 nm ratios distribution (medians and quartiles) were performed with the non-parametric Kruskal & Wallis test for more than two independent samples with a risk threshold of 5%.
Results
Validation of the BRET technology to image protein-protein interactions.
In BRET, the catalytic oxidation of Coelenterazine H (CoelH) by the bioluminescent enzyme, Renilla luciferase (Rluc) results in the emission of light with a peak at 480 nm. When an appropriate energy acceptor such as the yellow fluorescent protein (YFP) is present within resonance energy transfer permissive distances of Rluc, part of the energy can be transferred non-radiatively leading to the excitation of the YFP and emission of light at its characteristic wavelength with a peak at 530 nm (22). In a first attempt to detect BRET signals by microscopy, we took advantage of an artificial protein directly linking Rluc to YFP through an amino acid linker of 26 amino acids. This chimeric protein generates large BRET signals that were detected using spectrometric plate readers (fig. 1) and was thus used as a positive model.
One of the major difficulties in establishing RET imaging is to distinguish the signal originating from the transfer of energy from that resulting from an overflow of the energy donor output into the energy acceptor detection channel. To control for this basal signal, we used another chimeric protein linking Rluc to a distinct green fluorescent protein (GFP) variant, the GFP2, which displays a maximum excitation peak at 400 nm (23), but cannot be efficiently
excited at 480 nm (wavelength corresponding to Rluc peak emission). As shown in figure 1, the signal detected in cells expressing Rluc-GFP2 upon CoelH addition was not different from that
observed in cells expressing Rluc alone, indicating that it corresponded to the overflow donor emission : basal 535 nm / 480 nm ratio. Thus, this Rluc-GFP2 fusion, almost identical to
Rluc-YFP, but unable of any energy transfer in presence of CoelH, was a stringent negative BRET control in the following BRET imaging experiments. Rluc-GFP2 was co-transfected with the
DsRed used as a transfection reporter to identify cells that do not display BRET. Another pool of cell was transfected in parallel with Rluc-YFP to obtain the positive BRET cells. Those two populations of transfected cells were subsequently mixed (24 h after transfection). Thanks to the DsRed, cells expressing Rluc-YFP or Rluc-GFP2+DsRed could therefore be identified when
studied in the same microscopic field (Fig. 2a-b), allowing a direct comparison of cells that display BRET or not. The emission of light at 450-510nm (corresponding to Rluc emission peak
at 480nm; em480) and 510-560nm (corresponding to the YFP emission peak at 535nm, em535) were acquired sequentially every 30 seconds, 10 minutes following the addition of CoelH (figure 2c-d). The ratio of images obtained at 535 nm over 480 nm (535 nm / 480 nm, see methods) revealed strong signals in cells expressing Rluc-YFP whereas only marginal signals were observed in cells expressing the BRET-negative control Rluc-GFP2 (Fig. 2e), indicating that
BRET originating from Rluc-YFP was detected at the single cell level.
Kinetics of the BRET signal.
To determine the optimal acquisition time after addition of CoelH, we recorded the em480 and em535 every minutes for 1 hour with repeated sequential acquisitions of 30 seconds at each wavelength. The em480 signal could be detected as early as 5 min after the addition of CoelH, reached its maximum between 15 and 20 min after the addition of the Rluc substrate and gradually declined afterward (fig. 2f and 2g). Since the intensity of the em480 depends on the expression level of the Rluc protein, cells displayed various intensities of em480 (fig. 2g). The em535 displayed similar kinetics and was also dependent on the expression level of the fusion proteins. As expected, however, similar levels of em480 (compare cell #3 and #4) yielded much higher em535 in cells expressing Rluc-YFP than Rluc-GFP2 at all times examined (Fig. 2h).
Accordingly, the 535 nm / 480 nm ratios were greater in cells expressing the positive BRET constructs, reaching their maximum 5 min after addition of CoelH and remaining constant for at least 25 minutes thereafter (Fig. 2i). Most importantly, the maximal 535 nm / 480 nm ratios did not depend on the protein expression level and were identical independently of the em480 intensity detected (compare cells #1, #2 and #3). 535 nm / 480 nm ratios started to decline for acquisition obtained more than 30 minutes after CoelH addition. The decrease was more pronounced in cells expressing lower protein levels (for exemple cell #3), most likely reflecting linear detection limits of the em535 that was reached with these low levels of em480 emission. Statistical analyses confirmed significantly higher 535 nm / 480 nm ratios in cells expressing YFP (Fig. 2j), allowing a clear distinction with the population of cells expressing Rluc-GFP2. Interestingly the 535 nm / 480 nm ratios obtained in cells transfected with the negative
BRET control, Rluc-GFP2, were also independent of the expression level of the fusion (Fig. 2j).
Because of the high fluorescence quantum efficiencies of YFP, possible traces of light in the black box could lead to image the YFP or CoelH fluorescence rather than BRET. We therefore verified that 1) Rluc-negative cells expressing only GFP did not display Em480 nor Em535 signals (Fig. 2 k-o), and 2) Rluc-positive cells did not emit light at 480 nm and 535 nm prior to CoelH application (Fig. 2 p-v). These are stringent controls that we systematically performed with our single photon detection camera.
Temporal resolution of BRET imaging.
We next assessed the minimal acquisition time necessary to detect reliable BRET signals. Cells expressing Rluc-YFP or Rluc-GFP2 (Fig. 3a-b) were therefore incubated with CoelH for 10
min before sequential acquisition of em480 and em535 for intervals of 1 to 120 sec (Fig. 3d-e). As expected, the em480 and em535 signals increased linearly with the acquisition time (Fig 3f-g). However, for very short acquisition times (<10 sec) the 535 nm / 480 nm ratios were out of the linear range, probably because of the camera detection limit. Signal to background ratios were then obtained for em480, em535 and 535 nm / 480 nm ratios (see methods). As shown in Fig 3h, the signal to background ratio (measured before any treatment of the images), which reflects the image contrast, varied as an hyperbolic function of the acquisition time. For the 535 nm / 480 nm ratios the values reached the asymptote for acquisition time above 20 sec indicating that longer
acquisition time are not necessary and would not provide clearer images.
Spatial resolution of BRET imaging.
To determine if BRET imaging could offer the necessary resolution to distinguish between sub-cellular compartments, a nucleus localization signal (NLS) was attached to Rluc-YFP (Rluc-Rluc-YFP-NLS). Cells transfected with Rluc-Rluc-YFP-NLS displayed a BRET signal strictly restricted to the nucleus (figure 4a-f), indicating that BRET can readily be imaged in a cellular organelle. Analysis of the median and intensity distribution of 535 nm / 480 nm ratios detected in individual cells revealed equivalent 535 nm / 480 nm ratios for this nuclear construct (Fig. 4g) as those observed for Rluc-YFP without nuclear localization signal (Fig. 2j). This indicated that the nuclear localization did not influence the 535 nm / 480 nm ratio that remained independent of the expression level. Interestingly, upon co-transfection of Rluc-YFP-NLS with Rluc-GFP2, the
specific nuclear BRET signal could readily be distinguished from the basal 535 nm / 480 nm ratio originating from Rluc-GFP2 uniformly distributed in the cytoplasm and the nucleus (Fig. 4h-l).
BRET signal originating from a specific sub-cellular location can thus easily be distinguished from basal 535 nm / 480 nm ratio, even if a protein attached to Rluc is distributed throughout the cell. This obviously opens the possibility of studying the sub-cellular localization of specific interactions.
Proof of principle: Dynamic recruitment of β-arrestin to the activated vasopressin receptor quantified in space and time by BRET imaging.
In an effort to establish whether BRET imaging could be used to monitor dynamic interactions between cellular proteins we monitored the interaction between the V2R vasopressin receptor (V2R) and β-arrestin2 (β-arr), a versatile regulatory protein that is actively recruited to many G protein-coupled receptors (GPCR) only as a result of receptor activation (24). To image V2R-β-arr interactions by BRET, we transfected cells with V2R-YFP and Rluc-β-arr fusion proteins. As expected, in the absence of receptor activation, Rluc-β-arr was homogeneously distributed throughout the cells, as illustrated by the dispersed em480 signal observed following CoelH addition. Given the lack of basal interaction between V2R-YFP and Rluc-β-arr, the weak 535 nm / 480 nm ratios observed under this control condition most likely reflects the overflow of the Rluc output into the YFP acceptor detection channel (Fig 5a-c). Consistent with this deduction, analysis of the mean 535 nm / 480 nm ratios intensities in more than 10 individual cells yielded values identical (mean 535 nm / 480 nm of 92 + 8) to the basal 535 nm / 480 nm ratios obtained for Rluc-GFP2 (mean 535 nm / 480 nm of 91 + 5). In contrast, agonist stimulation
of the receptor promoted strong clustering of both em480 and em535, resulting in significant 535 nm / 480 nm ratios images that reflect β-arr recruitment to the receptor (Fig 5d-f). The punctuate BRET pattern observed most likely resulted from the trafficking of the V2R/β-arr complex to clathrin-coated pits and endocytic vesicles that can be observed throughout the cells (24). To further test the spatial resolution of BRET imaging we took advantage of a Rluc-β-arr mutant in which the C-terminal residues R393 and R395, involved in its interaction with the endocytic adaptor protein 2 AP2 are mutated to glutamic acids. The resulting β-arr(R393E,R395E) can still be recruited to the receptor but remains in a more diffuse pattern at the plasma membrane and is found only rarely in clatherin-coated pits (25, 26). As shown in figure 5j-l, the 535 nm / 480 nm ratio images obtained following agonist-promoted recruitment of Rluc-β-arr(R393E,R395E) could be readily distinguished from those obtained with Rlucβ-arr (Fig 5d-f) in that the signal was largely restricted to the plasma membrane in agreements with the subcellular-distribution
properties of this mutant form of β-arr.
BRET imaging was then used to monitor the kinetics of Rluc-β-arr recruitment to the activated V2R-YFP. Em480 and em535 were measured in the same cells before and at intervals of 2 minutes following the addition of the V2R agonist, AVP. As shown in figure 5m, the agonist promoted a time-dependent increase in the 535 nm / 480 nm ratios that gradually converged into punctuate structures. The stacked histogram representation of the 535 nm / 480 nm ratio intensities detected throughout the plane of the cell clearly indicate that the BRET signal reached its maximum after 8 min of stimulation and remained relatively constant at least up to 16 min after AVP addition (Fig. 5n), consistent with the known kinetics of β-arr recruitment to V2R (27). This kinetics of Rluc-β-arr recruitment to the V2R-YFP measured in a single cell was very similar to that determined by measuring 535 nm / 480 nm ratio in a cell population using a lumino-fluorometer plate reader (Mithras) (Fig 5o). As shown in figure 5p, single cell microscopic BRET imaging also allowed to generate dose-response curves of the agonist promoted Rluc-β-arr recruitment to V2R-YFP yielding an EC50 for AVP identical to that obtained in cell populations using a plate reader.
Discussion
The present study provides a proof of principle that BRET can be used to image subcellular protein-protein interaction dynamics, in single living cells. We first established the experimental conditions to obtain meaningful BRET images and subsequently depicted the spatio-temporal interaction between the V2R and β-arr in mammalian cells. Coupling a sensitive EMCCD camera to a fluorescence microscope isolated from ambient light pollution is sufficient to detect em480 and em535 signals to obtain 535 nm / 480 nm ratio images. The time windows allowing constant BRET values were sufficient to quantitatively monitor biological events in real time within the tens of seconds to tens of minutes time frame. Acquisition time between 10 and 120 sec and images obtained 5 to 30 min after CoelH addition yielded quantitatively accurate values. Obviously, these parameters will need to be established carefully for each detection system used to perform BRET imaging. In that respect, it should be noted that the system used here relied on the sequential acquisition of the em480 and em535 signal images.
An important aspect of the BRET imaging method described herein is the ability to easily distinguish the true energy transfer signal from the basal 535 nm / 480 nm ratio, bringing to light the BRET signal originating exclusively from the energy transfer. We also found that for a given donor/acceptor ratio, the BRET values derived from the images are independent of the energy donor expression levels (see figure 2j, 4g and 4m), confirming that as it is the case for FRET, BRET imaging offers the quantitative advantage of a ratiometric measurement that is independent of the absolute intensity of the energy donor. Given that it is easier to determine the background from BRET than FRET and that in contrary to FRET there is no artefactual direct excitation of the energy acceptor, it is easier to take advantage of the independence of RET from the expression level of the energy donor to perform quantitative BRET image analysis.
BRET imaging offers sufficient resolution to detect signals that originate selectively from sub-cellular compartments (nucleus, plasma membrane or endocytic vesicles). Indeed, the 535 nm / 480 nm signal from the nucleus-targeted Rluc-YFP-NLS fusion could easily be distinguished from the Rluc-GFP2 weak signal dispersed throughout the cell. BRET imaging thus
allow to detect interactions between proteins exclusively in the compartment where they occur even if the protein attached to the energy donor is widely distributed throughout the cell. This
was confirmed while the BRET signal, originating from the interaction between Rluc-β-arr and V2R-YFP at the plasma membrane and endocytic vesicles, was distinguished from the overflow signal of the Rluc-β-arr dispersed in the cytoplasm. Finally, BRET clearly images the dynamic recruitment of β-arr to the V2R upon agonist stimulation of the receptor. Highly sensitive, the assay allowed to quantitatively monitor the kinetic and dose dependence of the recruitment at the single cell level yielding half times and EC50 similar to those obtained from the analysis in cell population (plate readers).
The possibility to image BRET signals will undoubtedly increase the breadth of potential applications of the technique. Indeed, identifying the subcellular location of the interaction monitored and quantitatively assessing changes that occur only in specific compartments provides clear advantage over the classical spectro-photometric BRET analysis obtained from plate readers. Given the limitations of FRET imaging linked to higher and more difficult to control backgrounds, possible photo-toxic effects of prolonged light illuminations or undesirable activation of photo-sensitive biological processes, we foresee that BRET imaging will offer an advantageous method that will nicely complement the toolset currently available to study protein-protein interactions in living cells.
Acknowledgments
We thank A. Carette, M. Vasseur, M. Hogue, C. Grolleau for technical help, F. Raynaud for critical analyses of the images and D. Rochdi and D. Michaud for providing Rluc-barr2(R393E, R395E). This work was supported by the European Community (LSHM-CT-2004-511995, SYNSCAFF), CNRS, INSERM, ANR, Région Languedoc Roussillon and CIHR. MB holds a Canada Research Chair in Signal Transduction and Molecular Pharmacology.
References
1. Piehler, J. 2005. New methodologies for measuring protein interactions in vivo and in vitro. Curr Opin Struct Biol 15, 4-14
2. Giepmans, B. N., S. R. Adams, M. H. Ellisman, and R. Y. Tsien. 2006. The fluorescent toolbox for assessing protein location and function. Science 312, 217-224
3. Eidne, K. A., K. M. Kroeger, and A. C. Hanyaloglu. 2002. Applications of novel resonance energy transfer techniques to study dynamic hormone receptor interactions in living cells. Trends Endocrinol Metab 13, 415-421
4. Hebert, T. E., C. Gales, and R. V. Rebois. 2006. Detecting and imaging protein-protein interactions during G protein-mediated signal transduction in vivo and in situ by using fluorescence-based techniques. Cell Biochem Biophys 45, 85-109
5. Lippincott-Schwartz, J., and G. H. Patterson. 2003. Development and use of fluorescent protein markers in living cells. Science 300, 87-91
6. Tsien, R. Y., B. J. Bacskai, and S. R. Adams. 1993. FRET for studying intracellular signalling. Trends Cell Biol 3, 242-245
7. Wu, P., and L. Brand. 1994. Resonance energy transfer: methods and applications. Anal Biochem 218, 1-13
8. Boute, N., R. Jockers, and T. Issad. 2002. The use of resonance energy transfer in high-throughput screening: BRET versus FRET. Trends Pharmacol Sci 23, 351-354
9. Ayoub, M. A., C. Couturier, E. Lucas-Meunier, S. Angers, P. Fossier, M. Bouvier, and R. Jockers. 2002. Monitoring of ligand-independent dimerization and ligand-induced conformational changes of melatonin receptors in living cells by bioluminescence resonance energy transfer. J Biol Chem 277, 21522-21528
10. Erickson, M. G., B. A. Alseikhan, B. Z. Peterson, and D. T. Yue. 2001. Preassociation of calmodulin with voltage-gated Ca(2+) channels revealed by FRET in single living cells. Neuron 31, 973-985
11. Gordon, G. W., G. Berry, X. H. Liang, B. Levine, and B. Herman. 1998. Quantitative fluorescence resonance energy transfer measurements using fluorescence microscopy. Biophys J 74, 2702-2713
12. Wallrabe, H., and A. Periasamy. 2005. Imaging protein molecules using FRET and FLIM microscopy. Curr Opin Biotechnol 16, 19-27
13. Nagoshi, E., C. Saini, C. Bauer, T. Laroche, F. Naef, and U. Schibler. 2004. Circadian gene expression in individual fibroblasts: cell-autonomous and self-sustained oscillators pass time to daughter cells. Cell 119, 693-705
14. Hoshino, H., Y. Nakajima, and Y. Ohmiya. 2007. Luciferase-YFP fusion tag with enhanced emission for single-cell luminescence imaging. Nat Methods 4, 637-639
15. Loening, A. M., A. M. Wu, and S. S. Gambhir. 2007. Red-shifted Renilla reniformis luciferase variants for imaging in living subjects. Nat Methods 4, 641-643
16. Xu, X., M. Soutto, Q. Xie, S. Servick, C. Subramanian, A. G. von Arnim, and C. H. Johnson. 2007. Imaging protein interactions with bioluminescence resonance energy transfer (BRET) in plant and mammalian cells and tissues. Proc Natl Acad Sci U S A 104, 10264-10269
17. De, A., A. M. Loening, and S. S. Gambhir. 2007. An improved bioluminescence resonance energy transfer strategy for imaging intracellular events in single cells and living subjects. Cancer Res 67, 7175-7183
18. Hamdan, F. F., M. Audet, P. Garneau, J. Pelletier, and M. Bouvier. 2005. High-throughput screening of G protein-coupled receptor antagonists using a bioluminescence resonance energy transfer 1-based beta-arrestin2 recruitment assay. J Biomol Screen 10, 463-475
19. Kalderon, D., B. L. Roberts, W. D. Richardson, and A. E. Smith. 1984. A short amino acid sequence able to specify nuclear location. Cell 39, 499-509
20. Perroy, J., S. Pontier, P. G. Charest, M. Aubry, and M. Bouvier. 2004. Real-time monitoring of ubiquitination in living cells by BRET. Nat Methods 1, 203-208
21. Perroy, J., L. Adam, R. Qanbar, S. Chenier, and M. Bouvier. 2003. Phosphorylation-independent desensitization of GABA(B) receptor by GRK4. Embo J 22, 3816-3824 22. Pfleger, K. D., and K. A. Eidne. 2006. Illuminating insights into protein-protein
interactions using bioluminescence resonance energy transfer (BRET). Nat Methods 3, 165-174
23. Mercier, J. F., A. Salahpour, S. Angers, A. Breit, and M. Bouvier. 2002. Quantitative assessment of beta 1- and beta 2-adrenergic receptor homo- and heterodimerization by bioluminescence resonance energy transfer. J Biol Chem 277, 44925-44931
24. Oakley, R. H., S. A. Laporte, J. A. Holt, L. S. Barak, and M. G. Caron. 1999. Association of beta-arrestin with G protein-coupled receptors during clathrin-mediated endocytosis dictates the profile of receptor resensitization. J Biol Chem 274, 32248-32257
25. Laporte, S. A., R. H. Oakley, J. A. Holt, L. S. Barak, and M. G. Caron. 2000. The interaction of beta-arrestin with the AP-2 adaptor is required for the clustering of beta 2-adrenergic receptor into clathrin-coated pits. J Biol Chem 275, 23120-23126
26. Vrecl, M., R. Jorgensen, A. Pogacnik, and A. Heding. 2004. Development of a BRET2 screening assay using beta-arrestin 2 mutants. J Biomol Screen 9, 322-333
27. Charest, P. G., and M. Bouvier. 2003. Palmitoylation of the V2 vasopressin receptor carboxyl tail enhances beta-arrestin recruitment leading to efficient receptor endocytosis and ERK1/2 activation. J Biol Chem 278, 41541-41551
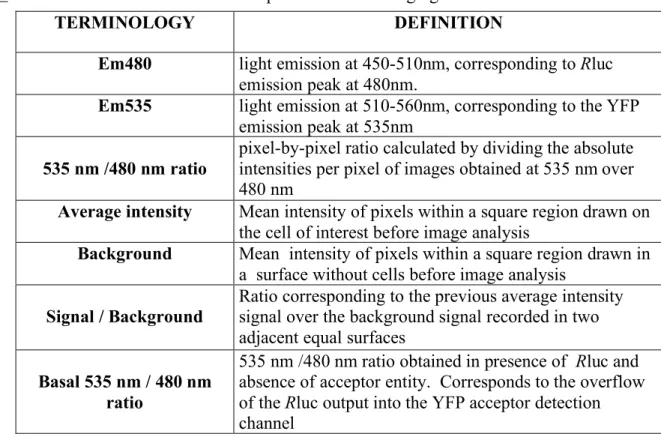
Table 1. Definition of the variables used to perform BRET imaging
Figure Legends
Fig. 1. RLuc-GFP2 fusion as a stringent negative control to determine the 535 nm / 480 nm
signal originating from the overflow of the energy donor output into the energy acceptor detection channel. Cells transfected with the soluble Rluc or Rluc-YFP fusion or Rluc-GFP2 construct were
incubated in the presence of CoelH 10 minutes before measurement of em480 and em535 in a spectrophotometric plate reader (a) or under microscope (b). Data are means + SEM of three independent experiments (plate reader) or means + SEM of 10 or 15 cells for each transfection condition (BRET imaging). Note that in both experiments the 535 nm / 480 nm signal obtained in
TERMINOLOGY DEFINITION
Em480 light emission at 450-510nm, corresponding to Rluc
emission peak at 480nm.
Em535 light emission at 510-560nm, corresponding to the YFP
emission peak at 535nm
535 nm /480 nm ratio
pixel-by-pixel ratio calculated by dividing the absolute intensities per pixel of images obtained at 535 nm over 480 nm
Average intensity Mean intensity of pixels within a square region drawn on
the cell of interest before image analysis
Background Mean intensity of pixels within a square region drawn in
a surface without cells before image analysis
Signal / Background Ratio corresponding to the previous average intensity signal over the background signal recorded in two
adjacent equal surfaces
Basal 535 nm / 480 nm ratio
535 nm /480 nm ratio obtained in presence of Rluc and absence of acceptor entity. Corresponds to the overflow of the Rluc output into the YFP acceptor detection channel
cells transfected with the Rluc-GFP2 construct is not significantly different from the one obtained
in cells expressing the soluble Rluc, thus validating the use of Rluc-GFP2 construct as a stringent
negative control to measure the basal 535 nm / 480 nm ratio (ie 535 nm / 480 nm ratio obtained in absence of BRET acceptor). In b, the original numerical 535 nm / 480 nm ratios (comprised between 0 and 1.5) were converted to a scale ranging from 1 to 256. This translation allows to visualize the 535 nm / 480 nm ratios with a continuous 256 pseudo-color look-up table (LUT) as displayed on subsequent figures.
Fig. 2. Em480, em535 and 535 nm / 480 nm images. a-b: YFP fluorescence (a) comparison with DsRed fluorescence (b) was used to discriminated between cells expressing RLuc-YFP (cells 1, 2 and 3), RLucGFP2/DsRed (cell 4) or DsRed alone (cell 5). c-d: Sequential
acquisition (30 sec each) of em480 (c) and em535 (d) recorded 10 min following the addition of 20 µM CoelH. e: 535 nm / 480 nm ratio images (derived from d/c) presented in pseudocolors. f: Images of em480 acquired every 5 min from 0 to 60 min after CoelH application. g–i: intensities of em480 (g), em535 (h) and 535 nm / 480 nm (i) signals over one hour after CoelH application.
j: boxes illustrating the median and dispersion of the maximal 535 nm / 480 nm ratio intensities
(10 minutes after addition of CoelH) for independent cells expressing YFP (9 cells) or Luc-GFP2 + DsRed (6 cells) or DsRed (2 cells). Each value was obtained by determining the 535 nm /
480 nm ratio for each pixel within a square of 21 X 21 pixels in the middle of the cell. The axes bar indicates the em480 level (indicative of the fusion protein amount) of each independent cells analyzed. k-l: YFP fluorescence (k) comparison with DsRed fluorescence (l) was used to discriminate between RLuc negative cells expressing GFP alone and RLucGFP2/DsRed. m-n:
Sequential acquisition (30 sec each) of em480 (m) and em535 (n) recorded 10 min following the addition of 20 µM CoelH. o: 535 nm / 480 nm ratio images (derived from n/m) presented in pseudocolors. p: YFP fluorescence to identify cells expressing RLuc-YFP. q-r and t-u: Sequential acquisition (30 sec each) of em480 (q and t) and em535 (r and u) recorded in absence of CoelH (q and r) or 10 min following the addition of 20 µM CoelH (t and u). s-v : 535 nm / 480 nm ratio images (derived from r/q and u/t, respectively) presented in pseudocolors.
Fig. 3. Influence of acquisition time for BRET imaging. a-b: YFP fluorescence (a) comparison with DsRed fluorescence (b) was used to discriminated between cells expressing RLuc-YFP (cells 1, 2 and 3), RLucGFP2/DsRed (cells 4 and 5) or DsRed alone (cell 6). c: 535
nm / 480 nm ratio images derived from 10 sec sequential acquisition of em480 and em535 10 min following the addition of CoelH. d-e: em480 (d) and em535 (e) images obtained for acquisition time varying from 1 to 120 sec recorded 10 min following the addition of CoelH . f – Em480 (upper panel) or em535 (lower panel) intensities recorded for the indicated acquisition time along a cross-section of cell #1 (see white bar; 1 pixel = 250 nm). g-h: Average of em480, em535 and 535 nm / 480 nm signal intensities (g) and signal to background ratios (h) measured for each pixel in the white and blue squares of 21 X 21 pixels of cells #2 and #4 respectively (drawn in a) as a function of acquisition time.
Fig. 4. Nuclear BRET imaging. a, and b: YFP fluorescence (a) versus DsRed fluorescence (b) in cells expressing RLuc-YFP-NLS (cells 1 and 2; note the nuclear labeling), RLucGFP2/DsRed (cell 3; note the labeling throughout the cell). c, d: Sequential acquisition (30
nm ratio images (derived from d/c) presented as pseudo-colors. f: 535 nm / 480 nm average intensities for a cross-section of cell #1 expressing RLuc-YFP-NLS (see white bar in image e; 1 pixel = 250 nm). g: Boxes illustrating the median and the distribution of the 535 nm / 480 nm ratio intensities for independent cells expressing Luc-YFP-NLS (9 cells) or Luc-GFP2 + DsRed
(2 cells). Each value was obtained from a square of 14 X 14 pixels in the nucleus region of the cell. The axes bar indicates the em480 level (indicative of the fusion protein amount) of each independent cells analyzed. h-k: Cells were co-transfected with RLuc-YFP-NLS and RLucGFP2
and fluorescence measured to identify the expressing cells (h). Em480 (i), em535 (j), and 535 nm / 480 nm images (k) obtained as above. l – 535 nm / 480 nm ratio average intensities for a cross-section of cell #3 and 4 (see white bar in image k, and blue bar in image e ; 1 pixel = 250 nm). m – Illustration of the median and distribution of 535 nm / 480 nm ratio intensities measured from squares of 14 X 14 pixels in the nucleus (yellow squares) or cytoplasm (blue squares) of 4 independent cells co-transfected with RLuc-YFP-NLS and RLuc-GFP2.
Fig. 5. BRET imaging of β-arr recruitment to activated V2R. Cells were co-transfected with V2RYFP and Rluc-β-arr (a-f and m-p), or V2R-YFP and Rluc-β-arr (R393E,R395E) (g-l).
a-l: Em480, em535 and 535 nm / 480 nm images obtained under basal conditions (a-c and g-i) or
following stimulation with 1µM AVP for 15 min (d-f and j-l). Right panels of figures c, f, i and l represent a zoom of the indicated square regions. m: em480, em535 and 535 nm / 480 nm images measured in the same cell as a function of time following addition of AVP. Cells illustrating panels a to m are representative of 5 to 10 similar experiments. n: Normalized stacked histogram of the pseudo-color 535 nm / 480 nm values determined in a plane of 21 pixels by 21 pixels for each time of AVP stimulation in a single cell. o: Kinetics of Rluc-β-arr recruitment to the stimulated V2R-YFP measured by BRET on a population of cells using a fluoro-luminometer plate reader. p: Dose-response curves of AVP-stimulated Rluc-β-arr recruitment to V2R-YFP determined on a single cell (BRET imaging) or on a cell population (plate reader). Agonist effects were measured 15 min following AVP stimulation. Data represent means + SEM of 3 independent experiments (plate reader) or means + SEM of 5 to 6 cells for each AVP concentration (BRET imaging).
Figure 1 535 nm / 480 nm ratio In c ell p opulation 535 nm / 480 nm ratio On single c ell B RET Imaging
a
b
256 0 Em480 Em535 535 nm / 480 nm GFP DsREd Figure 2 a Em480 b c d f e Em480 Em535 535 nm / 480 nm GFP DsREd k l m n o Em480 Em535 535 nm / 480 nm GFP p q r s t u v Em480 Em535 535 nm / 480 nm
Without CoelH With CoelH
256 0 j 5 3 5 n m / 4 8 0 n m
Em480 average intensity
0 50 150 100 200 0 200 0 4000 6000 Luc-YFP Luc-GFP2+DsRed DsRed
Time (min) of CoelH Incubation Time (min) of CoelH Incubation Time (min) of CoelH Incubation
Em480 Em535 535 nm / 480 nm g h i A v e ra g e I n te n s it y
535 nm / 480 nm Em535 Em480 S ig n a l / B a c k g ro u n d Em480 Em535 Em535 Em480 535 nm / 480 nm Figure 3 535 nm / 480 nm DsRed GFP 256 0
Acquisition time (sec) Acquisition time (sec) Acquisition time (sec)
Acquisition time (sec) Acquisition time (sec)
Figure 4 5 3 5 n m / 4 8 0 n m A v e ra g e I n te n s it y 0 50 150 100 200 250 Distance (pixels) 0 50 150 100 200 5 3 5 n m / 4 8 0 n m
Em480 average intensity
535 nm / 480 nm e f g 535 nm/480 nm 5 3 5 n m / 4 8 0 n m A v e ra g e I n te n s it y Distance (pixels) 5 3 5 n m / 4 8 0 n m
Em480 average intensity l
k m
LucYFP-NLS Cell 1
LucYFP-NLS + LucGFP2 Cell 4 LucGFP2 Cell 3 0 50 150 100 200 250
0.4 0.2 a b c Control d e f AVP 15 min g h i Control j k l AVP 15 min Figure 5 535 nm / 480 nm 535 nm / 480 nm 535 nm / 480 nm 535 nm / 480 nm 0 256 5 / 4 8 0 E m 5 3 5 E m 4 8 0 m o p % o f p ix e ls n 100 80 60 40 20