HAL Id: hal-00302628
https://hal.archives-ouvertes.fr/hal-00302628
Submitted on 27 Feb 2007HAL is a multi-disciplinary open access
archive for the deposit and dissemination of sci-entific research documents, whether they are pub-lished or not. The documents may come from teaching and research institutions in France or abroad, or from public or private research centers.
L’archive ouverte pluridisciplinaire HAL, est destinée au dépôt et à la diffusion de documents scientifiques de niveau recherche, publiés ou non, émanant des établissements d’enseignement et de recherche français ou étrangers, des laboratoires publics ou privés.
Air quality in North America’s most populous city ?
overview of MCMA-2003 Campaign
L. T. Molina, C. E. Kolb, B. de Foy, B. K. Lamb, W. H. Brune, J. L. Jimenez,
M. J. Molina
To cite this version:
L. T. Molina, C. E. Kolb, B. de Foy, B. K. Lamb, W. H. Brune, et al.. Air quality in North Amer-ica’s most populous city ? overview of MCMA-2003 Campaign. Atmospheric Chemistry and Physics Discussions, European Geosciences Union, 2007, 7 (1), pp.3113-3177. �hal-00302628�
ACPD
7, 3113–3177, 2007 Overview of MCMA-2003 Campaign L. T. Molina et al. Title Page Abstract Introduction Conclusions References Tables Figures ◭ ◮ ◭ ◮ Back CloseFull Screen / Esc
Printer-friendly Version Interactive Discussion
EGU
Atmos. Chem. Phys. Discuss., 7, 3113–3177, 2007 www.atmos-chem-phys-discuss.net/7/3113/2007/ © Author(s) 2007. This work is licensed
under a Creative Commons License.
Atmospheric Chemistry and Physics Discussions
Air quality in North America’s most
populous city – overview of MCMA-2003
Campaign
L. T. Molina1,2, C. E. Kolb3, B. de Foy1,2,4, B. K. Lamb5, W. H. Brune6, J. L. Jimenez7,8, and M. J. Molina1,9
1
Department of Earth, Atmospheric and Planetary Science, Massachusetts Institute of Technology, Cambridge, MA, USA
2
Molina Center on Energy and Environment, La Jolla, CA, USA
3
Aerodyne Research, Inc., Billerica, MA, USA
4
Saint Louis University, St. Louis, MO, USA
5
Laboratory for Atmospheric Research, Department of Civil and Environmental Engineering, Washington State University, Pullman, WA, USA
6
Department of Meteorology, Pennsylvania State University, University Park, PA, USA
7
Dept. of Chemistry and Biochemistry, University of Colorado at Boulder, Boulder, CO, USA
8
Cooperative Institute for Research in the Environmental Sciences (CIRES), University of Colorado at Boulder, Boulder, CO, USA
9
Department of Chemistry and Biochemistry, University of California at San Diego, San Diego, CA, USA
Received: 22 February 2007 – Accepted: 22 February 2007 – Published: 27 February 2007 Correspondence to: L. T. Molina (ltmolina@mit.edu)
ACPD
7, 3113–3177, 2007 Overview of MCMA-2003 Campaign L. T. Molina et al. Title Page Abstract Introduction Conclusions References Tables Figures ◭ ◮ ◭ ◮ Back CloseFull Screen / Esc
Printer-friendly Version Interactive Discussion
Abstract
Exploratory field measurements in the Mexico City Metropolitan Area (MCMA) in Febru-ary 2002 set the stage for a major air quality field measurement campaign in the spring of 2003 (MCMA-2003). Involving over 100 scientists from more than 30 institutions in Mexico, the United States and Europe, MCMA-2003 revealed important new insights 5
into the meteorology, primary pollutant emissions, ambient secondary pollutant precur-sor concentrations, photochemical oxidant production and secondary aerosol particle formation in North America’s most populated and polluted megacity. A description of meteorological and atmospheric chemistry and aerosol microphysics measurements performed during MCMA-2003 is presented. More than three dozen published or sub-10
mitted MCMA-2003 research papers are reviewed and key discoveries pertinent to understanding and improving air quality in Mexico City and similar megacities in the developing world are summarized.
1 Introduction
1.1 Air pollution in megacities 15
Degraded air quality in an increasingly urbanized world directly threatens the health of a large fraction of the world’s population, impacts the viability of important natural and agricultural ecosystems in regions surrounding highly urbanized areas, and contributes significantly to regional and global climate change. This challenge is particularly acute in the developing world where the rapid growth of megacities is producing atmospheric 20
pollution of unprecedented severity and extent. There is growing recognition that air-borne emissions from major urban and industrial areas influence both air quality and climate change on scales ranging from regional up to continental and global (Decker et al., 2000; Mayer et al., 2000; Molina and Molina, 2004; Molina et al., 2004).
ACPD
7, 3113–3177, 2007 Overview of MCMA-2003 Campaign L. T. Molina et al. Title Page Abstract Introduction Conclusions References Tables Figures ◭ ◮ ◭ ◮ Back CloseFull Screen / Esc
Printer-friendly Version Interactive Discussion
EGU
megacities (urban centers with population over 10 millions) of the developing world, change the chemical content of the downwind troposphere in a number of fundamen-tal ways (Molina et al., 2004). Emissions of nitrogen oxides (NOx), CO and volatile
organic compounds (VOCs) drive the formation of photochemical smog and its as-sociated oxidants, degrading air quality and threatening both human and ecosystem 5
health. On a larger scale, these same emissions drive the production of ozone (a powerful greenhouse gas) in the free troposphere, contributing significantly to global warming. Urban and industrial areas are also major sources of the major directly forc-ing greenhouse gases, includforc-ing CO2, CH4, N2O and halocarbons. Nitrogen oxide and
sulfur oxide emissions are processed to strong acids by atmospheric photochemistry 10
on regional to continental scales, driving acid deposition to sensitive ecosystems. Di-rect urban/industrial emissions of carbonaceous aerosol particles are compounded by the emission of high levels of secondary aerosol precursors, including: NOx, VOCs,
SO2, and NH3, resulting in the production of copious amounts of fine aerosol, affecting air quality in the urban source areas, the local radiation balance, and cloud formation 15
hundreds to thousands of kilometers downwind.
Recently, a benchmark study of air quality in the Mexico City Metropolitan Area (MCMA), a rapidly growing megacity with a current population of approximately 20 million, was undertaken by a team of U.S., European and Mexican scientists and engi-neers under the leadership of L. T. Molina and M. J. Molina. The Mexico City Project, 20
focused on North America’s most populous urban area, was planned as a case study of the Integrated Program on Urban, Regional and Global Air Pollution – a collaborative research and education program initiated at the Massachusetts Institute of Technology (MIT) by L. T. Molina and M. J. Molina in 1999 to address the air pollution problems of megacities in a coordinated and interdisciplinary manner. The Mexico City Project 25
included active collaboration with Mexican government officials and decision makers. Although the initial focus of the Integrated Program was on the MCMA, its goal was to develop method of integrated assessment applicable to other large urban centers throughout the world (Molina and Molina, 2002).
ACPD
7, 3113–3177, 2007 Overview of MCMA-2003 Campaign L. T. Molina et al. Title Page Abstract Introduction Conclusions References Tables Figures ◭ ◮ ◭ ◮ Back CloseFull Screen / Esc
Printer-friendly Version Interactive Discussion 1.2 Air quality in the Mexico city metropolitan area
Mexico City exhibits the types of environmental problems experienced by megacities around the world and faces the common obstacles to solving them. Air pollution in megacities is strongly influenced by many factors, including topography, meteorology, industrial growth, transportation needs, and expanding populations. The Mexico City 5
Metropolitan Area (19◦25′N Latitude and 99◦10′W Longitude) lies in an elevated basin
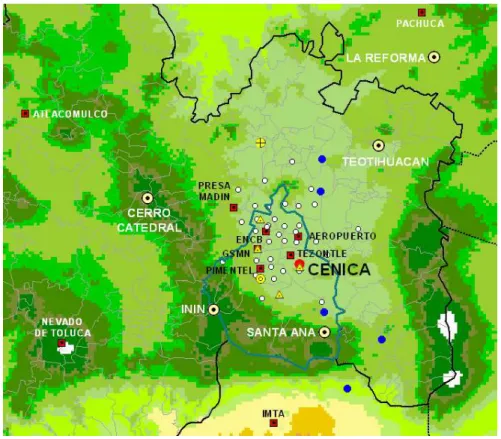
at an altitude of 2240 m above mean sea level. The nearly flat floor of the basin covers about 5000 km2of the Mexican Plateau and is confined on three sides (east, south and west) by mountain ridges but with a broad opening to the north and a narrower gap to the south-southeast. A topographical map of the MCMA is shown in Fig. 1.
10
During the twentieth century the MCMA experienced huge increases in population and urbanized area as it attracted migrants from other parts of the country and indus-trialization stimulated economic growth. The population grew from fewer than 3 million in 1950 to over 18 million in 2000. New residents continually occupied and urbanized areas further away from the historic center of the Federal District. In just over a half 15
century, urbanized area within the MCMA increased more than a factor of ten, from just 120 km2in 1940 to 1500 km2by 1995. This expansion pushed the city beyond the Fed-eral District and into other municipalities of the State of Mexico and other neighboring states. Currently, MCMA encompasses the 16 delegations of the Federal District, 37 municipalities of the State of Mexico and 1 municipality of the State of Hidalgo (Lezama 20
et al., 2002).
The topography and meteorology of the MCMA contribute substantially to its air pol-lution. The surrounding mountains, together with frequent thermal inversions, tem-porarily trap pollutants within the MCMA basin. The city’s high elevation and relatively low latitude lead to intense sunlight, promoting photochemical processes that drive the 25
formation of ozone and other oxidants. In this geographical setting, the metropolitan area’s almost 20 million residents, over 3.5 million vehicles, and over 40 000 indus-tries consume more than 40 million liters of petroleum fuels per day. Stationary and
ACPD
7, 3113–3177, 2007 Overview of MCMA-2003 Campaign L. T. Molina et al. Title Page Abstract Introduction Conclusions References Tables Figures ◭ ◮ ◭ ◮ Back CloseFull Screen / Esc
Printer-friendly Version Interactive Discussion
EGU
mobile fossil fuel combustion sources produce thousands of tons of directly emitted pollutants that react in the atmosphere to generate secondary pollutants that can be more dangerous to health than the primary pollutants. Air pollution is generally worst in the winter, when rain is less common and thermal inversions are more frequent (Molina and Molina, 2002).
5
Both the Mexican government and citizens have recognized air pollution as a major social concern since the mid-1980s. During the past decade, the Mexican government has made tremendous progress in improving air quality. Substantial reductions in the concentrations of some criteria pollutants (such as lead, carbon monoxide and sul-fur dioxide) were achieved by developing and implementing comprehensive air quality 10
management programs and improving air quality monitoring and evaluation programs (Molina and Molina, 2002).
Despite these important gains, serious air pollution problems still persist. MCMA residents remain exposed to unhealthy concentrations of air-borne pollutants, espe-cially particulate matter (PM) and ozone, the two most important pollutants from the 15
standpoint of public health.
In 1999, the Metropolitan Environmental Commission (Comisi ´on Ambiental Metropolitana, CAM) contracted the MIT Mexico City Project to request help in design-ing a strategic plan for its new ten-year (2000–2010) air quality management program. Project investigators prepared a series of white papers for CAM, including a review 20
of the state of understanding of air pollution science in the MCMA, lessons learned from air quality management programs to date, and recommendations for research and institutional change so that cost-effective measures can be efficiently developed and implemented. The white papers provided the foundation for the strategic planning for the new ten-year air quality management program prepared by the Mexican author-25
ities (CAM, 2002) and resulted in the publication of a book on integrated assessment of air quality in the Mexico megacity (Molina and Molina, 2002).
The project’s assessments of previous MCMA air quality measurements as well as ongoing attempts to model photochemical episodes captured in prior measurement
ACPD
7, 3113–3177, 2007 Overview of MCMA-2003 Campaign L. T. Molina et al. Title Page Abstract Introduction Conclusions References Tables Figures ◭ ◮ ◭ ◮ Back CloseFull Screen / Esc
Printer-friendly Version Interactive Discussion campaigns highlighted the need for more extensive experimental data from field
mea-surements to update and improve the MCMA emissions inventory and to improve the current knowledge of the chemistry, dispersion and transport processes of the pollu-tants emitted to the MCMA atmosphere (Molina et al., 2002).
One key requirement was a better understanding of VOC and NOxemissions inven-5
tories; for instance, available VOC emission inventories had to be increased by a factor of 2 to 3 in state-of-the–art photochemical models in order to obtain daily ozone peaks as high as those recorded during the 1997 IMADA-AVER (Investigaci ´on sobre Materia Particulada y Deterioro Atmosf ´erico, Aerosol and Visibility Evaluation Research) field campaign (Doran et el., 1998; Edgerton et al., 1999; Molina et al., 2002). MCMA mo-10
bile source emissions are suspect given the MCMA’s wide range of heavy and light duty vehicles and extremely congested traffic (Gakenheimer et al., 2002). A second key requirement was to better characterize both the emission/formation dynamics and chemical content of fine (PM2.5) aerosol particles, which penetrate the lung most effi-ciently (Evans et al., 2002; Pope and Dockery, 2006). There has been little available 15
data for MCMA PM2.5, but strong evidence of adverse health effects from airborne
par-ticles based on available PM10 data (Evans et al., 2002; Rosas-Perez et al., 2006). A third measurement goal was to test the accuracy of routine, commercial air quality in-strumentation such as that deployed at the monitoring sites of the Mexico City Ambient Air Monitoring Network (Red Autom ´atica de Monitor ´eo Atmosf ´erico, RAMA), which are 20
similar to those used by the U.S. Environmental Protection Agency (EPA).
In order to begin to investigate these issues, as well as to determine how well we could field and utilize research grade atmospheric chemistry instrument suites in the MCMA environment, innovative exploratory mobile and fixed site field measurements, funded by CAM, were performed during February 2002. This was followed by the 25
intensive MCMA-2003 field measurement campaign in the spring of 2003.
Preliminary results of the MCMA 2002/2003 measurements were presented at a special session on “Megacity Impacts on Air Quality” at the American Geophysical Union Fall Meeting held on 13–17 December 2004 in San Francisco, California. Major
ACPD
7, 3113–3177, 2007 Overview of MCMA-2003 Campaign L. T. Molina et al. Title Page Abstract Introduction Conclusions References Tables Figures ◭ ◮ ◭ ◮ Back CloseFull Screen / Esc
Printer-friendly Version Interactive Discussion
EGU
findings from the MCMA-2003 Campaign have been published in a special issue of Atmospheric Chemistry and Physics (ACP) as well as in other peer-reviewed journals. Currently 20 papers have been published by ACP, a few more have been accepted and should be published soon, and several additional papers are under review and have been published in Atmospheric Chemistry and Physics Discussions (ACPD). In 5
addition, 14 papers have been published elsewhere. A complete list is posted at the website of the Molina Center for Energy and the Environment (MCE2):http://mce2.org/
publications.html.
This overview is divided into the following sections: Scope of the MCMA-2002/2003 Campaigns (Sect. 2); MCMA Meteorology and Dynamics (Sect. 3), MCMA Emissions 10
of Gases and Fine PM Pollutants (Sect. 4); Measurements of MCMA Volatile Organic Compounds (Sect. 5); MCMA Photochemistry (Sect. 6); MCMA Particulate Matter (Sect. 7); Instrumentation Advances (Sect. 8). A short summary is presented in Sect. 9.
2 MCMA-2002/2003 project scope
2.1 Exploratory MCMA field campaign – February 2002 15
An exploratory research campaign was conducted during 7–24 February 2002 utiliz-ing a mobile laboratory developed at Aerodyne Research Inc. (ARI) and equipped with a real-time trace gas and particle diagnostics as well as other air quality moni-toring instruments (Kolb et al., 2004). During the exploratory mission, the mobile lab operated in three modes: (1) stationary deployments at selected RAMA monitoring 20
sites were used to measure diurnal pollution levels in various sectors of the MCMA and to provide high time resolution research instrument data for selected pollutants to help validate and amplify data from the monitoring instruments; (2) mobile measure-ments were made through selected city sectors to map ambient pollutant levels and to sample and characterize mobile and fixed site emission plumes; and (3) dedicated on-25
ACPD
7, 3113–3177, 2007 Overview of MCMA-2003 Campaign L. T. Molina et al. Title Page Abstract Introduction Conclusions References Tables Figures ◭ ◮ ◭ ◮ Back CloseFull Screen / Esc
Printer-friendly Version Interactive Discussion emissions from selected classes of vehicles, including heavy-duty diesel trucks, buses,
and colectivos (ubiquitous small gasoline or condensed natural gas (CNG) powered microbuses).
Washington State University (WSU) collected VOC whole air samples at selected sampling points within the urban area using portable canister samplers; individual VOC 5
was analyzed with capillary column gas chromatography using flame ionization detec-tion (GC/FID). Four fixed mobile units provided by Mexican institudetec-tions were located at the boundary sites (Chalco, Ajusco, Teotihuacan and Cuautitlan) to measure criteria pollutants and meteorological parameters. Additional meteorological measurements were obtained using a tethered balloon and pilot balloons launched by Mexican re-10
searchers and radionsondes deployed by the Mexican National Weather Service (Ser-vicio Meteorol ´ogico Nacional, SMN).
2.2 MCMA-2003 campaign
With the successful completion of the 2002 Exploratory Mission and the financial sup-port from CAM, the MIT-led experimental team planned an intensive, five-week field 15
campaign from 31 March to 4 May 2003. The campaign’s field measurement phase was designed to cover the height of the annual photochemical pollution season just prior to the onset of the rainy season and was planned to include measurements taken before, during, and after Holy Week (14–20 April 2003). During this week vehicular traffic is historically reduced as many of the residents leave the city for holidays. It 20
was anticipated that by taking measurements before, during and after Holy Week, a better assessment of the vehicular emissions contribution to the air quality reduction in this megacity could be assessed with regard to oxidant and aerosol levels. Unlike the February 2002 exploratory field campaign that focused primarily on mobile labora-tory measurements, the 2003 campaign also involved a highly instrumented “supersite” 25
co-located with the campaigns headquarters at the National Center for Environmental Research and Training (Centro Nacional de Investigaci ´on y Capacitaci ´on Ambiental
ACPD
7, 3113–3177, 2007 Overview of MCMA-2003 Campaign L. T. Molina et al. Title Page Abstract Introduction Conclusions References Tables Figures ◭ ◮ ◭ ◮ Back CloseFull Screen / Esc
Printer-friendly Version Interactive Discussion
EGU
Ecolog´ıa or INE).
Based on the Mexico City Project’s original assessment of the MCMA air pollution problem (Molina and Molina, 2002) and analyses of the February 2002 campaign data, the multi-national team adopted the following four scientific goals for the MCMA-2003 field campaign:
5
Goal 1: Develop an improved temporally (diurnal, weekday/weekend) and spatially
resolved VOC and NOx (NO + NO2) emissions inventory for Mexico. Emphasize
un-derstanding the role of mobile versus stationary sources as well as emission sources of aldehydes, aromatics, and other organics with high ozone and secondary organic particulate formation potential.
10
Goal 2: Because of its key role in ozone production and direct toxic health threat,
develop a better understanding of formaldehyde (HCHO) urban atmospheric chemistry. Use vehicle emissions ratios for HCHO/CO2 and diurnal HCHO atmospheric concen-trations to assess direct emission versus in situ photochemistry source strengths.
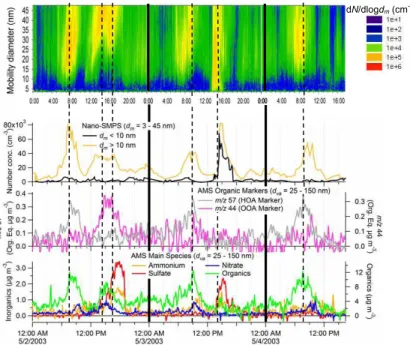
Goal 3: Identify major fine airborne aerosol components (sulfate, nitrate, ammonium,
15
organics) and correlate aerosol composition patterns with major sources of secondary aerosol precursor gases such as SO2, NOx, NH3, and selected VOCs.
Goal 4: Develop a better understanding of NOyambient levels and partitioning
dur-ing photochemical episodes in Mexico City and to better constrain the NOybudget and identify how critical components evolve during diurnal cycles.
20
In order to do the best possible job in reaching these scientific goals, the mobile labo-ratory and fixed site instrumentation were upgraded for the spring 2003 campaign with supplemental funds from the US National Science Foundation and Mexican Petroleum (Petr ´oleos Mexicanos, PEMEX); the participation of European investigators through the MIT Alliance for Global Sustainability (AGS), as well as participation of many US 25
research teams at the supersite supported by other resources.
The fixed “supersite” capability at CENICA was enhanced with state-of-the-art in-strumentation contributed by the US and European teams. CENICA is housed in a laboratory building on the Iztapalapa campus of the Metropolitan Autonomous
Univer-ACPD
7, 3113–3177, 2007 Overview of MCMA-2003 Campaign L. T. Molina et al. Title Page Abstract Introduction Conclusions References Tables Figures ◭ ◮ ◭ ◮ Back CloseFull Screen / Esc
Printer-friendly Version Interactive Discussion sity (Universidad Aut ´onoma Metropolitana, UAM). CENICA maintains its own suite of
routine (EPA level) air quality monitoring instruments for criteria pollutants and also has an automated sampling system for GC/FID analysis of VOCs. In addition, the au-tomatic monitoring network RAMA maintains two nearby official air quality monitoring sites.
5
During the MCMA-2003 campaign, a tall flux tower was erected on the roof top of CENICA for continuous micrometeorological flux measurements of carbon dioxide, wa-ter vapor, total olefins and selected VOCs. The CENICA site also hosted collaborative measurements from various US and European institutions, including (i) HOx concentra-tions and OH reactivity measurements from Penn State; (ii) a GC-based peroxyacetyl 10
nitrate (PAN) instrument, an open-path near infrared ammonia vapor instrument, a Luminol chemiluminescent instrument for semi-continuous olefin measurements, and aethalometer for black carbon determinations from the Argonne National Laboratory (ANL); (iii) nitro-PAH measurements from University of California, Riverside; (iv) an aerosol mass spectrometer (AMS) from University of Colorado; (v) a proton transfer 15
reaction mass spectrometer (PTR-MS) and several radiometers and particle sampler from Pacific Northwest National Laboratory (PNNL); (vi) two research lidars from Swiss Federal Institute of Technology (EPFL) and from MIT/Free University of Berlin (FUB), and a commercial lidar from Elight; (vii) two research grade visible/near ultraviolet dif-ferential optical analysis spectroscopy (DOAS) instruments provided by the University 20
of Heidelberg and operated by the MIT team; (viii) mini-DOAS and FTIR spectrometers from Chalmers University of Technology.
A key feature of the spring MCMA-2003 campaign was the deployment of a new and larger mobile laboratory equipped with additional instruments developed by ARI as well as contributed by participating collaborators, including a quantum cascade tunable 25
infrared laser differential absorption spectrometer (QC-TILDAS) to measure gaseous ammonia (NH3) from ARI, a commercial total nitrogen oxide (NOy) from MIT; a cus-tomized GC-instrument to measure PAN from ANL, an aethalometer from Lawrence Berkeley National Laboratory (LBNL), and a customized impactor to collect fine
par-ACPD
7, 3113–3177, 2007 Overview of MCMA-2003 Campaign L. T. Molina et al. Title Page Abstract Introduction Conclusions References Tables Figures ◭ ◮ ◭ ◮ Back CloseFull Screen / Esc
Printer-friendly Version Interactive Discussion
EGU
ticles for subsequent synchrotron X-ray analysis provided by PNNL. These additional instruments, coupled with the fast response trace gas and fine particle instrumenta-tion from the original ARI mobile laboratory, allowed a wide range of experiments to be pursued during the MCMA-2003 Campaign. When not involved in mobile mapping, chase or other off site experiments, the mobile laboratory was sited at CENICA and its 5
instrument suite contributed to the supersite’s database.
As in the February 2002 campaign, RAMA, CENICA, and the Secretary of Ecology of the State of Mexico (Secretar´ıa de Ecolog´ıa, Gobierno del Estado de Mexico, SEGEM) deployed mobile units containing standard commercial air quality and meteorological instrumentation at several sites near the edge of the Valley of Mexico to monitor the air 10
entering and leaving the valley (See Fig. 1). Meteorological parameters were obtained from tethered balloons, pilot balloons, radiosondes and sodars deployed by collaborat-ing Mexican and US teams. IMP participants complemented the measurements with sampling and chemical characterization of fine particles at three sites using MINIVOLS and MOUDI devices, as well as total carbonyls and its chemical speciation at several 15
sites.
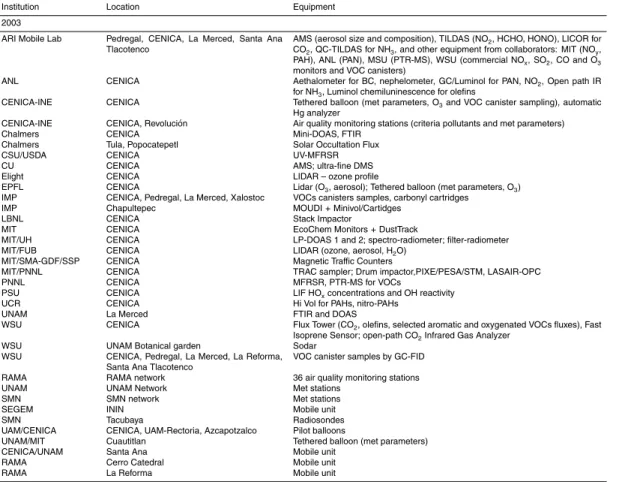
The instrumentation deployed during the campaign is described in more details in the following sections. A list of key participating institutions and instrumentation is presented in Table 1; a complete list is available at the MCE2 website (http://www.
mce2.org/). 20
3 MCMA meteorology and dynamics
Three questions guided the analysis of the meteorological observations during MCMA-2003 Campaign
1. What is the nature of the mixed layer?
2. What is the impact of pollutant carry-over from day to day? 25
ACPD
7, 3113–3177, 2007 Overview of MCMA-2003 Campaign L. T. Molina et al. Title Page Abstract Introduction Conclusions References Tables Figures ◭ ◮ ◭ ◮ Back CloseFull Screen / Esc
Printer-friendly Version Interactive Discussion 3. How good is the performance of mesoscale meteorological models?
A combination of operational and intensive observations were used to address these questions as well as provide wind transport analyses for interpreting MCMA-2003 aerosol and gas phase measurements.
3.1 Observational resources 5
The location of MCMA meteorological observation sites is shown in Fig. 1. Surface meteorological measurements were available from the automatic network of the Mexi-can National Weather Service (SMN) for 60 stations nationwide, of which 6 were in the Valley of Mexico basin. Of the 36 RAMA monitoring sites in the basin, 15 have meteoro-logical stations. The National Autonomous University of Mexico (Universidad Nacional 10
Aut ´onoma de M ´exico, UNAM) operated 5 stations, plus its high-school network consist-ing of 18 surface sites (not shown in the map). CENICA obtained measurements at the campaign supersite as well as at their Revolucion laboratory located at the southwest part of the city. Together, these stations provided extensive spatial coverage of the basin, enabling the identification of surface wind circulation features. During the 2003 15
campaign, mobile units were deployed at four boundary sites: Santa Ana Tlacotenco, Cerro Catedral, ININ and La Reforma (Hidalgo). These measured meteorological pa-rameters as well as criteria pollutants, establishing boundary conditions and detecting the transport of the urban plume out of the basin.
In the vertical, radiosonde observations were available from SMN every 6 h at their 20
headquarters in Mexico City and once a day at 12:00 UTC at other locations through-out the country. Radiosonde data are used to determine the synoptic meteorological conditions and to initialize the global meteorological models upon which the mesoscale simulations rely. The profiles every 6 h provided information on the day-to-day variation of the boundary layer.
25
ACPD
7, 3113–3177, 2007 Overview of MCMA-2003 Campaign L. T. Molina et al. Title Page Abstract Introduction Conclusions References Tables Figures ◭ ◮ ◭ ◮ Back CloseFull Screen / Esc
Printer-friendly Version Interactive Discussion
EGU
pressure, temperature and humidity measurements up to 1000 m above ground level. At CENICA these balloons were launched during 5 days of the campaign, with profiles carried out every 2 h starting at 03:00 a.m. until the early afternoon when the strength of the winds precluded further soundings. Measurements during the night enabled the observation of the drainage flows and the nighttime boundary layer as well as 5
its morning evolution. A SODAR was deployed in the botanical gardens at UNAM, measuring three-dimensional winds up to 600 m above ground level in the southern part of the city.
Pilot balloons were released simultaneously from 3 sites around the basin every 2 h during the morning and early afternoon. By measuring azimuth and elevation angles 10
every 10 s, wind speeds were calculated throughout the height of the boundary layer, showing spatial variations in the basin’s vertical wind patterns (de Foy et al., 2006c).
LIDARs sited at CENICA measured continuous vertical profiles of ozone and aerosol backscatter (Frey et al., 2004; Ristori et al., 2004; Simeonov et al., 2004). Their high spatial and temporal resolution as well as continuous time coverage enabled detailed 15
observation of the boundary layer evolution above the supersite. A three axis sonic anemometer located on the flux tower at CENICA supersite (Velasco et al., 2005a, b) recorded wind speeds at 10 Hz, providing turbulence measurements, latent heat fluxes and sensible heat fluxes.
3.2 Meteorological overview 20
Several field campaigns have analyzed the complex wind circulation in the Mexico City basin. In 1991, the Mexico City Air Quality Research Initiative (MARI) measured ver-tical pollutant distributions due to the interaction of drainage flows and gap flows from outside the basin (Streit and Guzman, 1996). In 1997, the IMADA-AVER Boundary Layer Experiment found short residence times in the basin with rapid ventilation and 25
recirculation aloft due to vertical wind shear (Fast and Zhong, 1998). Subsequent mod-eling studies have focused on the horizontal wind convergence zone and its impact on air pollution (Jazcilevich et al., 2005).
ACPD
7, 3113–3177, 2007 Overview of MCMA-2003 Campaign L. T. Molina et al. Title Page Abstract Introduction Conclusions References Tables Figures ◭ ◮ ◭ ◮ Back CloseFull Screen / Esc
Printer-friendly Version Interactive Discussion The MCMA-2003 field campaign was scheduled near the end of the dry season when
there is intense solar radiation but limited convective activity. Cold fronts moving into the tropics during the cold season lead to strong cold northerly winds along the coast of the Gulf of Mexico known as cold surges or “El Norte.” These bring moisture and rainfall to the Mexican plateau. A strong cold surge occurred just before the campaign 5
and two more followed during the campaign. This led to a more humid month than usual. In particular, the rain from the first cold surge led to a reduction in biomass burning in the region that increased again as the campaign progressed. Of the 34 days in the campaign, 10 were classified as “Cold Surge.”
There were two episodes featuring an anti-cyclone over the eastern Pacific leading 10
to weak northerly winds aloft of the MCMA. Thermally driven circulations develop under these conditions with strong sea breezes from both coasts interacting with the mountain breezes in the Mexico City basin. The resulting wind pattern has a northerly flow during the early morning and afternoon followed by a low level gap flow from the southeast; this forms a convergence zone that moves northward into the early evening. High 15
ozone levels in the south of the city are associated with these events. The two episodes lasted for a total of 7 days and were classified as “O3-South.”
The rest of the MCMA-2003 Campaign was characterized by low-pressure systems moving over the US but little activity over Mexico. Stronger westerly winds aloft due to the sub-tropical jet had a southerly component above Mexico City. As the mixing height 20
grew during the day, down mixing of momentum led to a reinforcement of the low-level gap flow and to southwesterly flow over the basin rim. A north-south convergence line formed with pollutant transport in the afternoon to the northeast. Because the convergence line moved little during the afternoon, these days experienced the highest ozone levels of the campaign with peak concentrations in the north of the city. Two 25
major episodes and three short transition periods featuring these conditions covered 17 days, which were classified as “O3-North”.
The days classified in the three episode types, Cold Surge, O3-South and O3-North, experienced broadly similar wind patterns, cloud cover and pollutant levels (de Foy
ACPD
7, 3113–3177, 2007 Overview of MCMA-2003 Campaign L. T. Molina et al. Title Page Abstract Introduction Conclusions References Tables Figures ◭ ◮ ◭ ◮ Back CloseFull Screen / Esc
Printer-friendly Version Interactive Discussion
EGU
et al., 2005). Conceptual wind circulation patterns for each episode are shown in Fig. 2. Averaging according to episode type produced meaningful diurnal patterns constructed from time series meteorological and pollutant data collected during the campaign. For example, plotting the range and inter-quartile range of diurnal profiles of ozone classified by episode type shows distinct afternoon behavior with little overlap 5
between the episode types.
The nature of the mixed layer in the basin is strongly influenced by its high eleva-tion, intense heating and low moisture content, as well as the physical barrier of the surrounding mountains. Mixed layer heights diagnosed from radiosonde observations during the campaign ranged from 3 to 4 km above ground level. LIDAR measurements 10
revealed fluctuations on short time scales in the layer height due to horizontal varia-tions in wind currents. At night, a small residual layer was sometimes observed aloft. At the surface, a persistent layer of mechanical mixing reaching up to 500 m was fre-quently seen. Rapid and thorough mixing during the day gave way to decoupling in the late afternoon with a residual ozone layer aloft in the early evening (Frey et al., 2004; 15
Ristori et al., 2004).
3.3 Meteorological modeling studies
Meteorological mesoscale model simulations and evaluations are inherently uncertain for complex terrain cases with weak synoptic forcing. Furthermore, Mexico City has an urban heat island with potential impacts on the wind circulation (Jauregui, 1997; 20
Jazcilevich et al., 2002). Land surface properties derived from satellite remote sensing using the MODIS instrument were used to improve the representation of surface heat fluxes in MM5 (de Foy et al., 2006b). This led to improved temperature, humidity and wind simulations on the fine scale (3 km) simulations. The nighttime urban heat island was clearly seen from the MODIS data. The refinements of the land surface in the 25
model are a necessary first step to using and evaluating more sophisticated urban modules within mesoscale models.
ACPD
7, 3113–3177, 2007 Overview of MCMA-2003 Campaign L. T. Molina et al. Title Page Abstract Introduction Conclusions References Tables Figures ◭ ◮ ◭ ◮ Back CloseFull Screen / Esc
Printer-friendly Version Interactive Discussion leading to a sharp drop in the mixed layer height near sunset (Doran and Zhong, 2000).
While similar measurements were not available, the simulated heat balance across the southern basin rim varied little, and the wind direction aloft was found to be the main predictor of the variations in gap flow for O3-South episodes with no clear predictor for the other episodes that could be determined from available data (de Foy et al., 2006a). 5
Pollutant carry-over from day to day is an important factor in urban air pollution and computational assessments can lead to important insights. Pilot balloon measure-ments were used to validate a Lagrangian trajectory model (de Foy et al., 2006c). Numerical estimates of the residence time of air parcels in the basin suggested rapid pollutant export from the basin and limited recirculation fractions that vary by episode 10
type. Patterns of pollutant export to the regional environment also varied by episode type and some larger scale recirculation was found for O3-South days.
Dispersion modeling of carbon monoxide was used in combination with total CO column measurements to suggest that vertical diffusion schemes must be carefully selected before recommending adjustments to the emission inventory (de Foy et al., 15
2007). Lagrangian trajectories were able to reconstruct emissions of CO and distin-guish between the impacts of large SO2 point sources (de Foy et al., 2007), thereby providing further validation of the trajectory quality.
4 MCMA emissions of gaseous and fine PM pollutants
Characterizing and quantifying the emissions of both gaseous pollutants and primary 20
PM is a difficult task in any major urban area, but it presents a particularly daunting task in a rapidly developing megacity like the MCMA. As mentioned in Sect. 1.2, Mexico City is characterized by an expanding population and rapidly changing economic and social conditions; changes that impact both the quantity and speciation of gaseous and PM emissions, making the development of accurate emissions inventories a fast moving 25
ACPD
7, 3113–3177, 2007 Overview of MCMA-2003 Campaign L. T. Molina et al. Title Page Abstract Introduction Conclusions References Tables Figures ◭ ◮ ◭ ◮ Back CloseFull Screen / Esc
Printer-friendly Version Interactive Discussion
EGU
4.1 MCMA emissions inventories
Further challenges arise from the fact that the development of traditional “bottoms up” emission inventories is a relatively new activity in Mexico. While the first estimates of pollutant emissions in MCMA were made in the 1970s, initial efforts were hampered by a lack of actual emissions measurements and addressed a very limited number of 5
species. The first systematic emissions inventory (EI) attempted was published in 1988 for use in the MCMA’s inaugural air quality assessment, the Integrated Program for At-mospheric Pollution Control (Programa Integral Contra la Contaminaci ´on Atmosf ´erica, PICCA). Starting in 1994 the Environment Secretary of the Federal District Govern-ment (Secretaria de Medio Ambiente, Gobierno de Distrito Federal, SMA-GDF) has 10
published biennial MCMA EI’s. However, from the first systematically released 1994 EI up to the most recently published 2004 EI (CAM, 2006), emission estimates were based on the use of measured and/or modeled emission factors, which were either locally measured or adapted from other locations. Substantial efforts have been made to increase the use of local measurements of emission factors in the most recent pub-15
lished EIs. When model estimates of emission factors were made, the models were adjusted to local conditions whenever possible. Despite these efforts, important emis-sion estimates from various emisemis-sion sources relied upon non-local emisemis-sion factors that were not necessarily appropriate for the MCMA’s unique combination of meteo-rology, topography, altitude, and social practices (Molina and Molina, 2002). Efforts to 20
develop the first comprehensive national emissions inventory (for the year 1999) for Mexico was started by INE in 2000 (NARSTO, 2005); it was released in September 2006 (INE-SEMARNAT, 2006).
Prior to 2002, MCMA ambient and direct emissions measurements clearly indicated that leaks from the city’s liquefied petroleum gas (LPG) system, the main fuel for MCMA 25
cooking and water heating, and on-road motor vehicle emissions, from more than 3.5 million vehicles with an average age of ∼9 years, produced large amounts of pho-tochemically active species. LPG leakage was shown to produce high ambient
con-ACPD
7, 3113–3177, 2007 Overview of MCMA-2003 Campaign L. T. Molina et al. Title Page Abstract Introduction Conclusions References Tables Figures ◭ ◮ ◭ ◮ Back CloseFull Screen / Esc
Printer-friendly Version Interactive Discussion centrations of propane, butanes and other low molecular weight alkanes and alkenes
(Blake and Rowland, 1995; Arriaga et al., 1997), while motor vehicle emissions were responsible for substantial levels of NOx, CO, and a number of highly reactive aromatic
and olefinic VOCs (Bishop et al., 1997; Mugica, et al., 1998, 2003; Schifter et al., 2003). Schifter et al. (2005) recently published retrospective fuel-based motor vehicle emis-5
sions inventory estimates for 1980-2000 based primarily on the prior remote sensing vehicle measurements noted above. Additional work on restaurant and roadside food vendor cooking emissions (Mugica et al., 2001); VOC receptor modeling (Vega et al., 2000), and fugitive dust emissions (Vega et al., 2001) provided valuable insights about other important pollution sources. Estimating emissions from more than 40 000 MCMA 10
industrial sites, many of them relatively small, is particularly challenging.1
Both analyses of ambient CO and VOC measurements (Arriaga-Colina et al., 2004) and photochemical model comparisons with measured ozone and nitrogen oxide lev-els (West et al., 2004) cast serious doubt on the accuracy of EI evaluations available before 2003. Estimates of normal (non-fire) biogenic NO and VOC emissions indicate 15
that they are a very small fraction of total MCMA emissions (Velasco, 2003). Given the uncertainties of MCMA EIs available in 2002/2003 and the clear need to better char-acterize the emissions of gaseous and PM species from anthropogenic sources that contribute to the high levels of photochemical oxidants and fine PM levels observed in the MCMA, several ambient measurement methods to better assess the emissions 20
of VOCs, NOx, NH3, and primary fine particles were developed and deployed during
MCMA 2002/2003.
1
According to the 2004 Emissions Inventory (CAM, 2006): There are about 42 000 micro-industries, 4200 small and medium size industries and 460 large industries. The point sources emissions estimates in the 2004 EI were constructed with information from about 4900 indus-tries.
ACPD
7, 3113–3177, 2007 Overview of MCMA-2003 Campaign L. T. Molina et al. Title Page Abstract Introduction Conclusions References Tables Figures ◭ ◮ ◭ ◮ Back CloseFull Screen / Esc
Printer-friendly Version Interactive Discussion
EGU
4.2 Mobile emissions measurements
One major emissions measurement facility, fielded by ARI in both the MCMA-2002 exploratory campaign and during MCMA-2003, was a van borne mobile laboratory equipped with a unique set of real-time trace gas and fine PM instruments to better characterize on-road vehicle emissions as well as to identify and characterize point 5
and area source emissions plumes (Kolb et al., 2004; Herndon et al., 2005). Emission indices (g pollutant/kg fuel burned) can be computed from fast response (1–2 s) cor-relations of excess (above background) exhaust plume trace gas or PM components to excess plume CO2, using tunable infrared laser differential absorption spectroscopy
(TILDAS), PTR-MS, or chemiluminescence measurements (CL) for gaseous species, 10
while aerosol mass spectrometry (AMS) provides fast response non-refractory fine par-ticle composition measurements. Emissions from specific types of vehicles can be characterized in “chase” mode where the target vehicles’ exhaust plumes are repeat-edly sampled as their driving mode changes; while “fleet average” emission indices can be acquired by randomly sampling plumes from many vehicles as they pass the 15
mobile laboratory traveling in either direction. Somewhat less reliable fleet average emissions can be obtained using slower response (5–30 s) instruments to correlate on-road pollutant levels with appropriately averaged intervals of excess CO2.
The MCMA-2003 measurements represent the first use of a PTR-MS to inves-tigate on-road vehicle VOC emissions. Details of the on-road PTR-MS measure-20
ment technique have been presented by Rogers et al. (2006). Zavala et al. (2006) present MCMA 2002/2003 on-road exhaust emission ratios (excess plume pollutant ppbv/excess plume CO2ppmv) for NO, NO2, NH3, HCHO, CH3CHO, C6H6, CH3C6H5, MBTE + butenes, C2-benzenes and C3-benzenes for various classes of both gasoline and diesel fueled vehicles. These ratios can be used to compute fuel based emis-25
sion indices and combined with MCMA fleet composition and fuel usage to estimate total annual emissions. The annual vehicle NOx emissions estimated by Zavala et
ACPD
7, 3113–3177, 2007 Overview of MCMA-2003 Campaign L. T. Molina et al. Title Page Abstract Introduction Conclusions References Tables Figures ◭ ◮ ◭ ◮ Back CloseFull Screen / Esc
Printer-friendly Version Interactive Discussion and the fuel based EI based on 2002 remote sensing studies analyzed by Schifter et
al. (2005). Jiang et al. (2005) analyzed mobile laboratory slower response instrument data to estimate fleet average emissions of black carbon, PM bound polycyclic aro-matic hydrocarbons (PPAHs), NOx, CO, and PM2.5, they also extrapolated PTR-MS VOC data to estimate total exhaust VOC emissions. Their NOx and PM2.5 estimates
5
compare well with official 2002 vehicle emission estimates (CAM, 2004). There are no official EI estimates for PM-associated black carbon or PAHs. In 2003 the ARI mobile laboratory also deployed a conditional sampling system designed to collect separate canister samples of exhaust plume enriched air and on-road background air for subse-quent gas chromatographic analysis (Herndon et al., 2005, 20072). These data, after 10
regressions analyses to correct for photochemical losses, have been correlated with ambient VOC canister samples to determine which ambient VOC concentrations are dominated by vehicular emissions (Velasco et al., 2007).
A second mobile emissions characterization facility, from Chalmers University of Technology, consisted of a vehicle-mounted miniature Differential Optical Absorption 15
Spectrometer (mini-DOAS) instrument designed to remotely sense and characterize SO2 emission plumes using zenith sky ultraviolet measurements of SO2 column den-sity concentration variations (Galle et al., 2003) and a solar Fourier-transform Infrared (FTIR) instrument primarily used to characterized CO column concentrations. Mea-surements of SO2 plumes from a large power plant and refinery complex in Tula and 20
the Popocat ´epetl volcano have been used to assess the ability of models to effectively incorporate large scale point emission sources, while CO column measurements were used to assess if models can be used to constrain the MCMA CO EI (de Foy et al., 2007).
2
Herndon, S. C., Kolb, C. E., Lamb, B., Westberg, H., Allwine, E., Velasco, E., Knighton, B., Zavala, M., Molina, L. T., and Molina, M. J.: Conditional sampling of volatile organic compounds in on-road vehicle plumes, in preparation, 2007.
ACPD
7, 3113–3177, 2007 Overview of MCMA-2003 Campaign L. T. Molina et al. Title Page Abstract Introduction Conclusions References Tables Figures ◭ ◮ ◭ ◮ Back CloseFull Screen / Esc
Printer-friendly Version Interactive Discussion
EGU
4.3 Fixed site emissions measurements
Fixed site long open-path spectroscopic measurements also yielded valuable emission information as they quantified the increases in motor vehicle exhaust species during the morning rush hour or intercepted fixed source plumes as wind changes sampled surrounding sources. Two separate research long-path DOAS instruments supplied by 5
the University of Heidelberg and operated by MIT, one of which was co-aligned with an open-path FTIR from Chalmers, were deployed at the CENICA site (Volkamer et al., 2005a, b). Open-path FTIR and commercial DOAS instruments were operated at La Merced site by UNAM (Grutter et al., 2005). Correlating the build up of morning rush hour pollutant concentrations with rising ambient CO2 allowed estimates of motor ve-10
hicle emissions indices for NO, N2O, NH3, CO, CH4, C2H2, C2H6, C3H8, and HCHO at
La Merced and NO, NO2, N2O, SO2, HCHO, C4H10, and a range of aromatic VOCs at
CENICA (Volkamer et al., 2005a). Agreement between the derived emissions indices estimates for species measured by open path methods at both La Merced and CENICA is generally good, although a significantly higher NO value was obtained at La Merced. 15
Most importantly the mean emissions ratios for nitrogen dioxide, formaldehyde, ben-zene and toluene measured by open path methods at CENICA agreed surprisingly well with the integrated distributions of nearby on-road exhaust plume measurements made with the ARI mobile laboratory. Figure 3 shows measured on-road emissions indices for NOxfrom light-duty gasoline vehicles (Zavala et al., 2006) and CO and VOC
20
emissions from all on-road vehicles (Jiang et al., 2005), both determined by ARI mo-bile laboratory measurements, as well as all vehicle SO2 emissions determined from DOAS measurements of morning rush hour SO2/CO2 concentration growth ratios (de Foy et al., 2007). These are compared to the relevant MCMA EI estimates for 2002 (CAM, 2004).
25
Direct flux measurements of trace species using micro-meteorological eddy covari-ance and disjunct eddy covaricovari-ance techniques are commonly used to characterize natural and agricultural ecosystem fluxes but have seldom been used in urban
envi-ACPD
7, 3113–3177, 2007 Overview of MCMA-2003 Campaign L. T. Molina et al. Title Page Abstract Introduction Conclusions References Tables Figures ◭ ◮ ◭ ◮ Back CloseFull Screen / Esc
Printer-friendly Version Interactive Discussion ronments. The WSU group erected a 25 m scaffold flux tower on the 12 m high rooftop
of the CENICA laboratory to perform what we believe are the first eddy covariance flux measurements of trace gases in a developing world city. Diurnal CO2 fluxes at
CENICA were correlated with traffic activity, with peak mean morning rush hour val-ues approaching 1 mg m−2s−1, the daily mean of 0.41 mg m−2s−1was similar to those
5
observed in U.S. and European cities (Velasco et al., 2005a).
Fluxes of olefins were measured by eddy covariance coupled with a fast-response olefin chemiluminescence sensor (FOS). A PTR-MS from PNNL was used to measure fluxes of acetone, methanol, toluene and C2-benzenes employing the disjunct eddy
covariance technique. VOCs fluxes also showed a clear diurnal pattern strongly corre-10
lated with traffic intensity. The measured VOCs fluxes were compared to the emissions reported by the local model-based gridded 1998 EI for the part of the city near CENICA, finding that emissions fluxes of olefins, toluene and acetone showed good agreement for this part of the MCMA (Velasco et al., 2005b). These comparisons do not support the idea that the VOCs emissions inventory is underestimated by a factor of 3, as it 15
was suggested by previous photochemical model comparisons with measured ozone and nitrogen oxide levels (West et al., 2004), and by analysis of ambient CO and VOC measurements (Arriaga-Colina et al., 2004). Furthermore, examination of data from canister samples of ambient air VOC concentrations, taken at various MCMA urban sites during the morning rush hours (06:00 to 09:00 h) and analyzed by GC-FID, to 20
determine the relative distribution of lumped modeling VOC classes also did not sup-port a high level of underestimation compared to the emissions inventory for all VOC classes. This comparison suggested that some, but not all, VOC classes are underes-timated in the emissions inventory by factors of 1.1 to 3; specifically, it suggests that the model-based 1998 EI (CAM, 2001) underestimates the contribution of some alka-25
nes and overestimates the contributions of some olefins and aromatics (Velasco et al., 2007).
Information on the morning and midday vertical distributions of selected VOCs up to 200 m was obtained from gas chromatographic analysis of tethered balloon
ACPD
7, 3113–3177, 2007 Overview of MCMA-2003 Campaign L. T. Molina et al. Title Page Abstract Introduction Conclusions References Tables Figures ◭ ◮ ◭ ◮ Back CloseFull Screen / Esc
Printer-friendly Version Interactive Discussion
EGU
canister samples obtained on seven days at the CENICA site during MCMA 2003 (W ¨ohnschimmel et al., 2006). Chemical mass balance and linear unmixing receptor modeling identified liquefied petroleum gas and gasoline vehicle exhaust as the major sources of the measured VOCs.
4.4 Aldehyde emissions versus photochemical production 5
One of the key emission issues identified as a MCMA-2003 project goal in Section 2.2 and addressed by a variety of measurements involves the sources of atmospheric formaldehyde and, to a lesser extent, acetaldehyde (CH3CHO), in the MCMA atmo-sphere. Baez et al. (1995) noted very high ambient MCMA levels of formaldehyde and acetaldehyde with both peaking in the morning hours. Very high 2002 and 2003 down-10
town HCHO levels that also peak in mid-morning, have been documented by Grutter et al. (2005). Schifter et al. (2000) estimated moderate emissions of both aldehydes from MCMA gasoline powered vehicles. However, initial MCMA-2002 ARI mobile labo-ratory measurements of on-road formaldehyde emission ratios revealed very high ex-haust HCHO concentrations, with HCHO emission ratios to excess CO2approximately
15
eight times higher than those encountered in Boston’s on-road fleet (Kolb et al., 2004). These high HCHO emission levels along with high CH3CHO ratios were confirmed by the much more extensive MCMA-2003 on-road measurements reported in Zavala et al. (2006), who estimated total on-road MCMA HCHO emissions of over 7 times and CH3CHO emissions over 4 times higher than those suggested by Schifter et al. (2000).
20
It is highly probable that high morning rush hour on-road emissions of these pho-tolytic radical sources play a key role in initiating the vigorous morning photochemistry that characterizes the MCMA atmosphere documented by Shirley et al. (2006). Cor-relations of the 2003 CENICA DOAS and mobile laboratory TILDAS HCHO measure-ments with the exhaust marker CO and the photochemical markers CHOCHO and O3
25
were used to estimate ambient HCHO levels due to emission and photochemical pro-duction (Garcia et al., 2006). These analyses indicate that averaged over the day about 40% of ambient HCHO can be attributed to exhaust emissions. The emission source
ACPD
7, 3113–3177, 2007 Overview of MCMA-2003 Campaign L. T. Molina et al. Title Page Abstract Introduction Conclusions References Tables Figures ◭ ◮ ◭ ◮ Back CloseFull Screen / Esc
Printer-friendly Version Interactive Discussion is dominant in the early morning, evening and at night, while the photochemical source
becomes dominant later in the morning and produces about 80% of the ambient HCHO in the four hours around noon.
5 Measurements of MCMA volatile organic compounds
A significant aspect of the MCMA-2003 field campaign was the effort to apply a num-5
ber of independent methods to measure ambient concentrations of VOCs at various locations within the Valley of Mexico. The use of different techniques allowed a wide range of individual species to be measured over different spatial and temporal scales, providing confidence in the data, as well as a basis for comparison with grid model simulations of selected VOCs. The VOC concentrations were analyzed to understand 10
better their distribution, diurnal pattern, origin and reactivity in the atmosphere of the MCMA. Also, as discussed above in Sect. 4, these VOC data were used to evaluate indirectly the local emissions inventory and, as discussed below in Sect. 6, to provide information to analyze the production of photochemical oxidants.
5.1 VOC measurement methods 15
VOC measurement methods included both standard and new techniques. For example, three-hour averaged canister sampling coupled with gas chromatography/flame ioniza-tion detecioniza-tion (GC/FID) or gas chromatography/mass spectrometry (GC/MS) was used to measure the time-averaged concentrations of individual hydrocarbons at a num-ber of fixed sites on a daily basis throughout the campaign. More than 180 samples 20
were collected in this manner from four different commercial/residential locations, three boundary sites in rural areas and one highly industrial section of the city (Velasco et al., 2007). These time-averaged data were complemented by continuous, high time resolution measurements of aromatic and oxygenated VOCs using two PTR-MS in-struments. One PTR-MS operated in a fixed mode at the CENICA site (Jobson et al.,
ACPD
7, 3113–3177, 2007 Overview of MCMA-2003 Campaign L. T. Molina et al. Title Page Abstract Introduction Conclusions References Tables Figures ◭ ◮ ◭ ◮ Back CloseFull Screen / Esc
Printer-friendly Version Interactive Discussion
EGU
20073) and the other in both fixed site and mobile modes on-board the ARI mobile lab-oratory (Rogers et al., 2006). The PTR-MS operated in mobile mode in the ARI mobile lab was used to determine on-road vehicle emissions as well as to measure ambient concentrations (Rogers et al., 2006; Zavala et al., 2006; Velasco et al., 2007).
A measure of total olefin concentrations was obtained using a fast-response olefin 5
chemiluminescence sensor (FOS) deployed at the CENICA site. As detailed in Sect. 4.3, the PTR-MS and FOS at the CENICA site provided both ambient VOC data as well as the first ever VOC eddy covariance flux data for an urban area (Velasco et al., 2005b). A unique perspective was provided by open-path DOASs operated at the CENICA and at La Merced sites. These instruments measured a number of specific 10
VOC with very high time resolution, averaged over long path lengths (860 m at CENICA and 426 m at La Merced) (Volkamer et al., 2005; Velasco et al., 2007). Intercomparison of all of these techniques was valuable for confirming the accuracy of each method and also to help identify the occurrence of short-term, highly fluctuating plumes of VOCs, which could be attributed to various small but intense point sources versus the occur-15
rence of slowly varying levels of VOCs attributed to the mix of urban VOCs. Finally, an open-path FTIR system operated by UNAM (Grutter et al., 2005) obtained ambient concentration measurements for formaldehyde and a number of light alkanes.
5.2 Key VOC results
Results from these various VOC measurement methods provided the following key 20
findings for VOCs in MCMA:
– Total non-methane hydrocarbon concentrations from urban sites during the
morn-ing rush hour period (06:00–09:00 h) averaged approximately 1.5 ppmC.
3
Jobson, B. T., Alexander, L., Prazeller, P., Berkowitz, C. M., Westberg, H., Velasco, E., Allwine, E., Lamb, B., Volkamer, R., Molina, L. T., and Molina, M. J.: Intercomparison of volatile organic carbon measurements techniques and data from the MCMA 2003 field experiment, in preparation, 2007.
ACPD
7, 3113–3177, 2007 Overview of MCMA-2003 Campaign L. T. Molina et al. Title Page Abstract Introduction Conclusions References Tables Figures ◭ ◮ ◭ ◮ Back CloseFull Screen / Esc
Printer-friendly Version Interactive Discussion
– The non-methane hydrocarbon burden in MCMA was dominated by alkanes
(60%), followed by aromatics (15%) and olefins (5%), based on ppbC. The re-maining 20% were a mix of alkynes, halogenated hydrocarbons, oxygenated species, and other unidentified species (see Fig. 4). This distribution is simi-lar to that reported in earlier studies (Arriaga et al., 1997; Mugica et al., 2002), 5
although it appears that the levels were slightly lower than in previous measure-ments, which may indicate that actions to control VOC emissions have been suc-cessful, despite the growth in the vehicular fleet and other activities (Velasco et al., 2007).
– Although differences were apparent among the different methods, these could
10
be attributed to the different measurement perspectives (i.e., point vs. long-path, time-averaged vs. short term) and, in general, there was good agreement among the different methods employed to measure VOCs.
– In terms of compound concentrations weighted by OH reactivity, the top five
species were ethylene, propylene, propane, n-butane and m, p-xylene, while C4-15
C5 alkenes and toluene comprised the next five most reactive species in MCMA (Velasco et al., 2007).
– Elevated levels of toxic VOCs, including formaldehyde, acetaldehyde,
1,3-butadiene and the BTEX compounds (benzene, toluene, ethylbenzene and the xylene isomers), were frequently measured.
20
– Comparison of the morning ambient levels with the distribution of VOC species in
a model-based 1998 EI suggested that the inventory under-estimates the contri-bution of some alkanes and over-estimates the contricontri-bution of some olefins and aromatics (Velasco et al., 2007).
– The VOC eddy covariance flux measurements provided new and valuable
infor-25
ACPD
7, 3113–3177, 2007 Overview of MCMA-2003 Campaign L. T. Molina et al. Title Page Abstract Introduction Conclusions References Tables Figures ◭ ◮ ◭ ◮ Back CloseFull Screen / Esc
Printer-friendly Version Interactive Discussion
EGU
acetone showed good agreement with the local model-based gridded 1998 EI (Velasco et al., 2005b).
– At the urban core, the ambient concentrations of VOCs depended strongly on the
interaction of vehicular traffic and meteorological parameters. Weekly averages of the diurnal pattern of olefinic and aromatic VOC ambient concentrations exhibited 5
a strong peak during the morning rush hour with relatively low levels during the afternoon and evening.
– Comparisons between the ambient samples and the on-road samples showed
that vehicle exhaust is the main source of many hydrocarbons, in particular, olefins and aromatics (Velasco et al., 2007).
10
– Glyoxal was successfully measured for the first time using a long-path DOAS
in-strument (Volkamer et al., 2005b). Results were used with CO measurements as an emission tracer to help assign sources of formaldehyde; these data indicated that primary emissions contribute ∼42%, photochemical formation accounts for ∼38%,
15
6 MCMA photochemistry
The measurement suite deployed during MCMA-2003 enabled the most comprehen-sive study of the photochemistry in MCMA, or for that matter, any megacity in the developing world. In addition to the important distributed measurements of NOx,
VOCs, ozone, and aerosols, measurements were also made of radicals precursors 20
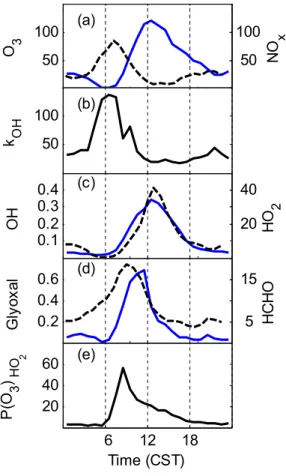
like formaldehyde, the radicals hydroxyl (OH), hydroperoxyl (HO2), the oxidation inter-mediate glyoxal (CHOCHO), and the OH reactivity, the inverse of the OH lifetime (see Figs. 5 and 6). The most complete co-located measurement suite, including radical measurements, was at CENICA supersite; thus most of the following photochemistry discussion is based on analyses of the measurements at CENICA.
ACPD
7, 3113–3177, 2007 Overview of MCMA-2003 Campaign L. T. Molina et al. Title Page Abstract Introduction Conclusions References Tables Figures ◭ ◮ ◭ ◮ Back CloseFull Screen / Esc
Printer-friendly Version Interactive Discussion 6.1 Photochemical precursors
The production of ozone and secondary organic aerosols (SOA) requires the presence of NOx, VOCs, and sunlight. The median NOx was 86 ppbv during morning rush hour,
although it exceeded 100 ppbv on several days. In the afternoon, NOx was about 20 ppbv; at night, it was typically 20–35 ppbv. In the morning (06:00 to 09:00 h) the 5
average VOC concentration at urban sites was 1515 ppbC, 2.3 times higher than in the afternoon (Velasco et al., 2007). Compared to U.S. cities, these NOx concentrations were about 2 times larger and the VOCs were 5 to 10 times larger (Shirley et al., 2006). On average alkanes, alkenes, aromatics and aldehydes all contribute significantly to the OH reactivity (Lei et al., 2007). The measured OH reactivity had a large peak of 10
∼120 s−1 during morning rush hour, 25 s−1 during midday, and ∼35 s−1 at night. This diurnal behavior is similar to that of NOx, which is consistent with a large
transporta-tion source of both OH reactivity and NOx. Of the calculated contributions to the OH reactivity, 12% was due to NOx, 7% to CO, 4% to HCHO and 72% to VOCs (Shirley et
al., 2006). These gaseous emissions within MCMA are sufficient to produce the large 15
observed abundances of ozone, SOAs, and other pollutants. Measured MCMA OH reactivity is dramatically higher than those of typical U.S. cities, especially during the morning hours (Fig. 6).
High solar ultraviolet radiation fluxes, due to the MCMA’s high altitude and low lati-tude, drive rapid photolysis, even in April. Typically April has been one of the MCMA’s 20
most polluted months, with high levels of all photochemically produced pollutants. In 2003, however, the unusually high humidity led to clouds and occasionally rain in the afternoon. This afternoon cloudiness often shut down the vigorous photochemistry, resulting in lower production of ozone and other secondary pollutants compared to other years. As a result, the median MCMA O3peaked at 115 ppbv near local noon at
25
CENICA and never exceeded 150 ppbv. Other locales in the city experienced higher levels of ozone, but none exceeded 250 ppbv. These O3 abundances are lower than
ACPD
7, 3113–3177, 2007 Overview of MCMA-2003 Campaign L. T. Molina et al. Title Page Abstract Introduction Conclusions References Tables Figures ◭ ◮ ◭ ◮ Back CloseFull Screen / Esc
Printer-friendly Version Interactive Discussion
EGU
the atypical cloudiness of April, the rest is likely due to efforts to reduce VOC emissions in the MCMA (Velasco et al., 2007).
6.2 HOxproduction
The radicals OH and HO2 displayed, as expected, strong diurnal behavior (Fig. 5).
OH and HO2together are called HOx, of which HO2is the dominant partner. OH was 5
fairly consistent from day-to-day, with midday peak values of 0.25–0.4 pptv ((5–8) × 106cm−3
). The effects of clouds on OH production could be seen in the reduction in OH on several afternoons. Variability was greater for HO2than for OH. Peak HO2 var-ied from 15 pptv (∼3×108cm−3) to 60 pptv (∼12×108cm−3). The diurnal HO
2 peak is
narrower than the OH peak and is shifted one hour later. HO2 persisted at ∼5 pptv
10
(0.5 to 20 pptv) during the night. HO2 has a diurnal profile that peaked at ∼40 pptv
at 13:00, and decreased to less than 0.5 pptv at sunrise, when HOx production was just beginning to increase but when copious rush hour NO effectively scavenged HO2.
The median OH peaks at 0.35 pptv (∼7×10⁶) cm−3 at local noon. The nighttime
val-ues ranged from 0.05 pptv (∼1x106 cm−3) to below the detection limit (0.01 pptv or
15
2×105cm−3). The median HO
2 peaks at 37.2 pptv and falls off rapidly to less than a
few pptv at night, with a minimum at morning rush hour, when NO is rapidly converting HO2to OH and NO2is rapidly converting OH to HNO3.
These MCMA HOxmeasurements are a good example of the buffering effects of the
OH production and loss processes. Over the course of the study, HO2 peak values
20
varied greatly from day-to-day, indicating dramatic changes in HOx sources, but OH peak values remained relatively unchanged. That HO2is much more sensitive to HOx
sources and sinks than OH suggests that HO2 must be measured along with OH to
really test and understand the radical chemistry. As a result, the OH abundances in MCMA are similar to those in U.S. and European cities, while the HO2 is larger by a 25
ACPD
7, 3113–3177, 2007 Overview of MCMA-2003 Campaign L. T. Molina et al. Title Page Abstract Introduction Conclusions References Tables Figures ◭ ◮ ◭ ◮ Back CloseFull Screen / Esc
Printer-friendly Version Interactive Discussion In a set of companion papers, Volkamer et al. (2007)4and Sheehy et al. (2007)5use
measurements of radical sources (i.e., HONO, HCHO, O3, J-values) and sinks (i.e.,
VOC, NO, NO2) to constrain the Master Chemical Mechanism to study the oxidative capacity of the atmosphere in terms of radical production and radical cycling. In Part 1, Volkamer et al. (2007)4 present a detailed analysis of OH, HO2 and RO2 radical
5
sources, which identifies the processing of alkenes as playing a major role in driving photochemical smog formation. In comparison to other urban airsheds, differences are identified in terms of the timing and magnitude of radical production. In Part 2, Sheehy et al. (2007)5 compare modeled concentrations of HOx to measurements by Shirley et al. (2006), and discuss the implications of observed differences in terms of VOC 10
oxidation and ozone formation.
6.3 Carbonyl precursors and products
The large difference in HO2 results in part from the large difference in the HOxx
sources. Some of this difference is due to the greater photolysis frequencies, al-though the photolysis frequencies in MCMA are less than a factor of two larger than in 15
U.S. cities during their peak ozone months. Ozone, which was greater in MCMA than in U.S. cities, contributes to the larger HOx sources in MCMA. However, a big
differ-ence was the greater amount of HCHO in MCMA. It peaks at ∼20 ppbv in the morning (Volkamer et al., 2005b), represents about 40% of the HOx source, and was much larger in MCMA than in US cities during midday. An important question is the relative 20
importance of the two HCHO sources: direct emission and photochemical production in the atmosphere (Garcia et al., 2006). During the midday, photochemical production appears to be 80% of the ambient HCHO, while at night and in the early morning,
4
Volkamer, R. M., Sheehy, P. M., Molina, L. T., and Molina, M. J.: Oxidative Capacity of the Mexico City Atmosphere. Part 1: A radical source perspective, in preparation, 2007.
5