Publisher’s version / Version de l'éditeur:
Proceedings 18th International Conference on Port and Ocean Engineering under Arctic Conditions, POAC'05, 1, pp. 353-363, 2005
READ THESE TERMS AND CONDITIONS CAREFULLY BEFORE USING THIS WEBSITE. https://nrc-publications.canada.ca/eng/copyright
Vous avez des questions? Nous pouvons vous aider. Pour communiquer directement avec un auteur, consultez la
première page de la revue dans laquelle son article a été publié afin de trouver ses coordonnées. Si vous n’arrivez pas à les repérer, communiquez avec nous à PublicationsArchive-ArchivesPublications@nrc-cnrc.gc.ca.
Questions? Contact the NRC Publications Archive team at
PublicationsArchive-ArchivesPublications@nrc-cnrc.gc.ca. If you wish to email the authors directly, please see the first page of the publication for their contact information.
NRC Publications Archive
Archives des publications du CNRC
This publication could be one of several versions: author’s original, accepted manuscript or the publisher’s version. / La version de cette publication peut être l’une des suivantes : la version prépublication de l’auteur, la version acceptée du manuscrit ou la version de l’éditeur.
Access and use of this website and the material on it are subject to the Terms and Conditions set forth at
Local Ice Pressures on the ODEN 1991 Polar Voyage.
Frederking, Robert
https://publications-cnrc.canada.ca/fra/droits
L’accès à ce site Web et l’utilisation de son contenu sont assujettis aux conditions présentées dans le site
LISEZ CES CONDITIONS ATTENTIVEMENT AVANT D’UTILISER CE SITE WEB.
NRC Publications Record / Notice d'Archives des publications de CNRC: https://nrc-publications.canada.ca/eng/view/object/?id=eca7a0d4-021d-4633-b4d2-b1c2d69d4f67 https://publications-cnrc.canada.ca/fra/voir/objet/?id=eca7a0d4-021d-4633-b4d2-b1c2d69d4f67
Proceedings 18th International Conference on Port and Ocean Engineering under Arctic Conditions, POAC’05
Vol.1, pp 353-363, Potsdam, NY, USA, 2005.
LOCAL ICE PRESSURES ON THE ODEN 1991 POLAR VOYAGE
R. Frederking
Canadian Hydraulics Centre National Research Council of Canada
Ottawa, ON, K1A 0R6, Canada
ABSTRACT
In 1991 the ODEN made a voyage to the North Pole. An area in the starboard bow of the ship was instrumented with strain gauges to measure local ice pressures. The ship encountered various ice conditions in its voyage, and whenever a threshold strain was exceeded, a 6 to 12 second-long “event” record of strains was made. Based on a finite element analysis of the ship structure the strains were converted to average ice
pressures on a 40-sub-panel area, 10 frames wide (8.5 m) by 4 panels high (3.52 m). The bow is a “landing-craft-form”, sloped 22o from the horizontal. There were 784 events and for each of them average pressures on various area and shapes were determined and related to ship speed and ice conditions. A means of predicting probable ice pressures as a function of a “design” area and exposure is presented.
INTRODUCTION
A number of field studies have been carried out to measure local ice pressures from ships transiting sea ice; for example USCGC Polar Sea (St. John and Daley, 1984 and the CCGS Louis S. St. Laurent (Ritch et al., 1999). These and other such transits in which hull structure was instrumented to measure local and global ice impact forces, together with regular observations of ice conditions, have been an important factor in advancing knowledge of ice loading. The ODEN was involved in two voyages to the North Pole, one in 1991 and another in 1996. This paper focuses on local ice
pressures measured in 1991. To provide a broader context for this work, a brief review of pressure area issues will be given here. There are two fundamentally different types of pressure-area relations, and local ice pressures are involved in both. One relation describes the change in global average pressure as a function area during an impact, for example a ship ramming a large ice feature (Riska, 1987). The area is a
nominal contact area defined from the geometry of the bow of the ship, shape of the ice feature and penetration of the ship into the ice. This has been termed a process pressure-area relation by Frederking (1998). The other pressure-pressure-area relation describes the local
average pressure on sub-areas of various sizes within a larger area at an instant in time
during an impact. Jordaan et al. (1993) described this type of pressure-area relation as average pressures on local areas within a global area. Another way of describing this local ice pressure is the average pressure on a design area since for design purposes an average maximum pressure during an event, such as a ram or glancing impact, on predetermined areas is what is required. In this paper the nature of the pressure distribution, and the effect of ship speed and ice conditions on average local ice pressure will be presented.
BACKGROUND
The Oden made a voyage to and from the North Pole in 1991, August 1 - October 5. One of the purposes of this voyage was to collect ship performance data and ice navigation information. This activity was carried out for the Swedish, Canadian and United States Coast Guards. The hull structure was instrumented and ice observers were on board. The ship entered the ice north of Spitsbergen and followed a generally northeasterly route to 88oN – 90oE, and then transited along 88oN to 170oE before turning to the North Pole on September 8. The return roughly followed the 0o meridian south to 84oN and then towards Spitsbergen. The Oden was in the polar pack for 50 days and was in active transit for 515 hours, covering a distance of 2172 nautical miles. The vessel made a number of scientific station stops, which explains the difference between the number of days in ice and the number of active hours of ice transiting. The ODEN incorporated a number of novel features; however in the context of this study the most significant one was the wide, low stem angle, landing craft bow form. The width of the flat portion of the bow is 17 m, the overall width is 29.5 m and the stem angle is 22o. With this shallow stem angle the impact velocity normal to the bow is only about 1/3 of the ship forward velocity.
INSTRUMENTION
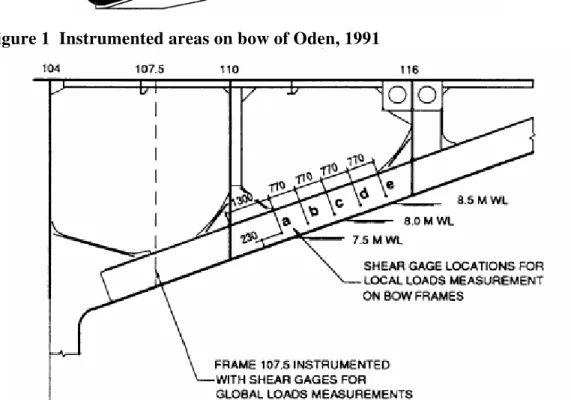
The Oden was instrumented to measure both global and local hull forces and machinery loads, but only local ice pressures are treated in this paper. For the 1991 voyage two areas were instrumented on the bow (Edgecombe et al 1992) as shown in Figure 1. The outer dimensions of the instrumented area were 8.5 m in the transverse direction and 3.08 m in the longitudinal direction. Three bow frames in the central area and five towards the shoulder were instrumented with shear strain gauges spaced 770 mm apart, see Figure 2. A finite element analysis was carried out (St. John and Minnick, 1993) to develop a relation to use the shear strain difference between two shear gauges to yield the force on the frame between the two gauges. With five gauges, forces over four levels on the frame could be determined. Frame spacing was 850 mm so the minimum sub-panel area over which force could be resolved was 0.65
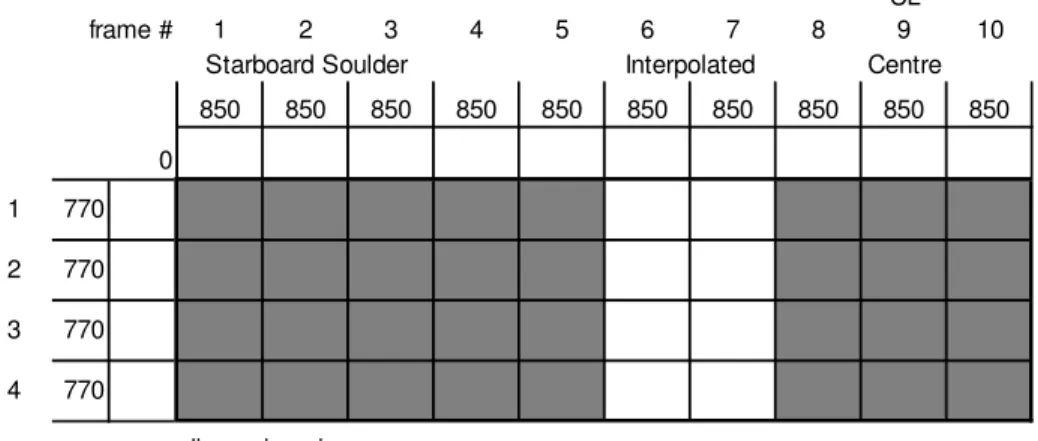
m2. The active measurement areas covered one 3 by 4 group of sub-panels on the centre-line and another 5 by 4 group towards the starboard shoulder (see Figure 3). Two frames between the two groups were not instrumented, however a linear
interpolation technique (St. John and Minnick, 1993) was used to obtain ice forces on these frames. Note the shallow stem angle of only 22o, and that the forces measured are normal to the bow surface. While not the subject of this paper, the low stem angle does not lead to lower ice pressures compared to a conventional bow (Frederking, 2000). Data from the strain gauges were recorded at 50 Hz. The record length was generally 6 seconds, however lengths of 7, 8 and 12 seconds were also used. The data acquisition system had a pre-trigger feature that saved 2 seconds of the record length before the trigger was activated. The system was triggered when a strain threshold was exceeded.
Figure 1 Instrumented areas on bow of Oden, 1991
CL
frame # 1 2 3 4 5 6 7 8 9 10
Starboard Soulder Centre
850 850 850 850 850 850 850 850 850 850 0 1 770 2 770 3 770 4 770 dimensions in mm Interpolated
Figure 3 Sub-panel locations on bow of ODEN in 1991 GENERAL DESCRIPTION OF ICE CONDITIONS
For the 1991 voyage, hourly ice observations were taken visually and logged
manually. These observations form the basis of the general ice conditions description, as well as the ice conditions and ship operations in relation to impact events. Once inside the polar pack, ice coverage was generally 9/10ths and often 9+/10ths. There were extensive networks of cracks and leads, varying in width from 100s of meters to less than the beam of the ship, at all latitudes right up to the North Pole. The average thickness of the floes transited was 2 to 2.5 m, but some floes contained ridged sections having a maximum thickness of 5 to 10 m. There were some melt ponds on the surface of floes noted on the outbound leg of the voyage (August), but they became more scarce as the ship approached the pole and as the season advanced.
SAMPLE TEST DATA
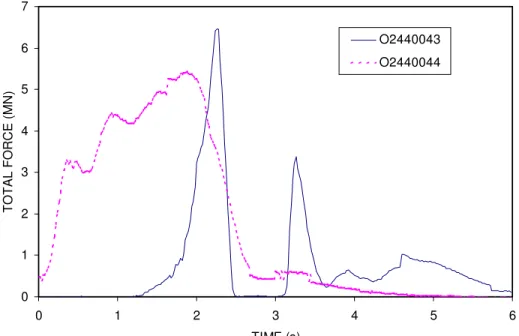
To provide an appreciation of the ice pressure data collected, firstly a time series plot of total forces from two impacts just one minute apart will be presented. Figure 4 plots the total force on the instrumented area for two impact events when the ship was travelling through 9 10ths ice concentration (7 10ths old ice) of average thickness 2 m and maximum thickness 3 m at a velocity of 0.04 m/s for the first impact and 0.03 m/s for the second. The nature of the two impacts is quite different; one is about half a second long and the other about 3 s long. Impact durations are variable, but generally fall within this range.
0 1 2 3 4 5 6 7 0 1 2 3 4 5 6 TIME (s) TOTAL FORCE (MN) O2440043 O2440044
Figure 4 Total force on instrumented area for two impacts of ODEN
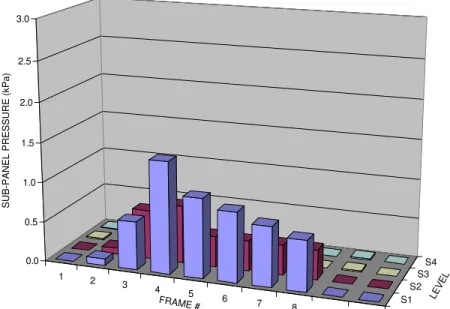
The next point to examine is the spatial distribution of pressures at the time of
maximum force. These distributions are illustrated in Figures 5 and 6. The maximum force for both impacts was quite similar, but the local pressure distributions were different. For impact O2440043 the maximum local pressure was almost 3 MPa and the highest pressures were localized on about 8 sub-panels. Impact O2440044 had a lower maximum local pressure, less than 1.5 MPa, but the highest pressures were distributed across about 12 sub-panels.
1 2 3 4 5 6 7 8 9 10 S1 S2 S3 S4 0.0 0.5 1.0 1.5 2.0 2.5 3.0
SUB-PANEL PRESSURE (kPa)
FRAME # LE
VE L
1 2 3 4 5 6 7 8 9 10 S1 S2 S3 S4 0.0 0.5 1.0 1.5 2.0 2.5 3.0
SUB-PANEL PRESSURE (kPa)
FRAME # LE
VE L
Figure 6 Pressure distribution at time 1.90 s for impact O2440044
The final point to examine is the time series of local pressure on a single sub-panel. Figure 7 plots the pressure on the sub-panel at Frame 2 Level 2, the highest single panel pressure in impact O2440043 (see Figure 5). The maximum single sub-panel pressure, regardless of where it is, is also plotted in Figure 7. It can be seen that the maximum single sub-panel pressure is not always at the same location during an impact. For this impact the maximum pressure on a single sub-panel was 2.7 MPa at time 2.28 s. Time series plots of average pressure on other areas and shapes were produced and the highest value of each of them during the event determined. It is all these maximum values that are used in further analysis.
0 0.5 1 1.5 2 2.5 3 0 1 2 3 4 5 6 TIME (s) AVERAGE SUB-PANEL PRESSURE ( M
Pa) FRAME 2 LEVEL 2
max
Figure 7 Pressure on one selected sub-panel (FRAME 2 LEVEL 2) and
maximum pressure on any single sub-panel in instrumented area for event O2440043
SHIP OPERATIONS
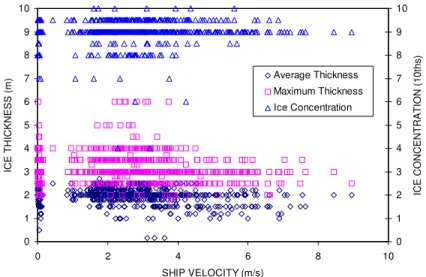
Ship operations were examined to see if there were any significant trends. Because good ice information was available, ship velocity as a function of average and maximum ice thickness as well as total ice concentration were plotted in Figure 8. There are no strong trends, and the only one visible is ship velocity less than 4 m/s when maximum ice thickness is greater than 4 m.
0 1 2 3 4 5 6 7 8 9 10 0 2 4 6 8 10 SHIP VELOCITY (m/s) ICE THICKNESS (m) 0 1 2 3 4 5 6 7 8 9 10 ICE CONCENTRATION (1 0 th s ) Average Thickness Maximum Thickness Ice Concentration
Figure 8 Relation between ice thickness and total ice concentration and ship velocity
DETERMINATION OF ICE PRESSURE DISTRIBUTIONS
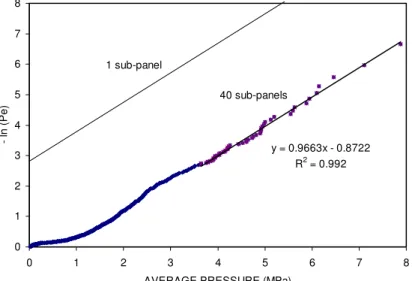
During the 1991 voyage there were 784 events triggered on the bow. For each of these events there were average ice pressures on the 40 areas and shapes possible, as well as information on ice conditions and ship operation. As an initial example, the extreme values of average pressure on a single sub-panel were arranged in descending order and plotted using the following plotting position
pe = i/(n+1) (1)
where i is the ith ranked data point and n is the total number of data points. The ranked pressure data were plotted versus –ln(pe ) in Figure 9. In design, one is interested in the extreme values, so a expression is fit just through the tail of the distribution, in this case pressures greater that 2.7 MPa. A straight-line was fit to the higher pressures using least squares. The best-fit line on the log-linear plots has the form
y = m x + b (2)
pe = exp[-(x-xo)/α] (3) where y = -ln(pe), xo is the intercept with the x-axis and α is the inverse of the slope of the line, m. y = 0.9663x - 0.8722 R2 = 0.992 0 1 2 3 4 5 6 7 8 0 1 2 3 4 5 6 7 8
AVERAGE PRESSURE (MPa)
- ln (Pe)
40 sub-panels 1 sub-panel
Figure 9 Probability of average pressure on a "design” area of 0.65 m2 (0.85 m wide by 0.77 m high) on the ODEN, 784 events on 1991 North Pole voyage
Exposure has to be taken into account before these data can be used to make estimates of extreme loads. The first aspect of exposure relates to the number of sub-panels in the areas used in the data compilation. In the case of a single sub-panel, pressures on 40 sub-panels were available. The probability of any one of these sub-panels
experiencing a maximum pressure is less than that for the 40 sub-panels. The probability is thus reduced by ln(40), or 3.7. The probability of exceedance of
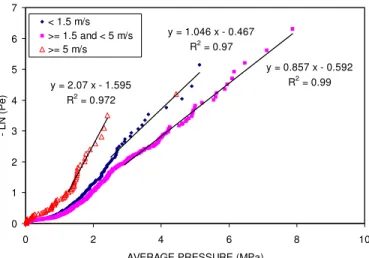
average pressure on a single sub-panel is also plotted on Figure 9. The other aspect of exposure is the number of events or peak loads in a given time period or distance traveled. The ship can be assumed to be a device for measuring local ice pressures, however, the actual pressures measured are possibly a function of ice thickness and ship speed. Because ship speed and ice thickness data are available for each event, these effects on the maximum average pressure on a single panels has been examined. Figure 10 plots the average pressure as a function of three speed categories. It can be seen that the highest pressures are for velocities in the range 1.5 to 5 m/s. The lowest pressures are for velocities greater than 5 m/s, suggesting that when ice conditions are less severe the ship travels faster. At low speeds, less than 1.5 m/s, the ship is
probably proceeding cautiously through thicker ice or ridges and pressures are less that those at higher speeds, but greater than those at high speeds (greater than 5 m/s). Figure 11 compares the pressure for ice thicker than 3 m and that thinner than 3 m. Pressures are higher for the thicker ice, as expected, however the distribution is not well described by a log-linear expression.
y = 0.857 x - 0.592 R2 = 0.99 y = 1.046 x - 0.467 R2 = 0.97 y = 2.07 x - 1.595 R2 = 0.972 0 1 2 3 4 5 6 7 0 2 4 6 8 10
AVERAGE PRESSURE (MPa)
- LN (Pe)
< 1.5 m/s >= 1.5 and < 5 m/s >= 5 m/s
Figure 10 Probability of average pressure on a "design” area of 0.65 m2 as a function of ship speed, ODEN 1991 North Pole voyage
y = 0.70 x + 0.139 R2 = 0.99 y = 0.98 x - 0.428 R2 = 0.95 0 1 2 3 4 5 6 7 0 2 4 6 8 10
AVERAGE PRESSURE (MPa)
- ln
(Pe
)
3 m and less >3 and 6 or less
Figure 11 Probability of average pressure on a "design” area of 0.65 m2 as a function of ice thickness, ODEN 1991 North Pole voyage
It will be assumed that impacts will be the measure of exposure. Over the 515 hours of transit, 784 impacts were recorded on the bow, or a rate of 1.5 events per hour of transit in polar ice. A ship such as the ODEN might be expected to be under transit about 1000 hours annually, and thus the number of events expected annually is 1500. It should also be noted that other ships having different mission profiles might expect more or fewer events annually.
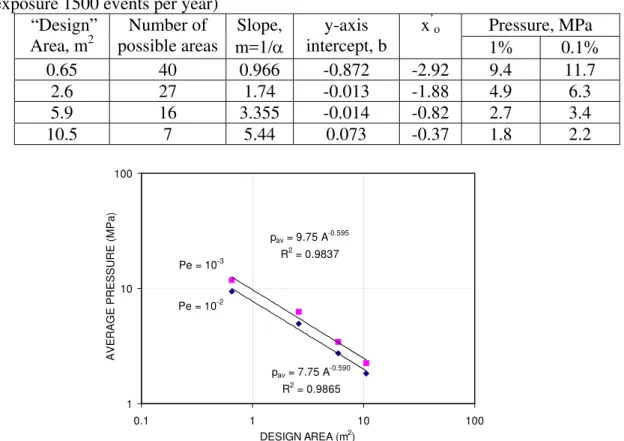
The influence of “design” area on average pressure was investigated to determine a pressure-“design” area relation. Data from four areas with an aspect ratio of about 1 were extracted. The average pressure data from each area were ranked and plotted using the Weibull plotting position as in Figure 9. The “design” area, number of possible areas, slope m, and y-axis intercept b, are listed in Table 1. The x-axis
Using the approach outlined in Jordaan et al (1993) the 1% and 0.1 % annual local ice pressure exceedance is given by
z0.01 = x’o + α {4.6 + ln (n)} (4) z0.001 = x’o + α {6.9 + ln (n)} (5) respectively, where n is the annual exposure in number of events. Values of average
pressure as a function of “design” area can be determined at these selected probability levels, see Table 1. The average ice pressures, pav,, as a function of “design” area, A, for the two probability levels are plotted in Figure 12, and described by the
expressions
pav = 7.8 A-0.6 (Pe = 10-2) (6) pav = 9.8 A-0.6 (Pe = 10-3) (7) Table 1 Predicted local ice pressures for 1% and 0.1% probability annual exceedance (exposure 1500 events per year)
Pressure, MPa “Design” Area, m2 Number of possible areas Slope, m=1/α intercept, b y-axis x’o 1% 0.1% 0.65 40 0.966 -0.872 -2.92 9.4 11.7 2.6 27 1.74 -0.013 -1.88 4.9 6.3 5.9 16 3.355 -0.014 -0.82 2.7 3.4 10.5 7 5.44 0.073 -0.37 1.8 2.2 pav = 7.75 A -0.590 R2 = 0.9865 pav = 9.75 A -0.595 R2 = 0.9837 1 10 100 0.1 1 10 100 DESIGN AREA (m2) AVER AGE PR ESSU R E (MPa ) Pe = 10-3 Pe = 10-2
Fig. 12 Probability of average ice pressure on a various "design” areas SUMMARY
A procedure for determining probabilistic local ice pressures has been applied to measurements made during then 1991 Polar voyage of the ODEN. The results show a significant relation between ship speed and local ice pressures, with lower pressures
for speeds less than 1.5 m/s and grater than 5 m/s, this may reflect the skill of the captain in navigating in ice, rather than an intrinsic relation. Higher pressures were observed for thicker ice. Combining local ice pressures for all ship speeds and ice thicknesses, local ice pressure as a function of “design” area has a form pav = k A-0.6, where k is a function of the operational profile of the ship, number of events per year and the annul probability of exceedance acceptable.
ACKNOWLEDGEMENTS
The author would like to acknowledge the financial support of the Program of Energy Research and Development (PERD) and Transport Canada in providing the data. The assistance of Anne Collins, NRC-CHC Technical Officer, in extracting and organizing the local ice pressure data is much appreciated.
REFERENCES
Edgecombe, M., St. John, J., Liljestrom, G. and Ritch, R., 1992. Full scale
measurements on hull-ice impact loads and propulsion machinery response onboard icebreaker Oden during the 1991 International Arctic Ocean Experiment, Transport Canada Report TP 11252E, by MetriComp Systems, March 1992.
Frederking, R., 1998. The pressure area relation in the definition of ice forces, 8th Int. Offshore and Polar Engineering Conference, May 24-29, 1998, Montreal, Vol. II, pp. 431-437.
Frederking, R., 2000. Local Ice Pressures from the Louis S. St. Laurent 1994 North Pole Transit, National Research Council Canadian Hydraulics Centre Technical Report HYD-TR-054, Ottawa, May 2000
Jordaan, I.J., Maes, M.A., Brown, P.W., and Hermans, I.P., 1993. Probabilistic analysis of local ice pressures. Proceedings, 11th International Conference on Offshore Mechanics and Arctic Engineering, Calgary, AB, Vol. II, pp. 7-13. Riska, K., 1987. On the mechanics of the ramming interaction between a ship and a
massive ice floe, Thesis for degree of Doctor of Technology, Technical Research Centre of Finland, Publication 43, Espoo, Finland.
Ritch, R., St. John, J., Browne, R., and Sheinberg, R., 1999. Ice load impact measurements on the CCGS Louis S. St. Laurent during the 1994 Arctic Ocean crossing, Proceedings of the 18th International Conference on Offshore Mechanics and Arctic Engineering, July 11-16, 1999, St. John’s Newfoundland, paper
OMAE99/P&A-1141.
St. John, J. and Daley, C., 1984: Shipboard Measurement of Ice Pressures in the Bering, Chukchi, and Beaufort Seas. Third International Offshore Mechanics and
Arctic Engineering Symposium, Volume III, ASME, New Orleans, LA.
St. John, J. and Minnick, P., 1993. Swedish icebreaker Oden ice impact load
measurements during International Arctic Ocean Expedition 1991; Instrumentation and measurement summary, STC Technical Report 2682 to U.S Coast Guard Headquarters under contract DTCG23-91_D-ENM026, Delivery Order 92-0007, May 1993.