HAL Id: hal-02989507
https://hal.archives-ouvertes.fr/hal-02989507
Submitted on 12 Nov 2020HAL is a multi-disciplinary open access archive for the deposit and dissemination of sci-entific research documents, whether they are pub-lished or not. The documents may come from teaching and research institutions in France or abroad, or from public or private research centers.
L’archive ouverte pluridisciplinaire HAL, est destinée au dépôt et à la diffusion de documents scientifiques de niveau recherche, publiés ou non, émanant des établissements d’enseignement et de recherche français ou étrangers, des laboratoires publics ou privés.
Effect of Ti4+ on the structure of nepheline (NaAlSiO4)
glass
Emily Nienhuis, José Marcial, Thibaut Robine, Charles Le Losq, Daniel
Neuville, Martin Stennett, Neil Hyatt, John Mccloy
To cite this version:
Emily Nienhuis, José Marcial, Thibaut Robine, Charles Le Losq, Daniel Neuville, et al.. Effect of Ti4+ on the structure of nepheline (NaAlSiO4) glass. Geochimica et Cosmochimica Acta, Elsevier, 2020, 290, pp.333-351. �10.1016/j.gca.2020.09.015�. �hal-02989507�
1
Effect of Ti
4+on the Structure of Nepheline (NaAlSiO4) Glass
1 2
Emily T. Nienhuis,1 José Marcial,2,3 Thibaut Robine,4 Charles Le Losq,4 Daniel R. Neuville,4
3
Martin C. Stennett,5 Neil C. Hyatt,5 John S. McCloy1,2,3,4,5
4 5
1
Materials Science and Engineering Program, Washington State University, PO Box 641030, Pullman, 6
WA, 99164-1030 7
2
Pacific Northwest National Laboratory, Richland, WA 99352 8
3
School of Mechanical and Materials Engineering, Washington State University, PO BOX 642920, 9
Pullman, WA 99164-2920 10
4
Géomatériaux, CNRS, Institut de Physique du Globe de Paris, USPC, 1 rue Jussieu, 75252 Paris Cedex 11
05, France 12
5
Department of Materials Science and Engineering, The University of Sheffield, Sir Robert Hadfield 13
Building, Mappin Street, Sheffield, S1 3JD, UK 14
15
Corresponding Author: John McCloy [email protected] 16
17 *Manuscript
2
Abstract
18
In this study, the effect of Ti4+ on the structure of nepheline glass (NaAlSiO4) is 19
investigated as SiO2 is systematically replaced with TiO2. Traditionally, TiO2 is considered to be 20
a nucleating agent for silicate crystallization but can also be incorporated into the glass network
21
in relatively large amounts as either a glass former or modifier depending on its coordination
22
with oxygen. To determine the effect of Ti4+ on the structure of nepheline glass, X-ray and
23
neutron pair distribution function (PDF) analysis paired with Empirical Potential Structure
24
Refinement (EPSR) were conducted and are supplemented with Raman spectroscopy and Ti
K-25
edge X-ray absorption spectroscopy (including Extended X-ray Absorption Fine Structure,
26
EXAFS). Through these methods, it has been found that up to 15 mol% (16 wt%) TiO2 can 27
incorporate into the glass network as a primarily four-fold coordinated species, with a minor
28
contribution of five-fold coordinated Ti as the TiO2 content is increased. Between 29
NaAlTi0.1Si0.9O4 and NaAlTi0.2Si0.8O4, EXAFS suggests a local structure change in the second 30
nearest neighbor, from a Ti atom to an Al atom. Raman spectroscopy also suggests that as Ti
31
content increases, the Na environment becomes more ordered.
32 33
3
1.0 Introduction
34
Titania (TiO2) has been found to play a significant role in nearly all glass families, though 35
it is not considered to be a glass-forming oxide on its own. Glass formation for Ti4+-containing
36
systems has been reported for the following glass families: alkali silicate (Gan et al., 1996;
37
Hamilton and Cleek, 1958; Henderson and St-Amour, 2004; Limbach et al., 2017; Yarker et al.,
38
1986), alkaline earth silicate (Gan et al., 1996; Henderson and St-Amour, 2004; Limbach et al.,
39
2017), aluminosilicate (Kajiwara, 1988), other silicate based glasses (Peterson and Kurkjian,
40
1972), borate (Lee et al., 2012), tellurite (Nasu et al., 1990; Sabadel et al., 1997), and phosphate
41
(Fu, 2011; Hoppe et al., 2007), as well as in alkali-titanate glasses without traditional
glass-42
forming oxides (Miyaji et al., 1991; Rao, 1964; Sakka et al., 1990; Sakka et al., 1989). For many
43
of these glasses, discerning the local environment of Ti4+ was a primary feature of the study, and
44
was related to the role of Ti4+ within the glass network, whether it be a former,
glass-45
modifier, or an intermediate species. Unless otherwise noted, the subsequent discussion refers to
46
Ti4+.
47
In glasses, Ti has been observed to be four-, five-, and six-fold coordinated with oxygen,
48
and its role within the glass network is dependent upon its coordination state. Four-fold
49
coordinated Ti, [4]Ti, is largely considered to act as a glass former, whereas six-fold coordinated
50
Ti, [6]Ti, acts as a modifier (Mysen and Neuville, 1995). Five-fold coordinated Ti, [5]Ti, is
51
hypothesized to act as both a network modifier and a network former due to two distinct types of
52
bonds with oxygen ‒ one capable of forming bridging oxygen bonds and the other a terminal
53
oxygen bond (Farges et al., 1996b; Henderson and St-Amour, 2004). More recently, though, [5]Ti
54
has been described primarily as a network former due to its ability to form bridging oxygen with
55
other network forming species within the glass, despite the presence of the terminal oxygen bond
4
(Henderson and St-Amour, 2004; Limbach et al., 2017). Most studies interested in the local
57
structure of Ti within glasses have concluded that the coordination of Ti is dependent on the
58
glass composition and the overall concentration of Ti within the glass, and often a mixture of two
59
coordination states is reported. This mixture of coordination states can result in Ti occupying two
60
distinct sites within the glass network. This is referred to as the “two-site model” by Greegor et
61
al (Greegor et al., 1983) and is discussed in terms of the “dual role of titanium” by Rao et al
62
(Rao, 1963), and is seen as an equilibrium between the two coordination states.
63
Overall, increased amounts of TiO2 can be incorporated into glasses containing alkali and 64
alkaline earth oxides as compared with those containing only silica (Gan et al., 1996; Limbach et
65
al., 2017; Yarker et al., 1986). It has also been observed that Ti is five-fold coordinated at
66
relatively low concentrations, and then shifts to [4]Ti before forming octahedral [6]Ti and then
67
crystallizing (Greegor et al., 1983; Henderson and St-Amour, 2004). The relative amount of TiO2 68
that can be accepted into the glass structure and the Ti coordination are hypothesized to be
69
related by two factors, network rigidity and the amount of free-volume within the network
70
(which must be sufficiently large to accommodate Ti polyhedra of various sizes) (Henderson and
71
Fleet, 1997; Williams et al., 2019). Based upon this, [4]Ti is likely to be present in an
72
unconstrained network featuring non-bridging oxygen, whereas [5]Ti is likely to be observed in a
73
more connected and constrained glass network. [6]Ti results from volume constraints within the
74
glass network, whether it be a Ti-containing silicate or an alkali/alkaline earth silicate glass.
75
In the case of glasses containing only TiO2 and SiO2, at low TiO2 additions, the network 76
is primarily made up of SiO2 with bridging oxygen, yielding a relatively rigid network. As TiO2 77
is added, it serves to alter the network connectivity promoting the formation of [4]Ti, through the
78
initial presence of [5]Ti acting as a modifier to break up the network. In glasses containing alkali
5
or alkaline earth oxides, the network is broken up by network modifiers, and non-bridging
80
oxygens are present, which does not necessarily require the initial presence of [5]Ti as the TiO2 -81
SiO2 glasses do. 82
Additionally, studies of molten TiO2 have observed five-fold coordinated Ti (Alderman 83
et al., 2014) while crystalline TiO2 polymorphs (anatase, brookite, and rutile) have six-fold 84
coordinated Ti present as [6]Ti octahedra (Hess et al., 2001; Krawczynski et al., 2009; Krzmanc
85
et al., 2012; Yu et al., 2009).
86
Ti is also found in more complex natural glasses on the order of ~1 wt% (for example,
87
tektites and some basaltic glasses) and up to ~16 wt% in lunar glasses (Cicconi and Neuville,
88
2019), though in lunar glasses, Ti can be present as Ti3+ due to low oxygen fugacity
89
(Krawczynski et al., 2009). Additionally, fulgurites formed in mafic or ultramafic rock can have
90
increased amounts of TiO2 in addition to being silica-rich. In igneous melts, Ti is a minor 91
constituent, but can play a significant role in altering the structure of silicate melts and can affect
92
the thermodynamic and physical properties of the melt (Cormier et al., 1998; Gan et al., 1996).
93
For example, the viscous flow of silicate melts is, at least, partially dependent on the bond
94
strength, which is altered by additional melt constituents (such as TiO2) and their respective bond 95
lengths and coordination; see (Le Losq et al., 2019) and (Richet and Mysen, 2019) for a review
96
on the subject.
97
Due to the ability of Ti to act as both a glass modifier and former, relatively abundant
98
presence in natural minerals and glasses, and its applications as a nucleating agent in
glass-99
ceramics (Beall et al., 2012; Fernandes et al., 2013; Kajiwara, 1988; Krzmanc et al., 2012), this
100
study seeks to understand the glass structure of Ti-doped nepheline (NaAlSiO4) glass, 101
specifically, the local structure and role of Ti4+ within the glass matrix and its ability to substitute
6
for Si4+ in the glass network. Nepheline glass is considered to be a metaluminous composition
103
(Mysen and Toplis, 2007), and Al in nepheline glass has been found previously to be four-fold
104
coordinated acting as a network former (Lee and Stebbins, 2000; Marcial and McCloy, 2019).
105
Addition of Al to the glass could make the silica network more flexible to promote the formation
106
of [4]Ti as discussed, in addition to the presence of the glass modifier and charge compensator,
107
Na. In this study, the glass structure is characterized through pair distribution function (PDF)
108
analysis obtained from both X-ray and neutron total scattering experiments. To confirm the local
109
environment of Ti within the glass, further characterization via Ti K-edge X-ray Absorption
110
Spectroscopy (XAS) and Raman spectroscopy were performed
111
2.0 Experimental
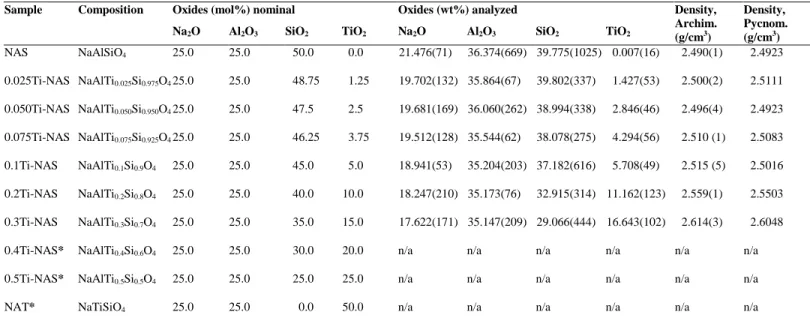
1122.1 Sample Preparation, Physical, and Chemical Characterization
113
Glasses were batched from reagent-grade TiO2 (Sigma Aldrich, >99.8 %), SiO2 (U.S. 114
Silica), Al2O3 (Fisher, >99.0 %), and Na2CO3 (Fisher, >99.5 %) to obtain the final compositions 115
shown in Table 1 and were melted at 1650 °C in an electric furnace. Prior to melting, batch
116
materials were mixed using an agate mortar and pestle to ensure a homogenous batch. All
117
samples were melted in Pt-Rh crucibles for one hour and quenched by dipping the bottom of the
118
crucible into a room temperature water bath. The resulting glasses were crushed using a
119
tungsten-carbide (WC) ring mill for 0.06 minutes. The powdered glasses were then melted again
120
for one hour; a second melt ensured a homogenous melt and glass. Nomenclature of the
121
NaAlTixSi1-xO4 glasses is shown as x-Ti-NAS, x is the mole fraction substitution for Si. All 122
compositions with Ti content up to and including 0.3Ti-NAS formed bulk glasses (Table 1).
123
Glasses with a higher Ti content resulted in crystallization of TiO2 on the glass surface upon 124
quench. In the fully Ti-substituted glass, NAT, a bulk ceramic material was formed.
7
Helium pycnometry was performed with a Micromeritics Acupyc II 1340 gas pycnometer
126
on pieces of glass with masses between 0.5-1.0 g in a 1.0 cm3 sample chamber that had been
127
calibrated using the manufacturer’s standard. Each sample was measured ten times and the
128
results were averaged to obtain the final mass density (Table 1). Densities of all glass samples
129
were also measured using the Archimedes method with toluene as the immersion liquid as it does
130
not react with glasses, has a good wetting power, and has a well-known density including
131
temperature dependence. Results are an average of measurements made on four distinct pieces of
132
glass (Table 1).
133
Chemical compositions of the glasses have been measured using a Cameca SXFive
134
electron microprobe (Table 1), with a 30 nA current, U=30 kV, and 5 s of counting. These
135
chemical compositions are the mean of five individual measurements. Glasses were prepared in
136
polymeric resin, polished, and metallized.
137
2.4 Total Scattering
138
A summary of the samples on which the total scattering experiments and atomistic
139
simulations were performed are shown in Table 2 for reference.
140
2.4.1 X-Ray Total Scattering 141
X-ray total scattering measurements were conducted at beamline 6-ID-D at the Advanced
142
Photon Source, Argonne National Laboratory, Chicago, IL with a wavelength of 0.12355 Å.
143
Measurements were performed on fine powdered glass samples packed in 0.0395” (1.02 mm)
144
inner diameter, 0.0435” (1.105 mm) outer diameter polyimide capillaries and sealed with epoxy.
145
Synchrotron X-ray total scattering experiments were performed on all glass samples except
146
0.3Ti-NAS. Concurrent with sample measurements, measurements of the detector without an
X-147
ray beam and of an empty capillary were taken in order to accurately subtract the dark current,
8
the background attributed to the capillary, and air scattering. Cerianite (CeO2, NIST Standard) 149
was run as a calibrant to determine sample-to-detector distance, the beam center, and the detector
150
tilt using Fit2D software (Hammersley, 1997). The final output of Fit2D was the intensity as a
151
function of 2θ, I(2θ).
152
GudrunX (Soper, 2011) software was used to process the reduced intensity data as a
153
function of diffraction angle, I(2θ), to the total structure factor, F(Q). GudrunX also performed
154
the Fourier transform of the F(Q) to obtain the Pair Distribution Function (PDF) normalized to
155
single atom scattering, referred to as g(r) in this work. For further definition of the functions used
156
in this study, see (Keen, 2001; Marcial and McCloy, 2019). Densities utilized in GudrunX were
157
determined via He-pycnometry, as described above. A Q-range of 0.04-18.0 Å-1 with a step size
158
of 0.04 Å-1 was used as the range for useable data as well as for the final F(Q). An r-max for the
159
final g(r) was set to be 17.0 Å with a step size of 0.01 Å. A Breit-Dirac factor was applied
160
ranging from -5 to -9. A top-hat width (for the Lorch function) of 1.7 Å was utilized and 1.25 Å
161
was used as the minimum radius for the Fourier transform. The sample ‘tweak factor’ (1/packing
162
fraction) was set to 1.5 as the samples were powders and were likely not packed with 100%
163
efficiency in the capillaries.
164
2.4.2 Neutron Total Scattering 165
Neutron total scattering experiments were conducted at the NOMAD (BL-1B) beamline
166
at the Spallation Neutron Source of Oak Ridge National Laboratory. Measurements were
167
performed on fine powdered glass samples packed in 3 mm (outer diameter), 0.1 mm thick fused
168
quartz capillaries. Each sample was measured four times and summed to obtain the final F(Q)
169
with a Q-range of 0-31.4 Å-1. An empty vanadium can was used as the incoherent neutron
170
scatterer, which was used to obtain the F(Q). A diamond standard in a vanadium can was used to
9
determine the sample-to-detector bank distances implemented in converting the neutron
time-of-172
flight to the magnitude of the momentum-transfer vector, or Q-space. A Fourier filter was
173
applied to remove spurious peaks below 1.3 Å, below which no known atomic bonds are present
174
for this system. For further information on this, the reader is referred elsewhere (Marcial and
175
McCloy, 2019; Neuefeind et al., 2012).
176
2.4.3 Structure Modeling 177
Empirical Potential Structure Refinement shell (EPSR) was used to model the
178
experimental F(Q), obtained from neutron and X-ray total scattering experiments, via a
co-179
refinement method where the X-ray and neutron F(Q) are simultaneously fit (Soper, 2009). The
180
co-refinement method was performed on NAS, 0.1Ti-NAS, and 0.2Ti-NAS. For 0.3Ti-NAS,
181
only the neutron data was modeled using EPSR (X-ray scattering was not obtained). The
182
modeled F(Q) data was then Fourier transformed by EPSR to obtain the modeled g(r) for
183
comparison to the experimentally obtained g(r) for both neutron and X-ray data; EPSR does not
184
directly model g(r). The reference potentials shown in Table 3 and the atom box parameters
185
shown in Table 4 were defined prior to EPSR simulation. In the EPSR potentials, the parameters
186
ε and σ control the depth and width of the potential energy well, while M is the atomic number
187
and q the valence of the ion.
188
Prior to starting the simulation, all atoms were distributed randomly through the atom
189
box. The temperature was then set to 10,000 K and simulations were allowed to run until the
190
internal energy of the system had equilibrated. Once the internal energy had equilibrated, the
191
temperature was dropped to 5,000 K, and then to 300 K. Once the internal energy had
192
equilibrated at 300 K, the reference potentials were refined. Next, the total empirical potential of
193
the system was sequentially increased to 50, 100, 150, 200, and 250, allowing for further
10
refinement of the reference potentials. A sequential increase of the empirical potential allowed
195
for a refinement of the reference potentials as well as a systematic increase of the internal energy
196
of the atom box, allowing for a best possible fit of the experimental data.
197
Average coordination numbers were calculated by EPSR by counting the number of
198
nearest neighbors within a user-defined distance window (Table 5); distance windows were
199
defined based upon the modeled individual g(r)’s. Average coordination numbers were
200
additionally determined through visualization of the inflection point in the N(r) curve, called the
201
running coordination number, calculated by EPSR, with Nij(r) being defined as the number of
202
atom type i surrounding atom type j located at radial distance, r (Marcial and McCloy, 2019).
203
The function Nij(r) is an average, such that Nij(r)=4πρAr2×dgij(r)/dr, where ρA is the atomic
204
number density, which was calculated from densities determined through He-pycnometry in this
205
study, and gij(r) is the partial pair distribution function of components i and j scaled with either
206
the neutron or X-ray scattering lengths. Not all neutron data sets were modeled due to low
207
amounts of Ti in the glasses, resulting in relatively few Ti atoms in the atom box used for EPSR
208
compared to the total atom count.
209
2.5 Ti K-edge X-ray Absorption Spectroscopy (XAS)
210
Ti K-edge X-ray absorption spectroscopy (XAS) was collected at two different
211
synchrotron beamlines. Samples for XAS were dispersed in polyethylene glycol (PEG) with
212
ratios optimized to achieve approximately one absorption length thickness while maintaining a
213
suitable Ti K-edge absorption edge step.
214
2.5.1 KEK Light Source 215
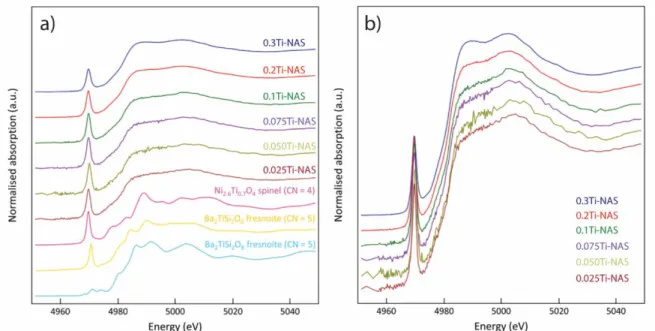
Samples were measured in transmission mode on beam line BL-27B at the PF Ring of the
216
Photon Factory synchrotron facility (Tsukuba, Japan), which operates at 2.5 GeV with a 300 mA
11
ring current. BL-27B uses a double crystal Si(111) monochromator with a sagittal focussing
218
mechanism, and the energy range accessible extends from 4 to 20 keV. Beam size was restricted
219
to 1 mm (H) and 3 mm (W) using slits and the intensity of the incident (I0) and transmitted (It)
220
X-ray intensities were measured using ionization chambers which could be filled with a variety
221
of gases to tailor the absorption in each chamber (Konishi et al., 1996). Spectra were recorded
222
between 4836 and 5700 eV with energy steps of 4 eV (4836 – 4956), 0.25 eV (4956 – 5000), 2
223
eV (5000 – 5250), and 4 eV (5250 – 5700). An accumulation time of 1 s step-1 was used for all
224
regions. For each sample, 3 to 30 spectra were averaged (depending on the Ti concentration) to
225
improve the signal to noise ratio. To ensure accurate energy calibration, a transmission spectrum
226
of a Ti foil was acquired and the position of the first inflection point in the derivative spectrum
227
was set to 4966 eV (Bearden and Burr, 1967). The reference foil was also measured after each
228
sample to check the monochromator energy calibration and provide energy reproducibility,
229
between sets of scans, of ± 0.05 eV.
230
Spectra were recorded for five glasses (0.075Ti-, 0.1Ti-, 0.2Ti-, and 0.3Ti-NAS) and
231
three crystalline standards. The crystalline standards used were: TiO2 rutile (Sigma Aldrich) 232
containing Ti4+ in octahedral coordination, the mineral fresnoite (Ba2SiTi2O8) from Junnila 233
Mine, California (BM.2000,121: sample kindly supplied by the British Natural History Museum)
234
containing Ti4+ in five-fold coordination, and Ni2.6Ti0.7O4 spinel synthesised from reagent grade 235
precursors according to Lager et al. (Lager et al., 1981), which contains Ti4+ in tetrahedral
236
coordination. All standards were confirmed to be phase pure by X-ray diffraction.
237
2.5.2 National Synchrotron Light Source-II 238
Samples were also measured at the National Synchrotron Light Source II (NSLS-II) at
239
Brookhaven National Laboratory (Upton, New York), beamline 6-BM. Spectra of all six glasses
12
(0.025Ti-, 0.050-Ti, 075Ti-, 0.1Ti-, 0.2Ti-, and 0.3Ti-NAS) were collected in both fluorescence
241
and transmission mode. 6-BM utilises a 3-pole wiggler source and delivers X-ray in the energy
242
range between 4.5 and 23 keV. The optical system consists of a parabolic collimating mirror (5
243
nm Rh on 30 nm Pt), Si(111) and Si(311) monochromators, a toroidal focussing mirror, and a
244
flat Pt-coated harmonic rejection mirror. Several modes of operation are possible on the
245
beamline. For this study, the Si(111) monochromator and an unfocused beam was used; the beam
246
was collimated to 0.5 mm in the vertical and 6 mm in the horizontal using slits. Ionization
247
chambers were used to measure the incident and transmitted X-ray energies in transmission
248
geometry and a SII Vortex ME4 (4-element Si drift) detector was used to simultaneously collect
249
the fluorescence signal. The samples were mounted at 45° to both the incident X-ray beam and
250
the vortex detector. The fluorescence signal was dead-time corrected a previously described
251
(Woicik et al., 2010). Spectra were recorded between 4766 and 5606 eV with energy steps of 10
252
eV (4766 – 4936), 2 eV (4963 – 4956), 0.25 eV (4956 – 4996), and 0.5 eV (4996 – 5606). An
253
accumulation time of 0.5 s step-1 was used for the first three regions and 0.25 s step-1 for the final
254
region. For each sample, 6 to 12 spectra were averaged (depending on the Ti concentration) to
255
improve the signal to noise ratio. To ensure accurate energy calibration, a transmission spectrum
256
of a Ti foil reference was acquired simultaneously with each sample. The Ti foil was placed
257
downstream of the sample between the transmission (It) and reference (Ir) ion chambers.
258
2.5.3 Data reduction 259
Data reduction and subsequent analysis was performed using the Demeter suite of
260
programs (Athena, Artemis, and Hephaestus) (Ravel and Newville, 2005a, b), for X-ray
261
Absorption Near Edge Structure (XANES) and Extended X-ray Absorption Fine Structure
262
(EXAFS). Initial processing of the data sets involved using a standard background subtraction
13
and edge step normalisation procedure (Newville, 2001; Ravel and Newville, 2005b). The
264
energy of the first maximum in the derivative of the energy spectrum for the Ti foil in the
NSLS-265
II reference channel was calibrated to 4966.0 eV, and after normalization and energy alignment,
266
direct comparisons between the Ti K-edge XANES for the samples could be made. Each Ti foil
267
measurement made at KEK was aligned to the calibrated NSLS-II foil data and the same energy
268
adjustment was then applied to the corresponding samples or standard. A cubic spline function
269
was used to model the background; this was subtracted from the normalized data.
270
2.5.4 Pre-edge analysis 271
The pre-edge is related to electronic transitions occurring between the 1s and 3d energy
272
levels and is a feature common to the K-edge spectra of many transition metals. Lower oxidation
273
states have fewer unfilled 3d levels, so transitions from the 1s levels become less probably and
274
the intensity of this feature becomes less well-defined; here all the Ti atoms are assumed to be
275
Ti4+, and only these standards were considered. The normalized height of the pre-edge also
276
decreases significantly as a result of an increase in centro-symmetry (i.e., the pre-edge is less
277
distinct for octahedral than tetrahedral symmetry) (Yamamoto, 2008).
278
It has been shown for many transition metals, including Ti, that the fitting of the pre-edge
279
to the white line can give information about valence and coordination number in glasses
280
(Chalmin et al., 2009; Farges et al., 1996a; Farges et al., 2005). The glasses and the three
281
standards were measured and a fitting routine was applied to analyze the pre-edge features. The
282
standards included representative [6]Ti4+ (rutile, TiO2), [5]Ti4+ (fresnoite, Ba2TiSi2O8), and 283
[4]Ti4+ (spinel, Ni2.6Ti0.7O4). For the pre-edge analysis, a series of Gaussians was fit in the 4960 284
– 5040 eV range, and the contribution for the pre-edge was extracted (Farges et al., 1996c). From
14
this, the centroid and normalized height were determined, with the energies and heights being
286
distinctive for coordination environments of Ti4+.
287
2.5.5 EXAFS analysis 288
Subsequently, energy values in eV were converted to k (Å-1) to give the k3 weighted χ(k)
289
data. Applying a Fourier transform (FT) to the data yielded a partial radial distribution function
290
(RDF) where peaks represent shells of atoms surrounding the central Ti absorber atom. For each
291
shell of atoms, the path length (R), the thermal parameter (σ2), and the coordination number (N)
292
were extracted by fitting the data to a suitable starting model.
293
The local structure around the Ti scatterer was obtained from the XAS by fitting the
294
EXAFS using Artemis software (Ravel and Newville, 2005a, b). The data from KEK was used
295
for the fitting. Determination of the local structure in the glass samples requires an independent
296
determination of the amplitude reduction factor ( ) term in the EXAFS equation (Kelly et al.,
297
2008). First, the amplitude reduction factor (= 0.65 ± 0.03) was obtained by fitting the TiO2 298
(rutile) standard using the structure from a crystallographic information file (Baur and Khan,
299
1971), and computing the scattering paths using FEFF. This refined amplitude reduction factor
300
was then used to fit the glasses 3Ti-NAS, 2Ti-NAS, 1-Ti-NAS, and 075Ti-NAS.
301
The first coordination shell of oxygen was modeled using a Ti-O scattering path
302
generated using FEFF and the structural model given in the crystallographic information file
303
(CIF) for NaTi2Al5O12 (Mumme and Wadsley, 1967). The oxygen coordination number around 304
the Ti (NTi-O), the change in the Ti-O bond length (δRTi-O), the Debye-Waller thermal factors for 305
oxygen (σ2
O), and the change in the absorption edge energy (δE0) were all allowed to refine. This 306
approach returned a satisfactory fit to the intense feature in the low radial distance range of the
307
FT k3χ(k). In order to fit the spectral features at higher radial distance, three additional scattering
15
paths were added. Two scattering paths, Ti-Al and Ti-Ti, were taken from the NaTi2Al5O12 309
model and the third path (Ti-Si) was generated from the Na2TiSiO5 CIF (Ziadi et al., 1996). The 310
coordination number was kept fixed at two for these additional contributions. An attempt was
311
made to include a Ti-Na scattering path, but this did not yield an improvement in the fit. For each
312
additional scatterer, δRTi-i (where RTi-i indicates the average interatomic distance for a given Ti-i 313
pair) and σ2
i were refined simultaneously. 314
2.6 Raman Spectroscopy
315
Raman spectra were collected on a Jobin-Yvon Horiba T64000 Triple-spectrometer with
316
confocal system through an Olympus BX40 microscope. Samples were excited using a 488.1 nm
317
Coherent Genesis MX SLM laser running at 500 mW output power. The detector was a liquid
318
nitrogen cooled CCD camera. The spectrometer was calibrated using the 520.7 cm-1 line of
319
single crystal Si to within 0.6 cm-1. Spectra were collected through a 100x objective, from 25 to
320
1300 cm-1, for count times of 200 s, with three subsequent spectra averaged.
321
3.0 Results
3223.1 Glass density and chemistry
323
All single-phase glasses prepared in this study were analyzed via EPMA and their
324
densities were measured using the Archimedean method with toluene as an immersion liquid and
325
He pycnometry. Results are shown in Table 1 and compared with the theoretical as-batched
326
compositions.
327
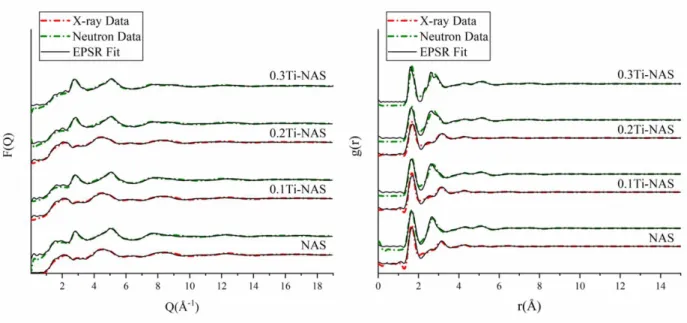
3.2 Pair Distribution Function Analysis
328
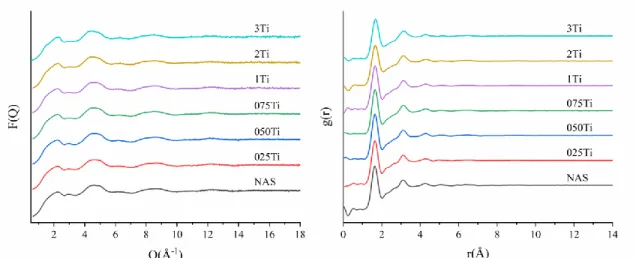
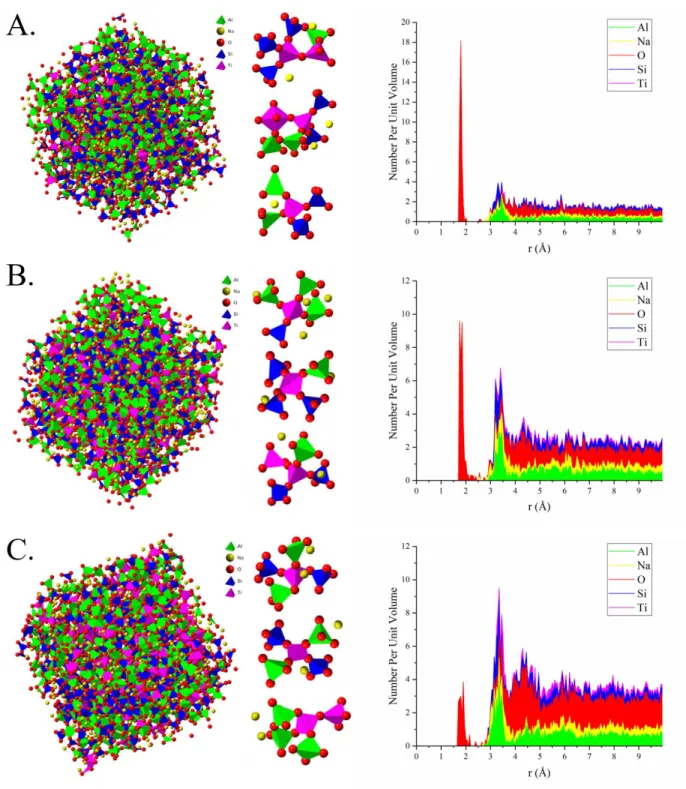
Pair distribution function (PDF) analysis was performed on the samples listed in Table 2.
329
Neutron total scattering data is shown in Figure 1. EPSR simulation fits of both neutron and
16
ray obtained F(Q), and the resulting g(r), are shown in Figure 2. The deconvoluted g(r)
331
functions were calculated from the EPSR atom model and are shown in Figure 3. These
332
deconvoluted gij(r) functions result in the first peak being a combination of Si-O, Ti-O and Al-O
333
pair correlations, with the Si-O correlations being at a slightly shorter distance than that of Ti-O
334
and Al-O. The Ti-O and Al-O bond lengths are nearly identical in these glasses, but this overlap
335
is not problematic due to the negative scattering length of natural Ti in neutron total scattering
336
experiments (see Table A-1 and discussion in Appendix). By comparing X-ray and neutron total
337
scattering experiments in an EPSR co-refinement, the Ti local environment can be distinguished
338
from that of Si and Al local environments. Na-O does not contribute to the first peak in the g
Na-339
O(r), but rather in the second peak, occurring around 2.5 Å.
340
Through observation of the deconvoluted gij(r), or partial PDF, bond distance windows
341
were defined and used to calculate the coordination numbers. The resultant calculated
342
coordination numbers are shown in Table 5. As a secondary means to determine the
343
coordination numbers of species within the glasses, Nij(r) functions were calculated and plotted,
344
the results are shown in Figure 3. The Nij(r) functions are independent of user-defined distance
345
windows; rather, they are derived directly from the partial PDF’s by EPSR.
346
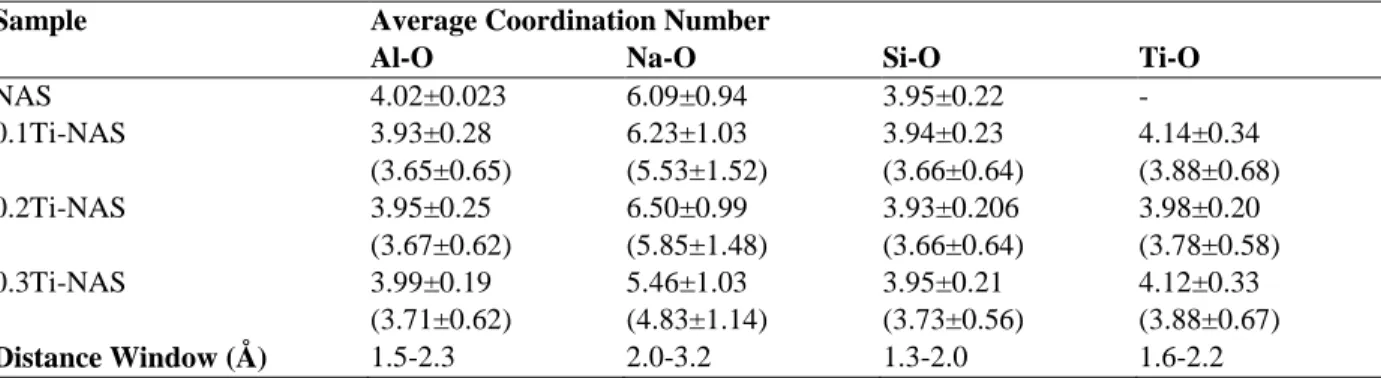
Looking specifically at the EPSR calculated coordination numbers (Table 5), the Si-O
347
coordination and Al-O coordination remained approximately four, regardless of the Ti addition
348
to the glass. The Na-O coordination number calculations did not result in one consistent
349
coordination number for Na. The coordination of Na in NAS (nepheline) glass was
350
approximately six. The Na-O coordination increased in the 0.1Ti and 0.2Ti glasses with a
351
coordination number of 6.23 and 6.50, respectively. In the 0.3Ti glass, the Na-O average
352
coordination decreased below six for an average coordination of 5.46. Coordination numbers
17
determined via this method are dependent upon the user definition of a bond-distance window;
354
too large of a window can result in including atoms that are not directly bonded to the species of
355
interest within the calculation, while too small of a distance window results in excluding atoms
356
of interest.
357
Comparing these coordination numbers to those shown in the Nij(r) plots, Si, Al, and Ti
358
all have coordination numbers approximately of four, with Ti having a slightly higher average
359
coordination. An average Ti-O coordination number larger than four could indicate a minor
360
contribution of [5]Ti or [6]Ti (with the majority of atoms present as [4]Ti). Looking at the atom
361
model from EPSR, Ti is primarily four-fold coordinated, but in the case of the 0.1Ti atom model,
362
a small amount of [5]Ti was observed, see Figure 4A. The coordination of Na-O in the N(r) plots
363
is not as well defined, because the inflection point, which is used to determine the coordination
364
number in these functions, is not as clear and does not plateau in the same way that Si-O, Al-O,
365
and Ti-O do in their respective N(r) plots.
366
Further inspection of the atom models exported from EPSR (Figure 4) shows [4]Ti
367
tetrahedra linking with [4]Al, [4]Si, and in some cases other Ti polyhedra through bridging oxygen
368
bonds. These atom models show Na atoms interspersed throughout the network of Al, Si, and Ti.
369
In addition to using EPSR to determine bond distances and coordination numbers, the exported
370
atom models were visualized using CrystalMaker (Oxfordshire, UK), using defined bonding
371
distance windows also used in EPSR. The resulting coordination numbers are shown in Table 5.
372
Atom distributions around Ti for the exported atom model are shown in Figure 4; here the first
373
coordination sphere is shown to consist of oxygen atoms, as indicated by the first peak. The
374
second coordination sphere is an overlap of Al, Ti, and Si contributions.
18
3.3 Ti K-edge XAS
376
The normalized Ti K-edge XANES spectra for all the glass samples are offset and
377
compared to mineral standards in Figure 5. The XANES region contains qualitative information
378
about the mid-range ordering around the Ti atoms in the glass and the trends observed here
379
suggest there is increased ordering around the Ti atoms with increasing Ti concentration (Farges
380
et al., 1996c; Farges et al., 1997).
381
Visual inspection of the pre-edge region in the stack plot (Figure 5a) indicates that the Ti
382
atoms in the glass are in a similar tetrahedral coordination environment to those in the spinel
383
structured Ni2.6Ti0.7O4. The centroid energy and peak heights calculated for the standards and the 384
glasses were compared against published results in the literature (Farges et al., 1996c). This
385
comparison is shown in Figure 6, and the standards all sit within the expected regions on the plot
386
which are defined in terms of the local Ti environment.
387
The position of the centroid energy and the peak height suggest that Ti is in a tetrahedral
388
environment in all glasses. This is consistent, within error, with the EXAFS fitting described
389
below. To ensure consistency in the pre-edge analysis, average values for the centroid energy
390
position and the peak height were calculated from the fluorescence and transmission data
391
collected at NSLS-II. Independent fitting of the KEK glass data yield results slightly different,
392
but within the tetrahedral domain. It should be noted that differences in beamline alignment and
393
calibration, and the normalization and fitting procedure used (i.e., fitting Gaussians to the whole
394
XANES spectral envelope versus fitting only the pre-edge feature) can affect the final position
395
on the plot. Nonetheless, the results consistently suggest overwhelming dominance of [4]Ti4+.
396
The EXAFS fits are shown in Figure 7 and the refined model parameters are given in
397
Table 6. To validate the refined path lengths, the bond valance sum (BVS) approach was used
19
(Brown and Altermatt, 1985). The bond valence was calculated using an observed bond length
399
) of 1.815 Å and empirical constant (B) of 0.37. The BVS was then calculated by multiplying
400
this value by the number of coordinated oxygens refined in the EXAFS fit. Obtained BVS’s were
401
between 3.50 and 3.75, with typical errors of 0.5 – 1.0 valence unit (v. u.), reasonably close to
402
the expected 4.0 for Ti4+.
403
From the final EXAFS structural parameters, it can be observed that the local structure of
404
the glasses changes between 0.1Ti-NAS and 0.2Ti-NAS. For the lower Ti concentrations (075Ti
405
and 0.1Ti), the second nearest neighbor (2NN) to the Ti scatterer is another Ti atom, ~2.46 Å,
406
implying Ti clustering behavior. Additional neighboring Al and Si distances were refined at
407
~3.00 Å and ~3.25 Å, respectively. For the larger Ti concentrations (0.2Ti and 0.3Ti), the 2NN
408
for the Ti scatterer is Al at 2.76 Å; a third shell containing Si atoms and Ti in the same
409
coordination sphere (within errors) was refined at ~3.00 Å. This change in local structure
410
qualitatively agrees with the change in the XANES region (see Figure 5b) which shows
411
increased structure for 0.3Ti and 0.2Ti, while the glasses with lower Ti appear to overlay each
412
other in that region.
413
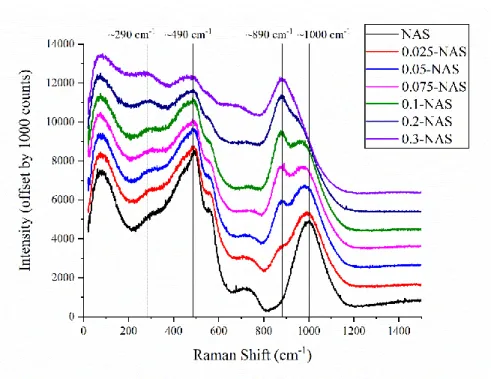
3.4 Raman Spectroscopy
414
Raman spectra are shown in Figure 8. The spectra are composed of several bands. A
415
broad band is observed at ~80 cm-1, followed by a small peak located at ~290 cm-1. An intense
416
peak is present at ~490 cm-1, with a small shoulder near 560 cm-1. A large and not very intense
417
peak is observed at ~730 cm-1. A broad band is observed near ~1000 cm-1, and Ti-bearing glasses
418
also show an intense band at 890 cm-1.
419
Increasing the Ti content in the glass results in several clear changes in those signals.
420
First, peaks present in the NAS glass spectrum generally become broader and less defined with
20
Ti addition. The other two noticeable changes with Ti addition are (i) the band at ~290 cm-1
422
becomes more intense and better defined, and (ii) a peak at ~890 cm-1 appears and increases in
423
intensity at the expense of the ~1000 cm-1 peak originally present in the NAS glass. The relative
424
intensity of the two 890 cm-1 and ~1000 cm-1 bands is represented as a function of the Ti/(Ti+Si)
425
ratio of the glasses in Figure 9. The evolution of this relative intensity as a function of the
426
Ti/(Ti+Si) ratio is not linear and shows a logarithmic trend. This indicates that the Raman cross
427
section of the vibration giving the signal near ~890 cm-1 is very different to that of the vibrations
428
giving the ~1000 cm-1 signal in the NAS glass, and that the signal mixture between those two
429
different vibrations is a non-linear process.
430
4.0 Discussion
4314.1 Short Range Ordering through PDF analysis
432
This study focuses on understanding the compositional influence of the glass structure
433
after quenching. Through the PDF analysis, it can be concluded that Si and Al are
four-434
coordinated and act as network formers, regardless of the Ti content of the glass; there is no
435
observable change in the Al-O and Si-O bond distance. This has been previously determined for
436
other nepheline-based glass compositions by using similar methodology (Marcial and McCloy,
437
2019).
438
The local environment of Na is less ordered, compared to Si and Al, and varies with the
439
Ti content of the glass. The average coordination of Na in NAS (nepheline) glass was
440
approximately six, which is in agreement with (Marcial and McCloy, 2019), where EPSR was
441
also utilized in calculating coordination numbers. In another study on nepheline glass, Na was
442
observed by XANES at the Na K-edge to be nine-fold coordinated (Neuville et al., 2004).
443
Differences in the Na coordination number could be due to the expimental difference, total
21
scattering is a technique looking at the average structure of the material, whereas, XANES is
445
atom specific. Calculations in Na coordination number could also have variation due to the
446
relatively disordered local environment of Na because of its role as a network modifier or charge
447
compensator. As the Ti content increased, the Na coordination was observed to also increase,
448
until the 0.3Ti sample, in which the Na coordination was at its lowest observed value for this
449
study, as observed from EPSR calculations for a user-defined distance window.
450
Comparing this to the N(r) plot for Na-O correlations, the inflection point is not well
451
defined, which indicates that there is not one defined coordination number. The lack of definition
452
of the NNa-O(r) function could be attributed to two things, (i) Na has a relatively small X-ray
453
cross-section compared with the other species within the glass, and (ii) the Na-O local
454
environment may not be as well defined as a SiO4 tetrahedron; for example, there could be a 455
variety of bond lengths and coordination associated with Na-O due to a high degree of disorder
456
around the Na atoms. Marcial and McCloy (Marcial and McCloy, 2019) found that Na, Li, and
457
Ca in aluminosilicate glasses varied considerably in coordination numbers, all of which are
458
modifier species. In the case of Na, it was found that the Na-O coordination number as
459
determined by PDF ranges from two to ten, with the majority being between five- and
seven-460
coordinated, and an average of six-fold coordinated (Marcial and McCloy, 2019).
461
Comparing the coordination numbers calculated by EPSR discussed previously, and the
462
coordination numbers calculated through CrystalMaker, there is some discrepancy in the values.
463
Specifically, the coordination numbers observed through CrystalMaker are consistently lower
464
than those calculated via EPSR and those observed in the N(r) plots (Figure 3). This is due to the
465
fact that EPSR averages the final result over a series of ensembles (configurations), to give an
466
averaged overall coordination number. By contrast, when the atom model is exported to
22
CrystalMaker, the model is only representative of one configuration of the EPSR model. There is
468
value, though, in looking at the CrystalMaker results, as the second coordination sphere can be
469
visualized, as shown in Figure 4.
470
Overall, when taking all methods of PDF analysis represented here, the local structure
471
around Si, Al, and Na does not drastically change in terms of coordination numbers and bond
472
distances. Further insight into the overall glass structure is provided through Raman
473
spectroscopy.
474
4.2 Structure Implications through Raman spectroscopy
475
Three domains of interest can be considered in Figure 8. The first one is the Boson
476
region (< 200 cm-1), where the Boson peak is visible at a Raman shift of ~70 cm-1. Its origin
477
remains controversial but related to vibrations and librations of network-forming polyhedral
478
units (Buchenau et al., 1986; Greaves et al., 2005; Hehlen et al., 2002), such that it is sensitive to
479
changes at medium range order. The second region is located in the range 200-800 cm-1. In this
480
portion of Raman spectra, inter-tetrahedral vibrations of T-O-T (with T a network forming cation
481
like Si) are observed, and for the present compensated glasses they are built from vibrations of
482
rings of tetrahedral units (Galeener, 1982; McMillan, 1984; Sharma et al., 1985). Finally, the last
483
region of interest is located between 800 and 1300 cm-1. In aluminosilicate glasses, bands in this
484
domain can be assigned to T-O stretching vibrations in the polyhedral units building the network
485
framework (McMillan, 1984; Mysen et al., 1982; Virgo et al., 1980). In Ti-bearing glasses, the
486
~890 cm-1 peak is assigned to Ti-O vibrations in the glass network (Mysen and Neuville, 1995).
487
When Ti substitutes for Si, the ~890 cm-1 peak assigned to Ti-O vibrations increases in
488
intensity as expected. The mixture between the two Ti-O and (Si,Al)-O stretching signals is
non-489
linear (Figure 8), rendering any attempts to decompose the signals as a linear mixture of two
23
signals futile. More information actually is embedded in the increase of the signal near ~290
491
cm-1. This band may been assigned to a signal from the alkali metal charge compensator cation
492
in its cage, similarly to what has been previously proposed for network modifier cations (Hehlen
493
and Neuville, 2015). The increase of a similar peak is observed with substitution of Na by K in
494
tectosilicate glasses (Le Losq and Neuville, 2017), a phenomenon accompanied by increasing
495
segregations of alkalis in compensator channels, following the Charge Compensated Random
496
Network (CCRN) model (Greaves and Ngai, 1995). Accordingly, the present observations
497
(Figure 8) may indicate that, in the presence of Ti, the Na environment tends to become more
498
organized, with the appearance of more clusters and channels of Na compensator cations in the
499
glass structure. Considering that nodes of non-network former cationic channels are preferential
500
nucleating locations (Dargaud et al., 2012), such organization and segregation of Na may help
501
explaining the fact that TiO2 is a nucleating agent in aluminosilicate glasses. This will be further 502
promoted by a reorganization of the Na environment in glasses before crystallization, as has
503
already been supported by XANES studies. This is also consistent with the fact that when the
504
TiO2 is increased beyond 15 mol%, the glasses of corresponding composition could not be 505
synthesized due to crystallization upon quench.
506
4.3 Coordination and glass-forming role of Ti
507
Based on the PDF analysis, it was determined that Ti is primarily [4]Ti in the nepheline
508
glass series where Ti is substituted for Si, with [5]Ti or [6]Ti being present in only minor amounts.
509
There is a general lack of data concerning Ti-containing aluminosilicate glasses in literature, but
510
in one study, the local structure of Ti was determined by XANES as the Al content in the glass
511
was increased (Romano et al., 2000). It was found that the addition of Al promotes the formation
512
of [4]Ti through destabilization of [5]Ti pyramids, as the alkali cations are used to charge
24
compensate the Al3+ in [4]Al tetrahedra (Romano et al., 2000). According to the initial PDF
514
analysis conducted here, Al is four-fold coordinated in all glasses, which requires charge
515
balancing cations, such as Na. This could indicate that there is a majority of [4]Ti from the
516
standpoint of Ti content (Henderson and St-Amour, 2004) and presence of Al (Romano et al.,
517
2000).
518
With stoichiometric nepheline glass, NaAlSiO4, the network is theoretically fully 519
polymerized and charge net-neutral, meaning every [4]Al tetrahedron and [4]Si tetrahedron has
520
four bridging oxygen and every [4]Al tetrahedron is charge compensated by one Na atom. If Ti is
521
five-fold coordinated within the glass network, Na would be required for charge compensation,
522
and would be in competition with four-coordinated Al, as stated in (Romano et al., 2000). If Ti
523
were to be four-coordinated, it would have a neutral charge, and there would be no competition
524
for Na cations between Ti and Al for charge compensation. Through the Al-O coordination
525
number calculations via EPSR, Al has a consistent average coordination of four and does not
526
vary with Ti addition. Because there is not an excess of Na, or other charge compensating
527
cations, five-fold coordinated Ti is likely unfavorable. From this standpoint, the average EPSR
528
calculated Ti-O coordination of four, or slightly higher than four, is reasonable.
529
The XAS data support this interpretation. The pre-edge height and energy, as well as the
530
bond length, are consistent with [4]Ti (Farges et al., 1996c). The average pre-edge for all the
531
glasses is similar to the pre-edge in the Ni2.62Ti0.7O4 spinel standard. The XANES region, 532
containing information about the mid-range ordering in the glass around Ti (Farges et al., 1996c;
533
Farges et al., 1997), shows trends suggesting increased ordering with increased Ti concentration,
534
which is consistent with the interpretation of the Raman spectra. It is likely that the
second-535
nearest-neighbors after oxygen in the Ti shell are Na atoms in disordered positions, based on
25
previous modeling of Ti K-edge spectra of silicate glasses (Farges et al., 1996a), at least for the
537
high Ti glasses here. It has also been found in TiO2-Al2O3-SiO2 glasses that, when Ti substitutes 538
into the glass network as a former, it has a stronger affinity for Al than for Si due to AlO4 -539
requiring charge compensation (Kirschen et al., 1999). In the glasses here, since the Na atoms
540
are used to charge compensate the AlO4- units, the local structure then involves [4]Ti connected to 541
AlO4 tetrahedra with interspersed Na atoms, indicating an increase of Ti-O-Al bonding as Ti is 542
substituted for Si. Differences observed in coordination number between the PDF analysis and
543
XAS can be attributed to the fact that the X-ray and neutron total scattering, and subsequent
544
PDF, do not probe one specific atom, but rather look at the glass as a whole, whereas XAS looks
545
specifically at the Ti local environment.
546
The influence of Ti on glass formability is compositionally dependent. For the case of
547
NaAl(Si,Ti)O4 glasses studied here, when subjected to traditional melt-quenching, the glass 548
formation region was found to extend to NaAlTi0.3Si0.7O4. Through PDF analysis, XAS, and 549
Raman spectroscopy, it is believed that for the currently considered NaAl(Si,Ti)O4 system, Ti 550
tends to tetrahedrally coordinate with oxygen and substitutes Si in the lattice; therefore acting as
551
a network former. Through the analysis of EXAFS data, a shift in the second coordination sphere
552
of Ti was observed as the fraction of Ti increased. This could have implications for the
553
crystallization behavior of these systems in the molten state, in addition to the reorganization of
554
the Na environment as suggested by Raman spectroscopy observations.
555
Considering that these systems feature Al/(Si+Ti) = 1, in order to maximize the
556
separation of positively charged AlO4 tetrahedra, Ti would need to substitute directly for Si in 557
the alternating Al-O-Si glass network. The observed tendency for Al to serve as the second
26
nearest-neighbor in glasses with higher Ti/Si ratios is consistent with Loewenstein’s
Al-559
avoidance rule (Loewenstein, 1954).
560
5.0 Conclusion
561This work sought to identify the effect of TiO2 on the structure of nepheline glass 562
(NaAlSiO4) via a systematic substitution for SiO2. Through neutron and X-ray total scattering 563
experiments paired with EPSR atomistic simulations, Raman spectroscopy, and Ti K-edge XAS,
564
the local environments within the glass were determined. Overall, it has been found that the Al
565
and Si local environments, i.e. coordination numbers, remained constant as TiO2 was introduced 566
into the glass. Na coordination showed a non-linear variation in coordination as TiO2 content 567
was increased, with an abrupt change between the NaAlTi0.2Si0.8O4 (0.2Ti-NAS) and 568
NaAlTi0.3Si0.7O4 (0.3Ti-NAS) glasses, with additional changes in the Na environment being 569
observed through Raman spectroscopy. Ti was found, via analysis to of the total scattering data,
570
to be coordinated with, on average, approximately four oxygen atoms. XAS shows essentially
571
four-fold coordinated Ti. There is no definitive indication of six-fold coordinated Ti from any of
572
the techniques utilized in this study, but EPSR simulation may indicate a small contribution of
573
five-fold coordinated Ti. Overall, up to 15 mol% (16 wt%) TiO2 can be substituted for SiO2 in 574
NaAlSiO4 while still maintaining a single-phase glass. 575
Acknowledgements
576Funding for this project was provided through the by the United States Department of
577
Energy (US DOE) Waste Treatment & Immobilization Plant (WTP) Federal Project Office under
578
the direction of Dr. Albert A. Kruger, contract number 89304017CEM000001. A portion of this
579
research used resources at the Spallation Neutron Source (SNS), a US DOE Office of Science
27
(OS) user facility operated by the Oak Ridge National Laboratory (ORNL); neutron scattering
581
work was granted under ORNL SNS IPTS-21702.1. A portion of this research used resources of
582
the Advanced Photon Source (APS), a US DOE OS user facility operated for the DOE OS by
583
Argonne National Laboratory (ANL) under contract DE-AC02-06CH11357; the authors thank
584
Dr. Xiaofeng Guo for use of his beamtime at the APS, Beamline 6-ID-D. A portion of this
585
research used 6-BM of the National Synchrotron Light Source II (NSLSII), user proposal
586
301027, a US DOE OS user facility operated for the DOE OS by Brookhaven National
587
Laboratory (BNL) under contract DE-SC0012704. A portion of this research used resources of
588
the Photon Factory Advisory Committee, with beamtime at the High Energy Accelerator
589
Research Organization (Kō Enerugī Kasokuki Kenkyū Kikō or KEK) facility in Tsukuba, Japan;
590
the support of Yoshihiro Okamoto (Japan Atomic Energy Agency) during the experiment is
591
gratefully acknowledged. This work was, in part, performed in the HADES/MIDAS facility at 592
the University of Sheffield, established with financial support of the University of Sheffield, 593
Department of Business, Energy and Industrial Strategy, and the Engineering and Physical 594
Sciences Research Council under grant EP/T011424/1. JSM also gratefully acknowledges
595
support from the US-UK Fulbright Commission for support during his sabbatical at the
596
University of Sheffield. Parts of this work were supported by IPGP multidisciplinary program
597
PARI, and by Region île-de-France SESAME Grant no. 12015908.
598 599
28
Appendix
600
A. X-ray Total Scattering using Lab-Scale X-ray Diffractometer
601
X-ray total scattering measurements were also performed on a Panalytical X’pert Pro
602
Powder X-ray Diffractometer equipped with a Ag-Kα source at 60 keV and 36 mA and a
603
scintillator detector. Samples were packed in glass capillaries with 1.0 mm O.D. and flame
604
sealed. Data was collected over 25 hours using a Variable Counting Time (VCT) program. Each
605
sample, including an empty capillary, were run using the VCT program to obtain the X-ray total
606
scattering data. Scans were conducted from 2-120° 2θ with a step size of 0.06° 2θ. From 2-40°
607
2θ, one scan was performed, from 38-70° 2θ, 5 scans were performed and summed, and from
68-608
120° 2θ, 10 scans were performed and summed. VCT scan data were converted from total
609
intensity to counts per second (cps) and stitched together using Highscore Plus software. A
610
Bremsstrahlung file, which is X-ray source and instrument specific, was also obtained using a
Si-611
311 single crystal wafer measured using an omega-theta scan. Using GudrunX, the background
612
(attributed to air and container scattering) and the Bremsstrahlung contributions were subtracted,
613
and the Fourier transform was carried out to obtain the g(r), the pair distribution function,
614
discussed previously in the experimental section of this work. The resulting F(Q) and g(r)
615
obtained from the lab-scale XRD measurements are shown in Figure A1. 616
29
617
Figure A1- F(Q) and g(r) obtained through measurements on a lab-scale XRD equipped with a Ag source.
618 619
B. Neutron vs. X-ray Total Scattering Experiments
620
Neutron and X-ray total scattering experiments are complimentary techniques in the way
621
that X-rays and neutrons are able to interrogate different atomic species within the glasses of this
622
study based upon their scattering coefficient, b, and their X-ray cross section, see Table B1.
623
A scattering cross-section relates the probably of a scattering event from a sample
624
(sample dependent) to the number of counts or signal reaching a detector (Darling, 2009). The
625
scattering cross section for neutrons is represented by σtot = 4πb2 where b is the atomic scattering 626
length (Darling, 2009). Neutrons interact with the atom’s nuclei with the scale of the interaction
627
being dependent on the isotope and does not scale with Z. X-rays interact with the electron cloud
628
instead of the nuclei. This results in a Z-dependence with the ray cross section. In this way,
X-629
rays and neutrons can be complementary techniques as neutrons can distinguish between similar
630
Z-elements as distinguish between different isotopes within a sample.
631
In the Ti-containing sodium aluminosilicate glasses in this study, neutron and X-ray total
632
scattering allowed for determination of Ti partial PDF’s and Si partial PDF’s where the use of
633
just X-ray total scattering would have been a limitation. The first peak in the g(r) encompasses
30
Si-O, Ti-O, and Al-O partial PDF’s with little peak resolution. To deconvolute this peak into the
635
partial g(r) functions, neutron scattering was paired with X-ray scattering. X-ray total scattering
636
resulted in a net positive signal, while neutron total scattering resulted in a positive signal for Si,
637
Al, and O contributions, but a negative signal for Ti contributions as Ti is a negative neutron
638
scatterer. It is important to note that all samples were of natural isotopic abundance and the
639
scattering coefficients were calculated as such for analysis and EPSR simulation.
640
Table B1-Neutron scattering length of atomic species within Ti-NAS glasses used in this study. All materials were
641
of natural isotopic abundance. Scattering coefficients were obtained from (Sears, 1992).
642
Atomic Species Coherent Scattering Length, b (fm)
Na 3.63 Al 3.449 Si 4.1491 Ti -3.438 O 5.803 643
Research Data
644Research Data associated with this article can be access at http://dx.doi.org/10.17632/h85yj23ww4.1 645