HAL Id: hal-02594187
https://hal.inrae.fr/hal-02594187
Submitted on 15 May 2020HAL is a multi-disciplinary open access
archive for the deposit and dissemination of sci-entific research documents, whether they are pub-lished or not. The documents may come from teaching and research institutions in France or
L’archive ouverte pluridisciplinaire HAL, est destinée au dépôt et à la diffusion de documents scientifiques de niveau recherche, publiés ou non, émanant des établissements d’enseignement et de recherche français ou étrangers, des laboratoires
The impacts of repeated drought on the aboveground
primary growth of Pinus halepensis Mill. and Quercus
ilex L. in Mediterranean France
C. Didier
To cite this version:
C. Didier. The impacts of repeated drought on the aboveground primary growth of Pinus halepensis Mill. and Quercus ilex L. in Mediterranean France. Environmental Sciences. 2010. �hal-02594187�
CemOA
: archive
ouverte
d'Irstea
CemOA
: archive
ouverte
d'Irstea
CemOA
: archive
ouverte
d'Irstea
Abstract
The Mediterranean basin is forecast to experience warming above the global average with concurrent decreases in precipitation and increases in the frequency of severe drought and heat waves over the course of the 21st century, but the impact of severe and/or repeated drought on the aboveground primary growth of Mediterranean forest trees is not well understood. Architectural analysis of Aleppo pine and holm oak, two widely distributed western Mediterranean tree species, was carried out for trees along an elevation transect. Aleppo pine primary growth was greatly reduced following the 2003 heat wave and four subsequent years of drought. Recovery of most architectural variables was seen after two years without drought. Severe drought in 2007 resulted in minimal primary growth of holm oak, but leaf development recovered the year after drought and recovery appeared to be related to well-timed precipitation after bud burst. Climatic conditions at the low and high sites of the elevation transect appear to impose limits to primary growth and post-drought recovery. The species likely to be favored could not be determined, but it is clear that the expected climate change for the Mediterranean basin will greatly reduce primary growth with implications for Aleppo pine-holm oak forest ecosystem functioning.
CemOA : archive ouverte d'Irstea / Cemagref Keywords: Pinus halepensis Quercus ilex primary growth tree architecture altitudinal transect drought climate change
Résumé
D’ici la fin du 21ème siècle, le bassin Méditerranéen est susceptible de connaître un réchauffement climatique supérieur à la moyenne mondiale avec une réduction des précipitations et une augmentation de la fréquence des sécheresses et canicules. À ce jour, les conséquences des sécheresses sévères et/ou répétées sur la croissance primaire aérienne des arbres ne sont que très peu documentées dans la littérature scientifique. L’analyse architecturale du pin d’Alep et chêne vert, deux essences forestières dominantes de la Méditerranée occidentale, a été réalisée le long d’un transect altitudinal. Les principaux résultats montrent que la croissance primaire du pin d’Alep a significativement diminuée après la canicule de 2003 et s’est maintenue à de très faibles niveaux pour les quatre années suivantes, années qui étaient particulièrement sèches. La récupération de la plupart des variables architecturales est survenue après deux ans sans sécheresse. La sécheresse de 2007 a occasionné une croissance minimale du chêne vert, mais le développement foliaire a repris l’année suivante avec les précipitations ponctuelles après l’éclatement des bourgeons. Les conditions climatiques aux sites de basse et haute altitude semblaient limiter la croissance primaire et la récupération après la sécheresse. À la lumière des résultats obtenus, nous ne pouvons affirmer quelle espèce du chêne vert ou du pin d’Alep sera favorisée. Toutefois, il est certain que le changement climatique réduira considérablement la croissance primaire avec des implications pour le fonctionnement de tout l’écosystème.
CemOA : archive ouverte d'Irstea / Cemagref Mots clefs: Pinus halepensis Quercus ilex croissance primaire architecture des arbres transect altitudinal sécheresse
Foreward
This research was carried out from February to August 2010 at the Cemagref (Institut de
recherche pour l'ingénierie de l'agriculture et de l'environnement) under the direction of
Drs. Michel Vennetier and François Girard. This research was executed within the context of a larger several-year project coordinated among various research institutions. The research was funded by the French National Research Agency (DROUGHT+ project, Nº ANR-06-VULN-003-04), the French Ministry for Ecology, Energy and Sustainable Development (GICC – REFORME project, nº MEED D4E CV05000007), the Conseil Général des Bouches-du-Rhône (CG13), ECCOREV Research Federation (FR3098), and the Cemagref.
The Cemagref is a French national research institution that works on land and water management. The research carried out at the Cemagref is aimed at developing new scientific understanding and technical innovations for managers, policy makers, and businesses to respond to current issues in the domains of natural resources management, regional planning, and land use. The research is focused on surface water resources, aquatic and terrestrial ecosystems, rural areas, water technologies, agricultural systems, and food security all within the context of sustainable development.
This project was carried out with the Cemagref at le Tholonet (outside of Aix-en-Provence), where work is concentrated on water and rural spaces in four different working groups: Hydrology and Hydraulic Engineering, Hydrobiology, the Irrigation Equipment Research and Testing Laboratory, and Mediterranean Ecosystems and Risks (EMAX). The objective of work within EMAX is the development of decision-making tools for policy makers and managers for sustainable management within the context of climate change. The research of EMAX is further separated in two axes: analysis of wildfire risk and Mediterranean vegetation dynamics in response to disturbance, with this project being implemented under the latter.
CemOA
: archive
ouverte
d'Irstea
Acknowledgements
At the outset, I would be remiss not to acknowledge several individuals without whom this work would never have been possible. First off, I owe a deep debt of gratitude to Michel Vennetier. Having already filled a different project opening that I applied for, he offered me the opportunity to work on this project and took a risk in accepting an American graduate student trying to navigate the French research world. Without his insight, experience, and advice I might still be on page one.
I would also like to thank François Girard, who in sharing his office with me has been subjected to incessant questions and my lousy French accent and grammar on a daily basis for the past 6 months. His support during each phase of this project, particularly in data analysis and thesis editing has been invaluable.
I could not forget to mention Aminata N’Diaye Boubacar, Roland Estève, and Willy Martin who have been a tremendous help both in the field and in the laboratory.
Finally, the encouragement and good humor of all of my colleagues at the Cemagref has been much appreciated.
CemOA
: archive
ouverte
d'Irstea
Table of Contents
Abstract... V Foreward ...VII Acknowledgements... VIII List of Tables ... XI List of Figures...XII 1. Introduction... 12. Materials and methods ... 5
2.1 General research area... 5
2.2 Thermal-hydrological transect... 5 2.3 Site descriptions... 6 2.3.1 Saint-Mitre... 6 2.3.2 Font Blanche... 6 2.3.3 Siou Blanc... 6 2.4 Climate datasets ... 7 2.5 Sampling ... 8
2.6 Tree architectural organization ... 8
2.7 Morphological markers... 9
2.8 Measurements ... 10
2.8.1 Description of primary growth ... 10
2.8.2 Leaf area ... 11
2.8.3 Phenological observations ... 11
2.9 Statistical analyses ... 12
3. Results... 12
3.1 Characterization of climate... 12
3.1.1 Evolution of climatic conditions at study sites ... 12
3.1.2 Climate, 2006–2009... 14
3.2 Aleppo pine... 15
3.2.1 Comparison of primary growth between sites, 1995–2009 ... 17
3.2.2 Evolution of primary growth between the three sites, 1995–2009 ... 18
CemOA
: archive
ouverte
d'Irstea
3.3.2a Decomposition of the time-period: evolution of primary growth, 1995–2003
...19
3.3.2b Decomposition of the time-period: evolution of primary growth, 2005–2009 ...20
3.3 Holm oak ...22
3.3.1 Shoot growth and branching, 2007–2009...22
3.2.2 Foliar architecture component...26
3.4 Aleppo pine and holm oak inter-site primary growth comparison, 2007–2009....30
4. Discussion ...31
4.1 Effects of repeated drought on primary growth of Aleppo pine ...33
4.2 Effects of drought on primary growth of holm oak, 2007–2009...37
4.3 Differential species response to drought ...39
4.4 Consequences of reduced primary growth for Mediterranean pine-oak forest ...41
5. Conclusion...42 6. References ...45 CemOA : archive ouverte d'Irstea / Cemagref
List of Tables
Table 2.1 General site characteristics. ... 6 Table 3.1 Annual precipitation and percent deviation from the average at each site, 1995–2009. *=Years where annual precipitation was at least 30% below the 1961– 1990 average at one or more sites... 13 Table 3.2 Mean values with standard deviation for the periods 1995 to 2009, 1995 to 2003, and 2005 to 2009. Letters indicate results of posthoc multiple comparison tests. ... 18 Table 3.3 Recapitulation of the inter-site differences for primary growth of Aleppo pine and holm oak from 2007 to 2009, compiled from the hypothesis and multiple comparison test results of each species... 30
CemOA
: archive
ouverte
d'Irstea
List of Figures
Figure 2.1 Map of research area and study sites. ...7 Figure 2.2 Morphological markers for holm oak: a) swelling, bud scar, and opposite branching indicating the separation of the present year and previous year growth units and b) contrasting alternate branching pattern, and morphological markers for Aleppo pine: c) the tight clustering of bud scale scars indicating the separation between two consecutive years of growth and d) the spaced scales indicating the new growth unit is from the same year. ...10 Figure 3.1. Monthly precipitation (gray bars), average maximum temperature (triangles), and average minimum temperature (squares) from 2006 to 2009 for a) Siou Blanc, b) Font Blanche, and c) Saint-Mitre. ...15 Figure 3.2 Results of principal component analysis on shoot length, number of cycles, number of branches, and number of needles for 1995 to 2008 at a) Siou Blanc, b) Font Blanche, and c) Saint-Mitre. ...17 Figure 3.3 Evolution of the shoot development variables: shoot length, number of growth units, and number of branches at Saint-Mitre (dashed line/triangles), Font Blanche (solid black line/diamonds), and Siou Blanc (gray line/squares) from 1995 to 2009. Vertical lines denote critical years in the time series used to separate the 15 year series into pertinent intervals...21 Figure 3.4 Evolution of the foliar development variables: number of needles and needle length at Saint-Mitre (dashed line/triangles), Font Blanche (black line/diamonds), and Siou Blanc (gray line/squares), 1995-2009. Vertical lines denote critical years in the time series...22 Figure 3.5 Box plots of lengths of the primary axis at each site from 2007 to 2009, with whiskers indicating the 10th and 90th percentiles and points indicating outliers. The table presents the differences between the years at each site. Groups with different letters represent a significant difference (p<0.05) in a posthoc Nemenyi test...24 Figure 3.6 Box plots of lengths of secondary axes of holm oak at each site, from 2007 to 2009 with whiskers indicating the 10th and 90th percentiles and points indicating outliers. The table presents the differences between the years at each site. Groups with different letters represent a significant difference (p<0.05) in a posthoc Nemenyi test...25 CemOA : archive ouverte d'Irstea / Cemagref
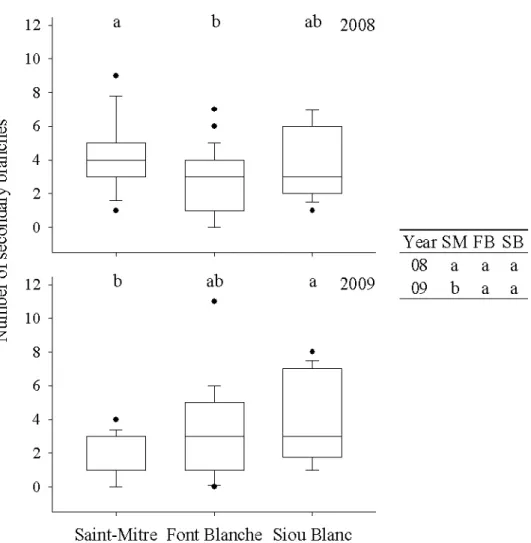
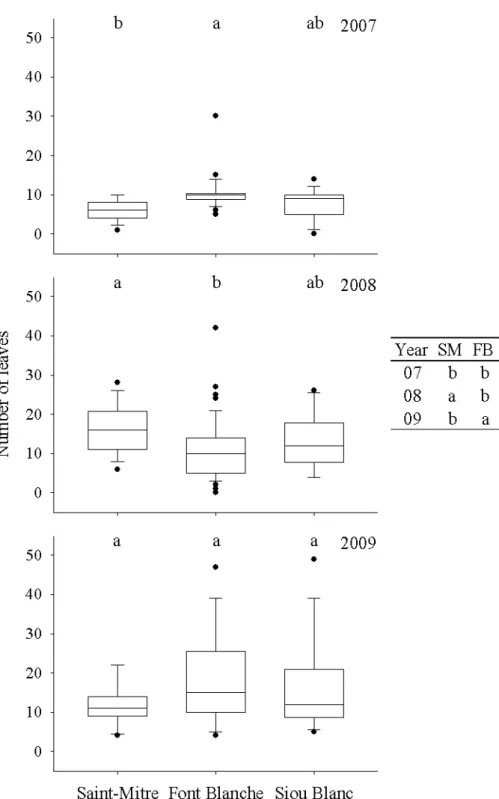
Figure 3.7 Box plots of secondary branching of holm oak at each site in 2008 and 2009 with whiskers indicating the 10th and 90th percentiles and points indicating outliers. The table presents the differences between the years at each site. Groups with different letters represent a significant difference (p<0.05) in a posthoc Nemenyi test... 26 Figure 3.8 Box plots of number of leaves of holm oak at each site from 2007 to 2009 with whiskers indicating the 10th and 90th percentiles and points indicating outliers. The table presents the differences between the years at each site. Groups with different letters represent a significant difference (p<0.05) in a posthoc Nemenyi test... 28 Figure 3.9 Box plots of holm oak laminar leaf area at each site from 2007 to 2009 with whiskers indicating the 10th and 90th percentiles and points indicating outliers. The table presents the differences between the years at each site. Groups with different letters represent a significant difference (p<0.05) in a posthoc Nemenyi test. ... 29
CemOA
: archive
ouverte
d'Irstea
CemOA
: archive
ouverte
d'Irstea
1. Introduction
Over the past decades, climate change has become a primary concern for the international community (Bernstein et al., 2007). Since 1850 when datasets for recorded measurements begin, 11 of the years from 1995 to 2006 were ranked among the 12 warmest years as of 2007 (Bernstein et al., 2007), and the decade from 2000–2009 was ranked as the warmest decade (WMO 2010). In Europe, the climate of the late 20th and early 21st centuries is almost certainly the warmest of the last 500 years, and the 20th century was on average 0.5ºC warmer than the previous four centuries (Luterbacher et al., 2004). In France, the recent warming of approximately 0.9ºC for annual average and 1.2ºC for annual average minimum over the past century has surpassed both European and global averages (Lebourgeois et al., 2001; Moisselin et al., 2002).
To date, climate change has been noted primarily by global warming. However, climate projections also forecast changes in precipitation patterns as well as changes in the frequency of more severe climatic events: decrease in cold days, nights, and frosts; increase in hot days and nights; increase in heat waves; and increase in heavy rainfalls (Bernstein et al., 2007). Overall, Europe is expected to experience warming above the global average. This warming will likely manifest as increased winter low temperatures in northern Europe and increased summer high temperatures in southern Europe and the Mediterranean region (Christensen et al., 2007). Under various models and scenarios, France and the Mediterranean region will experience a general warming at a rate faster than in most other areas in the world, an increase in winter precipitation, a decrease in annual precipitation, an increase in length and intensity of summer drought conditions, and an increase in the intensity and frequency of extreme climatic events (Gibelin and Déqué, 2003; Déqué, 2007). At the current development and population growth trajectory, the world is on course for the most pessimistic of the climate scenarios (Nakicenovic and Swart, 2000), which gives more urgency to the need to study the potential impacts of climate change.
The Mediterranean basin represents a climatic transition zone between temperate and tropical zones, has a mountainous topography, and has a 10,000-year history of anthropogenic disturbance (Blondel and Aronson 1999; Quézel and Médail, 2003). The
CemOA
: archive
ouverte
d'Irstea
Mediterranean climate is characterized by high temperatures associated with low rainfall in summer and cool to cold wet winters. This distinct climate, geology, and history of human impact have favored the development of abundant plant and animal biodiversity (Cowlings, 1996; Blondel and Aronson, 1999). However, land use change and habitat destruction have reduced the extent of primary vegetation to less than 5% of its original surface leading this region to be classified as one of the world biodiversity ‘hotspots’ (Myers et al., 2000). In addition to impacts of land use change, ample evidence from across the globe exists for the ecological impacts of recent climate change (Walther et al., 2002; Parmesan, 2006), and tree species in the Mediterranean region may already be responding to warming as well (Peñuelas and Boada, 2003). The increase in summer water stress resulting from increased temperatures and decreased precipitation in a region already characterized by summer drought is susceptible to decrease tree growth in Mediterranean areas (Rathgeber et al., 2000; Borghetti et al., 2004; Ogaya et al., 2003; Sardans and Peñuelas, 2007). Raising temperature may lead to phenologic lags (Kramer et al., 2000), particularly in the beginning and the end of the growing season.
Large, woody shrubs and trees are the principal structural component in Mediterranean ecosystems and are essential to ecosystem functioning (Vallejo et al., 2005). In the western Mediterranean basin, Aleppo pine (Pinus halepensis Mill.) and holm oak (Quercus ilex L.) are two of the most important tree species. Aleppo pine covers approximately 3.5 million hectares in the Mediterranean basin from northern Sahara to southern France (Quézel, 1986). Aleppo pine grows typically on marls or calcareous marls, but also on compact fissured limestone substrates, as found in Provence. Its optimal range is situated at low elevation in semi-arid to sub-humid conditions, with annual rainfalls ranging from 350 to 550 mm and mean annual temperatures from 16 to 19°C, where it its highly competitive due to its high resistance to water stress (Quézel and Médail, 2003). Nonetheless, it grows faster with 650 to 800 mm of annual precipitation where human impact and fires released competition from more adapted species (Vennetier et al., 2010a). Holm oak is present from southern to northern France but it covers about 600,000 hectares (92% of its total surface area) in Mediterranean France alone (Inventaire Forestier National, 2008). Holm oak can be found on almost any substrate, but is less favored on marls and calcareous marls. It grows optimally in
CemOA
: archive
ouverte
d'Irstea
sub-humid to humid conditions and is restricted when annual precipitation drops below 400–450mm (Rodà, 1993; Quézel and Médail, 2003).
Water availability is the main limiting factor to vegetation and production in Mediterranean ecosystems (Le Houerou, 2005; Allard et al., 2008). The mild Mediterranean climate results in a long growing season, which is disrupted by summer drought. Mediterranean vegetation is adapted to this pattern primarily through two strategies: drought avoidance or drought resistance. The vegetation dynamic in Aleppo pine-holm oak forests derives from the different drought adaptation strategies of the two species: Aleppo pine is a drought avoider and holm oak is a drought resistor. In response to water deficits, Aleppo pine quickly closes the stomata on its needles to maintain positive water potential and then enters into dormancy when drought becomes limiting. This species has the tendency to form several growth units (flushes) in the same growing season, a process called polycyclism (Barthélémy and Caraglio 2007; Girard et al., 2010a), which confers to a tree a significant advantage in contrast to monocyclic species, particularly in the Mediterranean area where the growing season is split in two parts by drought. Therefore, Aleppo pine does not experience the drought
per se; rather it is able to become dormant and then resume growth via polycyclism
when favorable conditions return. In contrast, holm oak maintains physiological activity (i.e. stomatal conductance) at reduced levels during drought via osmotic adjustment to withstand low water potentials (Kyriakopoulos and Richter, 1991) and deep rooting systems that can also take advantage of fissures in the bedrock to reach groundwater up to more than 15 meters (Rodà et al., 1999). Although this species is also known to be polycyclic, this feature does not confer the same advantage as with Aleppo pine since it is not a consistent feature of holm oak growth and the extant shoots on holm oak would have still been exposed to drought stress. Of the two, Aleppo pine is considered to be the better drought adapted. Several studies have suggested that the anticipated increase of summer drought will induce different responses from these two tree species, thereby potentially altering the dynamic in mixed Aleppo pine-holm oak forests (Resco de Dios et al., 2007; Gaucherel et al., 2008).
To date, studies on the drought impacts on these two species have focused mainly on radial (secondary) growth (Ogaya and Peñuelas 2007; Vila et al., 2008; Gea-Izquierdo et al., 2009), leaf gas exchange (Rambal et al., 2003; Asensio et al., 2007), and
CemOA
: archive
ouverte
d'Irstea
photosynthetic capacity (Chaves et al., 2002). Scant literature exists on the potential impacts of climate change on primary growth, that which develops from meristematic tissue and includes such growth processes as shoot elongation, branching, leaf production, bud development, flowering, fruit production, and fine root production. Whereas secondary growth has storage and structural functions, primary growth is the mechanism by which the plant explores and interacts with its environment. As opposed to secondary growth, i.e. radial trunk growth, which is linked to site conditions, primary growth is largely dependent on recent climatic conditions (López-Serrano et al., 2005). This makes primary growth an interesting aspect of tree growth for investigating the response of a given tree species to climate. Few recent studies have begun to explore the impacts of drought events on Aleppo pine canopy architecture (Girard et al., 2010b), but there is no work as of yet on the effects of long-term or severe isolated drought on holm oak architecture.
Europe witnessed an exceptional heat wave and drought in 2003 (Rebetez et al., 2006), and extensive studies have shown the impact of this severe climatic event on forest production (Ciais et al., 2005, Granier et al., 2007). Additionally, the years from 2004 to 2007 in the French Mediterranean have imposed repeated drought conditions beyond the normal climate pattern with an impact measured by a fast forest flora turnover (Vennetier and Ripert, 2009). The years after 2007 have seen a return to normal precipitation patterns. There exists, therefore, a substantial opportunity to study the direct and delayed impact of drought on the primary growth of Aleppo pine and holm oak and their potential recovery in recent years using retrospective methods
The objective of this study is to describe and compare the aboveground primary growth of Aleppo pine and holm oak in response to changing climate through retrospective canopy architecture analysis. Following the climate forecasts for the Mediterranean, both the effects of chronic moderate drought and acute intense drought are considered. The main hypothesis is that Aleppo pine will exhibit stronger primary growth under long-term xeric conditions and the corollary that holm oak will have better primary growth under long-term mesic conditions. A secondary hypothesis is that holm oak will be more severely affected by temporary and severe drought than Aleppo pine.
CemOA
: archive
ouverte
d'Irstea
2. Materials and methods
2.1 General research area
The research was carried out at three sites in mixed Mediterranean forest of southern France in the Bouches-du-Rhône (13) and Var (83) departments. The sites were selected based on the relative homogeneity of their edaphic characteristics and forest cover, as determined by a bioclimatic model for the region (Vennetier, 2007a; Vennetier et al., 2008). All of the sites had thin rocky clay soils on limestone parent material with exposed bedrock and deep fissures. Slope at each site is less than 5%. The dominant class of trees originated from either a past fire or from logging and is even-aged: 55 years +/-2 for Aleppo pine and oak coppice. Some old scattered pines remaining from the parent stand originated from progressive pasture abandonment during the previous centuries and are 90 to 120 years, as are probably the oak stumps. Each site had about the same density of 15 trees/100m2. The species present at each site are characteristic of the western Mediterranean basin: the broad-leafed phillyrea (Phillyrea latifolia L.) and the Kermes oak (Quercus coccifera L.) are dominant in the understory, and Aleppo pine and holm oak are dominant in a discontinuous overstory.
2.2 Thermal-hydrological transect
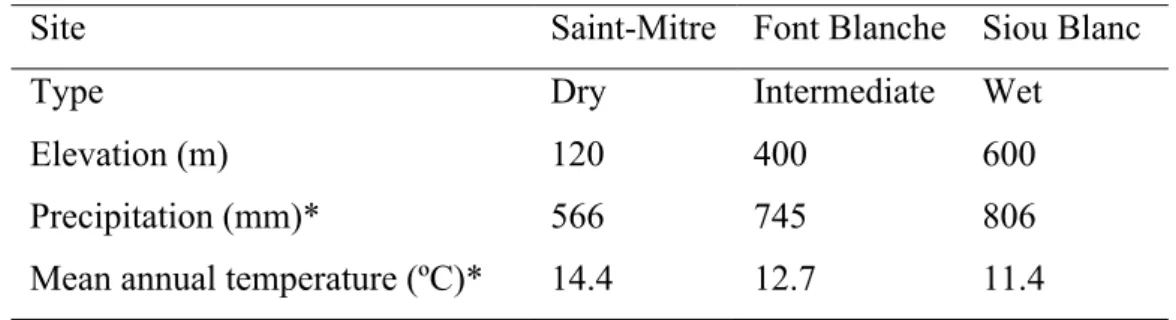
The basic element of the experimental design in this study was the comparison of different sites comprising similar compositions of Mediterranean forest but located along an elevation transect. This transect then provided a range of climatic conditions distributed along a thermal-hydrological transect with temperature decreasing and precipitation increasing with elevation. Previous work in the French Mediterranean has demonstrated the utility of such an approach (Vennetier et al 2005a). For our study, three sites (Table 2.1) were selected at the lower, middle, and upper segments of the transect, which constitute a dry, an intermediate, and a wet site relative to one another. The precipitation gradient then allowed observations of long-term adaptations and differences between sites under different climate regimes.
CemOA
: archive
ouverte
d'Irstea
Table 2.1 General site characteristics.
Site Saint-Mitre Font Blanche Siou Blanc
Type Dry Intermediate Wet
Elevation (m) 120 400 600
Precipitation (mm)* 566 745 806
Mean annual temperature (ºC)* 14.4 12.7 11.4 *1961 – 1990 average
2.3 Site descriptions 2.3.1 Saint-Mitre
The first site was Saint-Mitre-les-Remparts (43° 27’ N, 5o 02’ E) located near the western shore of l’Etang de Berre in the Bouches-du-Rhône department (Figure 2.1). Saint-Mitre was a low elevation site at 120m, characterized by mixed Aleppo pine and holm oak in the canopy stratum with Kermes oak dominating the understory and an absence of Phillyrea latiflolia, replaced by Phillyrea angustifolia. This site was categorized as a thermo-Mediterranean bioclimatic type (Le Houerou, 2005).
2.3.2 Font Blanche
The second site was located in the Departmental Forest of Font Blanche (43° 14’ N, 5° 40’ E), approximately 25km east of Aubagne in the Bouches-du-Rhône department (Figure 2.1). Font Blanche was the medium elevation site in the transect at 400m and is categorized as a meso-Mediterranean bioclimatic type (Le Houerou, 2005). This forest at this site was also characterized by mixed Aleppo pine and holm oak, but differs from Saint-Mitre by a decrease in Kermes oak abundance and the presence of
Phillyrea latifolia in the understory.
2.3.3 Siou Blanc
The third site was situated on the Siou Blanc plateau (43°14’N, 5°53’E), near the village of Cuges-les-Pins in the Var department (Figure 2.1). Siou Blanc was the highest elevation site in the transect at 600m and is categorized as a supra-Mediterranean
CemOA
: archive
ouverte
d'Irstea
Castellet, and precipitation data came from La Roquebrussanne in addition to these two stations. Temperature was corrected using a lapse rate of 0.55ºC/100m, and a weighted average for temperature and precipitation according to distance from the research site was used. The climate conditions at each site were then used to infer drought intensity.
2.5 Sampling
Sampling was done during January and February of 2009 and 2010 when both species are dormant. A sample was defined as a branch harvested following four criteria for both species: 1) from a dominant tree, 2) in the upper part of the canopy, 3) with full sunlight exposure, and 4) constituting at least the entirety of the last three years of growth. Three samples were taken from five different trees at each site.
In a previous study at the Cemagref (Girard et al 2010a, b; Ouarmim, 2009), Aleppo pine branches were harvested from 2006 to 2009 to reconstruct primary growth for the period 1995-2008. The sampling followed the same aforementioned criteria with the exception of sampling branches with many more years of growth. Pairs of dominant branches (exposition in the crown: north and south) were cut at three crown positions (top, intermediate and low-level when alive, aged respectively 15, 25 and 35 years) on six dominant Aleppo pines per site. Successive branch sampling from 2005 to 2009 (seven trees per year) was made to consider branch and axes autocorrelation and expand the studied time span (Girard et al. 2010b). The data compiled were also used in this study to supplement the current sampling campaign and to provide a longer and updated time-series dataset. To reconcile the differences between sampling procedures, all Aleppo pine samples were classified into three vigor groups, and the samples used in this study were categorized as vigorous to give a homogeneous base for comparison among sites and years. Previous work at the Cemagref (Girard et al. 2010b) has found Aleppo pine architectural structure and development to be closely related to vigor, and this therefore allows the use of data from samples harvested under different criteria.
2.6 Tree architectural organization
A hierarchical approach derived from Barthélémy and Caraglio (2007) was used
CemOA
: archive
ouverte
d'Irstea
used in this system: A1 was the name given to the principal axis of growth, A2 was the name given to secondary branching off of the principal axis, and A3 was the name given to secondary branching off of an A2 shoot. An A4 classification also exists, but it was quite uncommon (<1%) and was excluded from the analysis. Starting from the base of the A1 from 2007, each growth unit (growth cycle) was systematically classified in a database according to its age and architectural category.
2.7 Morphological markers
Morphological markers characteristic to each species like size and density of bud scales and bud scars at the base of the growth units, lateral axes, and position of cones were used to reconstruct tree primary growth for a) the last three years and b) for the last 10 to 15 years on each branch, following methods described by Sabatier et al. (2006) and Pardos et al. (2003) which proved to be also relevant for Aleppo pine (Girard et al. 2010b).
Aleppo pine is regularly polycyclic, but provides clear morphological markers to determine the extent and age of growth units. Two characters were used to identify the start of the growth unit. The first was the presence of a segment of the shoot with scales and no needles (Figure 2.2). Aleppo pine only produced secondary branches and cones at the beginning of growth units, which also provided a clear indication when present. For holm oak, the analogs of the same two key morphological markers identify the start of the growth unit. The terminal bud-scale scar defined the base of the growth unit, and the extent of the stem between two consecutive bud scars was the complete growth unit (Figure 2.2). The other marker was the presence of nearly opposite secondary branching that often, but not always, was found directly below the terminal bud-scale scar. This was contrasted by the obvious alternate branching pattern found along the length of the growth unit.
The age of each growth unit was determined by counting back from the most recently produced shoot. The color of the shoot and the degree of lignification were reasonably good characters to determine the difference between a growth unit from the present year and one from the previous year. For Aleppo pine, a tight clustering of the needleless scales indicated a growth unit produced at the beginning of the year, as opposed to a
CemOA
: archive
ouverte
d'Irstea
branches (for holm oak), and number of leaves or needles. Flush length was measured to the nearest millimetre from the bottom of the basal branches or bud-scale scar to the base of the next growth unit using a digital calliper (±0.01mm). Numbers of branches and leaves were simply the counts (0 if absent), and each fascicle bearing needles was considered “one leaf” despite Aleppo pine usually having two needles per fascicle. The leaves were stripped from the stem, and the stems and leaves were separated by year.
2.8.2 Leaf area
Ten leaves of each species were taken, at random but roughly representative, from both the present and previous year for leaf area calculation. For holm oak, the leaves were scanned and analyzed using WinFolia (Regent Instruments Inc., 2007). This program provided measures for the area of each individual leaf as well as length, width, perimeter, and a form coefficient. Before scanning, the leaves were soaked in water for two days for turgescence. This step was necessary to give additional flexibility to the otherwise rigid leaves, which in turn provided a better estimate of leaf area when the leaves were compressed between the scanning surface and the scanner cover. Measurement of Aleppo pine leaf area followed a different protocol to take into account the trapezoidal form of the needles. The length of the needle (one per fascicle with the assumption that needles born from the same fascicle are identical) was measured with a ruler to the nearest millimetre, and width and thickness were measured at the middle of the needle with a digital calliper (±0.01mm). Needle length was used as a proxy for needle area, as width and thickness can be contorted by twisting as needles grow.
2.8.3 Phenological observations
At Font Blanche, 9m-high scaffolding was installed in 2007 and 2008 to access the top-level foliage of 17 mature Aleppo pines and 16 holm oak of the same generation (55 ±1 years). On each tree, three to six branches close to the scaffold were chosen using the same protocol for branch sampling for biweekly phenologic observations. Phenological stages (phenological phases or phenophases) were identified using a procedure proposed by DuMerle and Mazet (1983). Budburst, leafing-out, flowering, and fruiting processes were scaled over several stages ranging for from stage A (winter stage) when the bud was completely closed to stage E (maturation) when the new leaves
CemOA
: archive
ouverte
d'Irstea
were fully developed and mature. The onset of twigs was checked by visual observations of the apical buds. Flush length was measured to the nearest millimeter with a ruler, every week or 15 days from February 12th to November 15th 2008, from January 28th to December 15th 2009 and from January 28th to December 15th 2010.
2.9 Statistical analyses
Comparisons between sites and between years were performed with ANOVA (F-statistic) and with a Kruskal-Wallis test (H-(F-statistic) in the case of data that did not meet the criteria for parametric tests (normality and heteroscedasticity), and residuals in ANOVA were visually checked for homogeneity. If only two groups were compared, a Mann-Whitney test (U-statistic) was used in lieu of Kruskal-Wallis. Posthoc multiple comparison tests were done to determine differences between groups using a Tukey test with ANOVA and a Nemenyi test (Nemenyi, 1963) if necessary after the Kruskal-Wallis test. Analysis of trends was done via linear regression models. Multivariate relationships between individual years, climate, and primary growth variables were explored using Principle Component Analysis (PCA) methods. Statistical analyses were performed using R software (R Development Core Team, 2010).
3. Results
3.1 Characterization of climate
3.1.1 Evolution of climatic conditions at study sites
Analysis of the climate datasets suggests that climate has already begun to warm at the three study sites. At all three sites, the average annual temperature has increased (R2=0.52, 0.26 and 0.61, p<0.001 at Saint-Mitre, Font Blanche, and Siou Blanc respectively). The average temperature of the last 10 years was 1.2–1.3ºC greater than the 1961–1990 average at each site. Over the study period 1995–2009, annual temperature of every year at each site, with the exception of 1995 and 1996 at Font Blanche, was above the 1961–1990 average annual temperature. The average summer maximum temperature was also above the 1961–1990 average for every year of the study, except for Siou Blanc and Saint-Mitre in 1997 (0.09 and 0.01ºC below average
CemOA
: archive
ouverte
d'Irstea
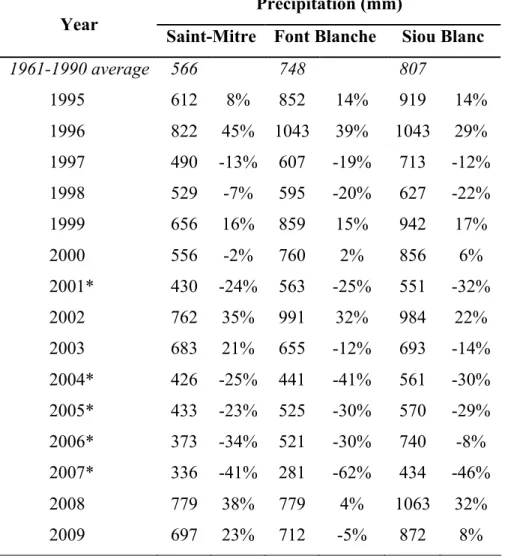
respectively). No significant trends were observed at any of the sites for precipitation, which was found to be highly variable from one year to another. However over the study period, many years experienced precipitation well below the historic 30-year average (Table 3.1). At Font Blanche the largest deficits were from 2004 to 2007, during which all years were at least 30% below average. At Siou Blanc 2001, 2004, 2005, and 2007 were at least 29% below average. At Saint-Mitre, these years were 2001 and 2004 to 2007 (all at least 23.5% below average). The largest deficit for all sites was 2007 when Saint-Mitre, Font Blanche, and Siou Blanc were 41%, 62%, and 46% below average respectively, with very little rain from March to October. In actual amounts of rainfall however, a 46% decline in rainfall at Siou Blanc is approximately the same as a 24% decline at Saint-Mitre (2007 at Siou Blanc versus 2001 at Saint-Mitre for example).
Table 3.1 Annual precipitation and percent deviation from the average at each site, 1995–2009. *=Years
where annual precipitation was at least 30% below the 1961–1990 average at one or more sites.
Precipitation (mm) Year
Saint-Mitre Font Blanche Siou Blanc 1961-1990 average 566 748 807 1995 612 8% 852 14% 919 14% 1996 822 45% 1043 39% 1043 29% 1997 490 -13% 607 -19% 713 -12% 1998 529 -7% 595 -20% 627 -22% 1999 656 16% 859 15% 942 17% 2000 556 -2% 760 2% 856 6% 2001* 430 -24% 563 -25% 551 -32% 2002 762 35% 991 32% 984 22% 2003 683 21% 655 -12% 693 -14% 2004* 426 -25% 441 -41% 561 -30% 2005* 433 -23% 525 -30% 570 -29% 2006* 373 -34% 521 -30% 740 -8% 2007* 336 -41% 281 -62% 434 -46% 2008 779 38% 779 4% 1063 32% 2009 697 23% 712 -5% 872 8% CemOA : archive ouverte d'Irstea / Cemagref
3.1.2 Climate, 2006–2009
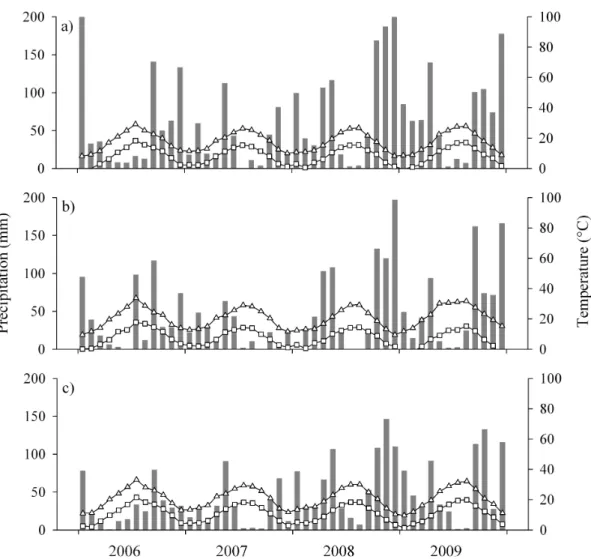
The monthly precipitation and temperatures (min and max) for each site from 2006 to 2009 (Figure 3.1) demonstrated a similar climate pattern for all three sites with overall differences in the amplitude of each measurement among the three sites. As expected for the elevation gradient, rainfall was generally greatest at Siou Blanc and lowest at Saint-Mitre and temperatures were typically highest at Saint-Mitre and lowest at Siou Blanc. The climate of Font Blanche tended to vary between the two extremes. For all three sites, 2006 was a dry year during the first part of the growing season (Figure 3.1); Siou Blanc and Font Blanche were relieved of drought conditions with late summer and autumn rainfalls but Saint-Mitre received little precipitation until the end of 2007 and beginning of 2008 (exceptions being September 2006 and May 2007). As mentioned, 2007 was a particularly extreme drought year for all sites. Additionally, the water deficit at Font Blanche remained in late summer and fall but improved at Saint-Mitre and Siou Blanc. Furthermore, the rainfall in spring 2008 occurred in a few heavy but isolated events in which most precipitation was lost due to runoff, and Font Blanche remained under drought conditions until September 2008. Years 2008 and 2009 were more or less a return to historic precipitation levels and patterns, with Saint-Mitre in fact receiving above average rainfall.
CemOA
: archive
ouverte
d'Irstea
Figure 3.1. Monthly precipitation (gray bars), average maximum temperature (triangles), and average
minimum temperature (squares) from 2006 to 2009 for a) Siou Blanc, b) Font Blanche, and c) Saint-Mitre.
3.2 Aleppo pine
The PCA showed that all variables and years were distributed primarily along the x-axis with an overall negligible vertical dispersal (Figure 3.2). The first factor (x-axis) explained between 70 and 92% of variance, and therefore indicated that a strong relationship existed between years and the architectural features. At all three sites shoot length, number of growth units and branching were closely related. At Saint-Mitre and Font Blanche, the number of needles was slightly offset from the other three variables, although in the same general direction in each case. On the contrary, the number of needles was distinctly separate from shoot length, number of growth units, and branching at Siou Blanc. Number of needles at Siou Blanc was strongly aligned with the
CemOA
: archive
ouverte
d'Irstea
y-axis (24% of variance), and number of needles at Saint-Mitre and Font Blanche was also offset along the vertical axis. This implied that the y-axis may represent foliar primary growth as opposed to the shoot growth/branching on the x-axis, and that number of needles was influenced by slightly different factors than the other architecture variables. The effect of the y-axis was however negligible at Saint-Mitre where it accounted for only 5% of the explained variance. Furthermore, an approximate grouping was also apparent for the years. For Saint-Mitre and Font Blanche, the years from 1995 to 2003 were located on the left half of the PCA plane and 2004 to 2008 on the right half (Figure 3.2b,c). At Siou Blanc the years 2000 to 2002 were also clustered with the years 2005 to 2008 (Figure 3.2a). Years on the right side of the PCA plane were years when a severe drought occurred (Table 3.1) whereas those on the left were years with favorable precipitation. Therefore, a relationship appears to exist between drought and architectural development.
CemOA
: archive
ouverte
d'Irstea
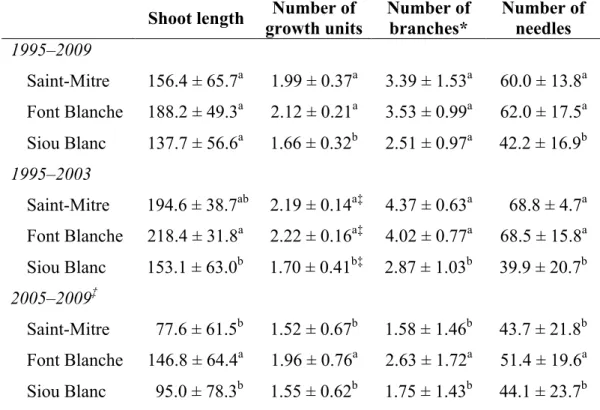
Blanche on the low and middle part of the thermal-hydrological gradient and Siou Blanc at the upper end. Using the distinction among years apparent from the PCA, the period 1995 to 2009 was separated into two intervals: 1995 to 2003 and 2005 to 2009. In grouping the years, 2004 was excluded as it was a transitional year between the two periods, but it was relevant in comparisons between individual years. For the period 1995 to 2003, all architecture variables showed the same result: Aleppo pines at Saint-Mitre and Font Blanche produced longer shoots, more growth units, more branches, and more needles than at Siou Blanc (Table 3.2). Finally, for the period 2005 to 2009, all architecture variables showed the same result but with a different pattern: trees at Font Blanche had longer shoots, higher number of cycles, higher branching and more needles than at Saint-Mitre and Siou Blanc.
Table 3.2 Mean values with standard deviation for the periods 1995 to 2009, 1995 to 2003, and 2005 to
2009. Letters indicate results of posthoc multiple comparison tests.
Shoot length growth units Number of Number of branches* Number of needles 1995–2009 Saint-Mitre 156.4 ± 65.7a 1.99 ± 0.37a 3.39 ± 1.53a 60.0 ± 13.8a Font Blanche 188.2 ± 49.3a 2.12 ± 0.21a 3.53 ± 0.99a 62.0 ± 17.5a Siou Blanc 137.7 ± 56.6a 1.66 ± 0.32b 2.51 ± 0.97a 42.2 ± 16.9b 1995–2003 Saint-Mitre 194.6 ± 38.7ab 2.19 ± 0.14a‡ 4.37 ± 0.63a 68.8 ± 4.7a Font Blanche 218.4 ± 31.8a 2.22 ± 0.16a‡ 4.02 ± 0.77a 68.5 ± 15.8a Siou Blanc 153.1 ± 63.0b 1.70 ± 0.41b‡ 2.87 ± 1.03b 39.9 ± 20.7b
2005–2009‡
Saint-Mitre 77.6 ± 61.5b 1.52 ± 0.67b 1.58 ± 1.46b 43.7 ± 21.8b Font Blanche 146.8 ± 64.4a 1.96 ± 0.76a 2.63 ± 1.72a 51.4 ± 19.6a Siou Blanc 95.0 ± 78.3b 1.55 ± 0.62b 1.75 ± 1.43b 44.1 ± 23.7b *Branches does not include 2009
‡Variables compared with non-parametric tests
3.2.2 Evolution of primary growth between the three sites, 1995–2009
For each character related to shoot elongation and production, Aleppo pine appeared to be experiencing a reduction in primary growth between 1995 to 2009 at all
CemOA
: archive
ouverte
d'Irstea
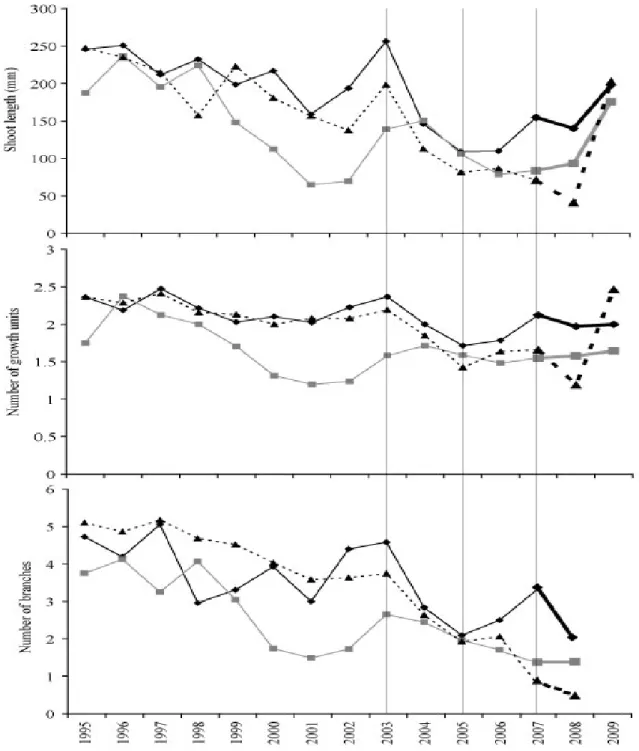
negative trend existed for shoot length (R2=0.50, 0.42, and 0.29 respectively at p<0.05) and number of branches (R2=0.92, 0.35, and 0.61 respectively at p<0.05). A significant negative trend in number of growth units was seen at Saint-Mitre (R2=0.31, p<0.05) and Font Blanche (R2=0.34, p<0.05). The number of needles showed no tendency at Font Blanche or Siou Blanc but demonstrated a negative trend over the 15-year period at Saint-Mitre (R2=0.45, p<0.01). The trends were generally weak to moderate in terms of explained variance. When the means for each component of canopy architecture at each site were displayed as a time series (Figures 3.3 and 3.4), it was apparent that there were several years acting as inflection points in the lines for each site across all variables, thereby contributing to weak R2. These years were 2003, 2005, 2007, and to a lesser extent 2001. The distinction of these years also supported the separation of the entire time series into two intervals as determined by the PCA.
3.3.2a Decomposition of the time-period: evolution of primary growth, 1995–2003
At Font Blanche no significant trends were found during the period 1995–2003 for any architectural traits. Although, an apparent decline in shoot length at Siou Blanc was present between 1998 and 2001, the upturn of values in 2002 and 2003 reduced any tendency over the entire interval. Saint-Mitre was the only site where Aleppo pine showed a significant moderate negative trend for shoot length (R2=0.40, p<0.05). Trees at Saint-Mitre and Siou Blanc both had moderate negative trends for number of growth units (R2=0.42 and 0.47 respectively, p<0.05). Pines at Saint-Mitre and Siou Blanc also showed stronger negative trends for branching (R2=0.85 and 0.54, p<0.001 and 0.05 respectively). A Kruskal-Wallis test with posthoc Nemenyi test was used to compare all 15 years at each site for each architectural trait. Within the interval 1995-2003, most years were not significantly different from one another. At Saint-Mitre, no significant differences were seen among any of the years from 1995 to 2003 for any of the architecture variables. At Font Blanche, there was also no difference in number of cycles or number of branches and few differences in shoot length and number of needles (2001 and 2003). Trees at Siou Blanc, on the contrary, presented a different pattern showing a significant decline in all architecture measures from 1998 to 2001 and subsequent recovery in 2003. Despite not being significantly superior to most other years in the period from 1995-2003, 2003 was a productive year at all sites in absolute terms. CemOA : archive ouverte d'Irstea / Cemagref
3.3.2b Decomposition of the time-period: evolution of primary growth, 2005–2009
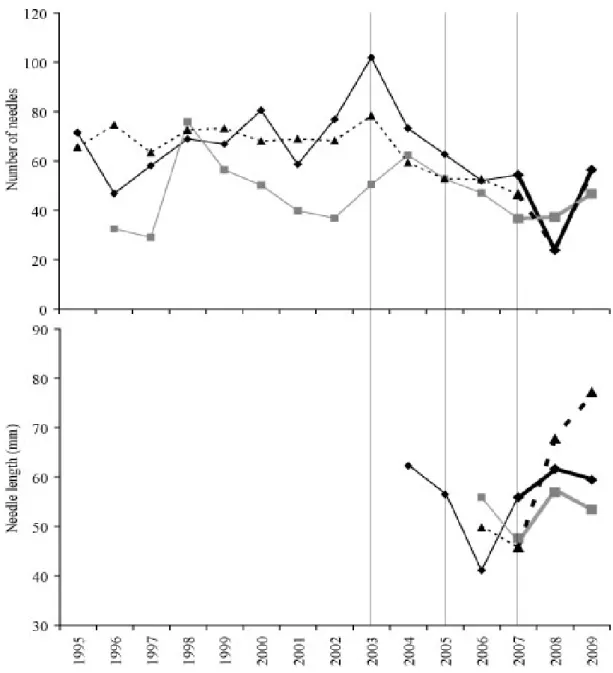
A significant decline of architectural development following 2003 set it apart from the entire 15-year time series at Saint-Mitre and Font Blanche in comparison with Siou Blanc where architectural development declined after 1998. Architecture variables at Saint-Mitre and Font Blanche usually declined significantly from 2003 to 2004, but the greatest effect occurred between 2003 and 2005, again confirming the position of 2004 as a transitional year between the peak in 2003 and the minimum in 2005. The last interval of the time-series, 2005 to 2009, was marked by two general patterns in primary growth: stabilization and recovery. All three sites exhibited both trends in at least one aspect of architecture. Over 2005 to 2007, shoot length, number of branches, and number of leaves of pines at Saint-Mitre stabilized at a significantly lower level than the 1995–2003 interval. All variables except needle length were at a significant minimum in 2008 and shoot length, number of cycles, and number of needles recovered in 2009. Needle length at Saint-Mitre showed large and significant increases in 2008 and 2009 while all other architecture variables were at a minimum for the entire 15 years. Architectural development of trees at Font Blanche stabilized from 2005 to 2008, and at a level significantly lower than the 1995 – 2003 period for shoot length and number of branches. A slight recovery appeared in 2007 for all variables, but was halted in 2008. Shoot length, number of needles, and needle length recovered in 2009. At Siou Blanc, a general stabilization of primary growth was seen over 2005 to 2009 with branching and number of needles being lower than the 2003/2004 maximum and a recovery of shoot length in 2009. CemOA : archive ouverte d'Irstea / Cemagref
Figure 3.3 Evolution of the shoot development variables: shoot length, number of growth units, and
number of branches at Saint-Mitre (dashed line/triangles), Font Blanche (solid black line/diamonds), and Siou Blanc (gray line/squares) from 1995 to 2009. Vertical lines denote critical years in the time series used to separate the 15 year series into pertinent intervals.
CemOA
: archive
ouverte
d'Irstea
Figure 3.4 Evolution of the foliar development variables: number of needles and needle length at
Saint-Mitre (dashed line/triangles), Font Blanche (black line/diamonds), and Siou Blanc (gray line/squares), 1995-2009. Vertical lines denote critical years in the time series.
3.3 Holm oak
3.3.1 Shoot growth and branching, 2007–2009
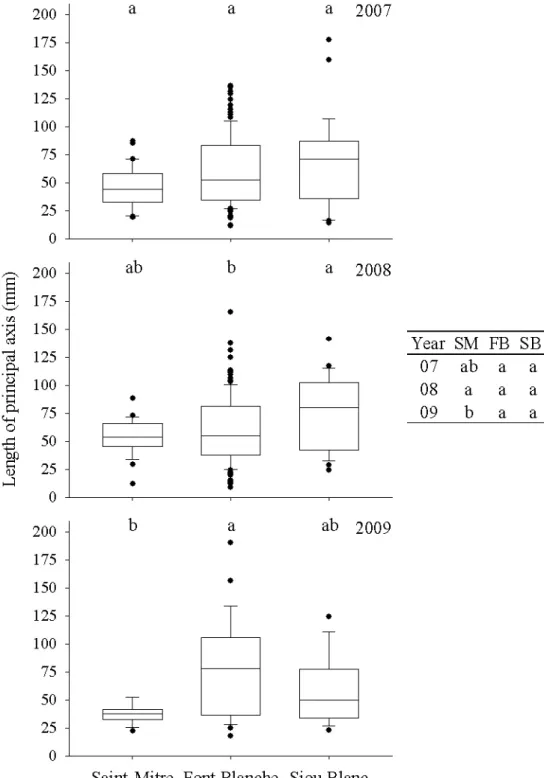
In 2007, holm oak showed no differences in principal axis length (A1) among the sites (Figure 3.5) but the Kruskal-Wallis test gave a result near the threshold at
p=0.07. The length of the A1 also demonstrated the effect of the variability of holm oak
primary growth: although no significant change occurred at any site from 2007 to 2008, trees at Siou Blanc were shown to have produced longer A1 than at Font Blanche.
CemOA
: archive
ouverte
d'Irstea
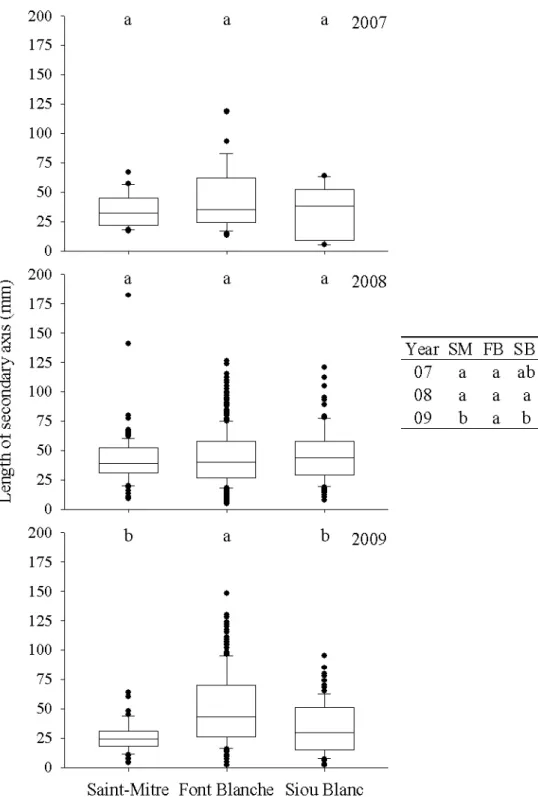
Saint-Mitre. The difference in 2009 was due to a significant decrease at Saint-Mitre from 2008 to 2009. The Kruskal-Wallis test of the three years at Font Blanche was near the threshold (p=0.07). The length of the secondary axis (A2) was different among sites only in 2009, when holm oak at Font Blanche produced longer A2 than either Saint-Mitre or Siou Blanc (Figure 3.6). This, however, was not due to an increase in the A2 length at Font Blanche in 2009 but rather a decrease in A2 length from 2008 to 2009 at Saint-Mitre and Siou Blanc. As with the A1 length, variability was generally lower at Saint-Mitre, but paradoxically the maximum value for the length of A2 was found at this site in 2008. Additionally, the variability of all sites was lower in 2007 than in 2008 or 2009. CemOA : archive ouverte d'Irstea / Cemagref
Figure 3.5 Box plots of lengths of the primary axis at each site from 2007 to 2009, with whiskers
indicating the 10th and 90th percentiles and points indicating outliers. The table presents the differences between the years at each site. Groups with different letters represent a significant difference (p<0.05) in a posthoc Nemenyi test.
CemOA
: archive
ouverte
d'Irstea
Figure 3.6 Box plots of lengths of secondary axes of holm oak at each site, from 2007 to 2009 with
whiskers indicating the 10th and 90th percentiles and points indicating outliers. The table presents
the differences between the years at each site. Groups with different letters represent a significant difference (p<0.05) in a posthoc Nemenyi test.
Branching from the previous year’s A1 was found to be an important part of total secondary branching, comprising approximately 40-60% of the total, except for Sainte-Mitre where it was only 8% in 2009. Branching was therefore compared for 2008 and
CemOA
: archive
ouverte
d'Irstea
2009 for branches developing from both the present and previous year’s A1 (Figure 3.7). Differences for branching were present only at Saint-Mitre, where more secondary branches were produced than at Font Blanche in 2008; due to a decrease in branching from 2008 to 2009 at Saint-Mitre, holm oak produced fewer branches here than at Siou Blanc in 2009.
Figure 3.7 Box plots of secondary branching of holm oak at each site in 2008 and 2009 with whiskers
indicating the 10th and 90th percentiles and points indicating outliers. The table presents the
differences between the years at each site. Groups with different letters represent a significant difference (p<0.05) in a posthoc Nemenyi test.
3.2.2 Foliar architecture component
Leaves produced on branches originating from the principal axis of the previous year had no significant bearing on the results of comparisons. Therefore, we analyzed the number of leaves produced on the A1 of the same year and its secondary branches.
CemOA
: archive
ouverte
d'Irstea
the number of leaves produced by holm oak was more responsive among sites and years than shoot and branching architectural characters (Figure 3.8). In general, a contrasting pattern was present at Saint-Mitre than at Font Blanche and Siou Blanc. 2007 was a low for leaves produced at all sites. The number of leaves increased in 2008 and dropped again in 2009 at Saint-Mitre. Conversely, at Font Blanche and Siou Blanc no change occurred from 2007 to 2008, but significantly more leaves were produced at both sites in 2009 in comparison with 2007. By the end of the 3-year period, however, no differences among sites were present in the number of leaves. The variability of the number of leaves at Saint-Mitre was lower than at Font Blanche and Siou Blanc and was lower in 2007 than in 2008 and 2009.
CemOA
: archive
ouverte
d'Irstea
Figure 3.8 Box plots of number of leaves of holm oak at each site from 2007 to 2009 with whiskers
indicating the 10th and 90th percentiles and points indicating outliers. The table presents the
differences between the years at each site. Groups with different letters represent a significant difference (p<0.05) in a posthoc Nemenyi test.
The laminar leaf area showed less of a distinct pattern than other architecture variables. Leaf area was not different among the sites in 2007 or in 2009 (Figure 3.9). Also, an inconsistent response of holm oak leaf area in 2008 among sites and between years at
CemOA
: archive
ouverte
d'Irstea
each site suggested that 2008 was a transitional year between 2007 and 2009. Nonetheless, the exceptional laminar leaf area in 2008 at Saint-Mitre implied that holm oak at this site expressed a distinctly different growth response than at the other two sites.
Figure 3.9 Box plots of holm oak laminar leaf area at each site from 2007 to 2009 with whiskers
indicating the 10th and 90th percentiles and points indicating outliers. The table presents the differences between the years at each site. Groups with different letters represent a significant difference (p<0.05) in a posthoc Nemenyi test.
CemOA
: archive
ouverte
d'Irstea
3.4 Aleppo pine and holm oak inter-site primary growth comparison, 2007–2009
Aleppo pine primary growth was favored at Font Blanche in 2007, but holm oak primary growth was overall not different among sites (Table 3.3). Taking into account the inter-annual differences at each site in addition to the differences among sites, Aleppo pine primary growth was particularly low in 2008 at Saint-Mitre, but holm oak at Saint-Mitre had better growth than other years and among sites for all architectural components except shoot development. In 2009, Aleppo pine growth was generally favored at Saint-Mitre and Font Blanche, whereas holm oak growth was favored at Font Blanche and Siou Blanc and was exceptionally low at Saint-Mitre. The growth response of holm oak and Aleppo pine over 2007–2009 showed more or less the same tendency at Font Blanche and Siou Blanc but an opposing tendency at Saint-Mitre.
Table 3.3 Recapitulation of the inter-site differences for primary growth of Aleppo pine and holm oak
from 2007 to 2009, compiled from the hypothesis and multiple comparison test results of each species
Species response among different sites Architectural
component Aleppo pine Holm oak 2007
Shoot length SM and SB < FB No differences Polycyclism SM and SB < FB –
Branching (SM < FB) = SB No differences Number of leaves (SM < FB) = SB No differences Leaf length and area (SM < FB) = SB (SM < FB) = SB
2008
Shoot length SM < SB < FB SM and FB < SB Polycyclism SM < SB < FB –
Branching (SM < FB) = SB (SM > FB) = SB Number of leaf SM < FB and SB (SM > FB) = SB Leaf length and area SM and FB > SB SM > FB and SB
2009
Shoot length No differences (SM < FB) = SB Polycyclism (SM > SB) = FB –
Branching – (SM < SB) = FB
Number of leaves (FB > SB) = SM No differences Leaf length SM > FB and SB No differences
CemOA
: archive
ouverte
d'Irstea
4. Discussion
Although the primary growth response of holm oak was somewhat unclear considering the high architectural variability and the constraints of a three-year study period, primary growth was indeed limited at all sites during 2007 and post-2007 primary growth demonstrated divergent patterns at each site. This decline in growth in recent years is corroborated by other work documenting decline in primary and secondary growth of forest species in the French Mediterranean after the extreme heat wave and drought in 2003 and through the subsequent drought years (Vennetier el al., 2007b). The final two years of the study period were the first years of regular to favorable precipitation since 2002, which offers an insight into the multi-year effect of repeated drought and the potential for recovery from prolonged drought. Contrary to holm oak, the response of Aleppo pine architectural growth was clear: a significant decline of all architectural variables was observed following the 2003 heat wave. It was not evident for all architecture variables at all sites due to the effects of year-to-year variation. However, the fact that most architecture measures for the period 2005–2009 were often significantly lower than the more productive years prior to 2003 if not from the entire 1995–2003 period demonstrated the reduced primary growth during the latter portion of the study period. Those assumptions were then confirmed by the PCA calculation.
When considered in conjunction with the climatic data for the study period, PCA results indicated a strong relationship between climate and primary growth. The equal age of the trees and edaphic homogeneity of the sites eliminates the natural decline of growth with age as a confounding factor and the potential effects of heterogeneous site characteristics. This thus leaves the climate of the individual years as a cause of the observed differences in primary growth between sites and over the years. The segregation of years in the PCA plane corresponds well to years with either favorable or drought conditions defined on an annual basis. The years from 1995 to 2003 were grouped due to ample rainfall and warm temperature that was well timed during the growing season. Year 2003 also fell into this category because the heat wave and drought began in May after most growth was already finished. The years after 2003, and
CemOA
: archive
ouverte
d'Irstea
2000 to 2002 at Siou Blanc, were all years of repeated drought stress beginning from May 2003 and lasting to 2007 (SM and SB) or 2008 (FB). Although 2008 was a year of favorable climate for tree growth, architecture still suffered from the lasting impacts of successive drought years. Year 2009 also had abundant precipitation. The years were either positively or negatively correlated to architectural development because of the influence of previous and present year’s climate and the seasonal distribution of precipitation on primary growth.
Other studies by our research group have shown the importance of the distribution of precipitation and temperature during critical periods for tree architectural development and the effect of both the preceding year’s (n-1) climate as well as that of the current year (n) on primary growth (Barthélémy and Caraglio, 2007; Thabeet et al., 2009; Girard et al., 2010b). Therefore, climate of year (n-1) and of year (n) will be useful in examining how the two species respond to isolated and repeated drought, and the distribution of climate parameters during these two periods will be useful in determining the actual drought experienced and the subsequent effect of drought on each species according to their respective drought adaptation strategy and phenology. For Aleppo pine, spring and fall precipitation of year (n-1) and fall precipitation of year (n) have a positive effect on all architecture variables, and spring and fall temperature of year (n-1) have a negative effect on shoot length and number of growth units (Girard et al., 2010b). The influence of climate parameters on holm oak architectural development has not been directly studied to date, but similar assumptions on the influence of past and present year climate are made.
Primary growth derives from two basic processes: preformation and neoformation. The former depends mostly on climate of previous year, the latter on only the climate of the present year (Caraglio et al., 1997). At the basic entity of primary growth, the bud, organs may be preformed; that is to say, the number of growth units or the number of leaves are predetermined in the bud before the start of the growing season. In the case of preformation, the development of the embryonic preformed organs in the bud occurs when the bud develops during the previous year’s growing season thus the climate of the previous year plays an integral role in the preformation. In fact, the predetermined organs will develop independently of the current year climate (Taiz and Zeiger, 2006).
CemOA
: archive
ouverte
d'Irstea
formation of branches, fruiting, and leaf development and thus is impacted by the current year climate. To demonstrate this, two growth units may be preformed the year (n-1), but an ‘unprogrammed’, a neoformed, third growth unit (even a fourth) may develop under favorable autumn climatic conditions. The primary growth of Aleppo pine is known to be highly preformed, but the balance between neoformation and preformation of holm oak remained unknown in the literature. Therefore, the primary growth response of holm oak may also be informative (but not conclusive) of the level of preformation and neoformation for the measured architecture variables.
4.1 Effects of repeated drought on primary growth of Aleppo pine
Architectural development of trees at Saint-Mitre and Font Blanche was found to be similar for the entirety of the period from 1995 to 2003, and dissimilar for 2005 to 2009, thereby implying that the primary growth response of pine at each site became dissociated after the 2003 climate event. The decoupling, with Font Blanche remaining superior and Saint-Mitre becoming more similar to Siou Blanc, might indicate the potential for a shift in habitat suitability at the hottest and driest parts of Aleppo distribution in French Mediterranean under continued drought as has been witnessed for Scots pine (Vennetier et al., 2005b; Thabeet et al., 2009). The shift in primary growth at Saint-Mitre may have begun much earlier. The cause and validity of the decline remained uncertain though. Precipitation was generally not limiting during from 1995 to 2003 at Saint-Mitre, thus it is possible that high temperatures in excess of the historic average had begun to induce water stress. The regression model demonstrated the trend over the entire period, but the high variability between years resulted in no inter-annual differences, which casts doubt on the accuracy of the trend.
Primary growth remained relatively stable at the three sites until 1999. These years were also the best for primary growth, although there is some uncertainty in the first two to three years due to small sample sizes. The decline at Siou Blanc began after 1998 and may have been due to two factors. First, heavy snowfall early in years 1998, 1999, and 2001 at Siou Blanc and Font Blanche (mainly 1999 and 2001) affected architectural development. The 1999 snow break was particularly important at Siou Blanc and the effects on trees lasted until 2003. In 2001, more than 50 cm of snow covered the two sites, breaking a significant proportion of living branches since Aleppo pine architecture
CemOA
: archive
ouverte
d'Irstea