HAL Id: cea-02999225
https://hal-cea.archives-ouvertes.fr/cea-02999225
Submitted on 10 Nov 2020
HAL is a multi-disciplinary open access
archive for the deposit and dissemination of
sci-entific research documents, whether they are
pub-lished or not. The documents may come from
teaching and research institutions in France or
abroad, or from public or private research centers.
L’archive ouverte pluridisciplinaire HAL, est
destinée au dépôt et à la diffusion de documents
scientifiques de niveau recherche, publiés ou non,
émanant des établissements d’enseignement et de
recherche français ou étrangers, des laboratoires
publics ou privés.
Bindings of hMRP1 transmembrane peptides with
dodecylphosphocholine and dodecyl-β-d-maltoside
micelles: A molecular dynamics simulation study
Stéphane Abel, Anaïs Lorieau, Béatrice de Foresta, François-Yves Dupradeau,
Massimo Marchi
To cite this version:
Stéphane Abel, Anaïs Lorieau, Béatrice de Foresta, François-Yves Dupradeau, Massimo Marchi.
Bind-ings of hMRP1 transmembrane peptides with dodecylphosphocholine and dodecyl-β-d-maltoside
mi-celles: A molecular dynamics simulation study. Biochimica et Biophysica Acta:Biomembranes,
Else-vier, 2014, 1838, pp.493-509. �10.1016/j.bbamem.2013.10.012�. �cea-02999225�
Bindings of hMRP1 transmembrane peptides with
dodecylphosphocholine and dodecyl-
β-
D
-maltoside micelles: A
molecular dynamics simulation study
Stéphane Abel
a,⁎
, Anaïs Lorieau
a, Béatrice de Foresta
b, François-Yves Dupradeau
c, Massimo Marchi
aaCommissariat à l'Energie Atomique et aux Energies Alternatives, DSV/iBiTEC-S/SB2SM/LBMS & CNRS UMR 8221, Saclay, France b
Commissariat à l’'Energie Atomique et aux Energies Alternatives, DSV/iBiTEC-S/SB2SM/LPM & CNRS UMR 8221, Saclay, France
c
Laboratoire des glucides, UFR de Pharmacie & CNRS FRE 3517, Université de Picardie Jules Verne, Amiens, France
a b s t r a c t
a r t i c l e i n f o
Article history: Received 5 May 2013
Received in revised form 17 September 2013 Accepted 14 October 2013
Available online 21 October 2013
Keywords:
Transmembrane peptide fragment Dodecylphosphocholine Dodecyl-β-D-maltoside micelle Molecular dynamics hMRP1 (ABCC1) Peptide–micelle interaction
In this paper, we describe molecular dynamics simulation results of the interactions between four peptides (mTM10, mTM16, TM17 and KTM17) with micelles of dodecylphosphocholine (DPC) and dodecyl-β-D -maltoside (DDM). These peptides represent three transmembrane fragments (TM10, 16 and 17) from the MSD1 and MSD2 membrane-spanning domains of an ABC membrane protein (hMRP1), which play roles in the protein functions. The peptide–micelle complex structures, including the tryptophan accessibility and dynamics were compared to circular dichroism andfluorescence studies obtained in water, trifluoroethanol and with micelles. Our work provides additional results not directly accessible by experiments that give further support to the fact that these peptides adopt an interfacial conformation within the micelles. We also show that the peptides are more buried in DDM than in DPC, and consequently, that they have a larger surface exposure to water in DPC than in DDM. As noted previously by simulations and experiments we have also observed formation of cation–π bonds between the phosphocholine DPC headgroup and Trp peptide residue. Concerning the peptide secondary structures (SS), wefind that in TFE their initial helical conformations are maintained during the simulation, whereas in water their initial SS are lost after few nanoseconds of simulation. An intermediate situation is observed with micelles, where the peptides remain partially folded and more structured in DDM than in DPC. Finally, our results show no sign of β-strand structure formation as invoked by far-UV CD experiments even when three identical peptides are simulated either in water or with micelles.
© 2013 Elsevier B.V. All rights reserved.
1. Introduction
The human multidrug resistance associated protein 1 (hMRP1) is a large (1531 AA, 190 kDa) integral membrane protein (MP) that belongs to the superfamily of ATP binding cassette (ABC) proteins. These MPs are ubiquitous, and are found in various organisms and tissues. For example, in human, there are 48 known ABC transporters, classified into seven subfamilies, as a function of their sequences and struc-tures[1]. hMRP1 was discovered in 1992[2]and is thefirst member of the third ABC subfamily, which has thirteen members (http://www. nutrigene.4t.com/humanabc.htm). This MP subfamily includes ten transporters in addition to the chloride ion channel ABCC7/CFTR and the sulfonylurea receptors ABCC8–9/SUR1–2, involved in different genetic pathologies (e.g. cystic fibrosis [3] or persistent hyper-insulinemic hypoglycemia of infancy[1,4,5]). The hMRP1 protein is expressed in various tissues at moderate level, and is capable of transporting various chemical compounds such as amphiphilic anionic conjugates (e.g. glutathione (GSH) conjugates[6]) or drugs across the
membrane. The hMRP1 protein, as most of its homologues, is also over-expressed and associated in many drug resistance[7]pathologies or in cancer (see for instance references[1,8,9]).
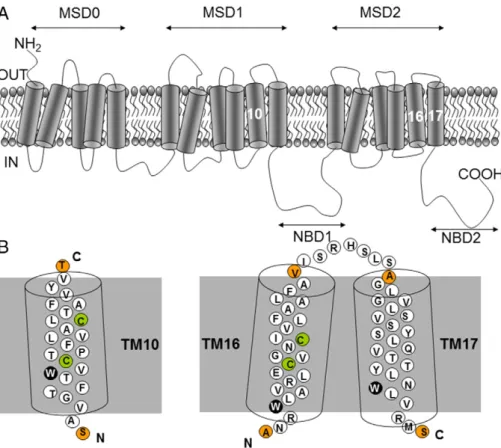
The current topology of hMRP1 (http://www.uniprot.org/uniprot/ P33527) supported by epitope insertions[10,11] and glycosylation mutation analysis[12]is shown inFig. 1A. It includes an extracytosolic N-domain, followed by the two membrane spanning domains (MSD0 and MSD1), the first NBD domain (NBD1), the third membrane spanning domain (MSD2) and the last NBD domain (NBD2) associated with the intracytosolic C-terminus. The MSD0 domain is composed of five transmembrane (TM) fragments (TM1–5), whereas the MSD1 and MSD2 domains have six TM fragments each, numbered TM6–11 and TM12–17, respectively. The presence of MSD0 is a specific feature of ABCC transporters (namely ABCC2, ABCC3, ABCC6 and ABCC8–10). However, its proper role is still in debate (e.g.[13]).
High resolution crystal structures for ABC transporters were initially determined for prokaryotic species[14]. Among these transporters, two of them were exporters as hMRP1: the bacterial lipid transporter MsbA
[15]and the Sav1866 transporter from Staphylococcus aureus[16,17]
both crystallized in two states (i.e. “open” or “closed”). Recently a three-dimensional structure of hMRP1 was proposed based on the
two-⁎ Corresponding author.
E-mail address:stephane.abel@cea.fr(S. Abel).
0005-2736/$– see front matter © 2013 Elsevier B.V. All rights reserved. http://dx.doi.org/10.1016/j.bbamem.2013.10.012
Contents lists available atScienceDirect
Biochimica et Biophysica Acta
dimensional crystal structure obtained from cryoelectron microscopy data[18]. Based on the Sav1866 transporter X-ray structure obtained at the 3.0 Å resolution (PDB code: 2HYD), molecular models of the hMRP1 MSD1–NBD1 and MSD2–NBD2 domains have been constructed[19–21]. In the absence of known structures determined at a high resolution for MP and to obtain complementary information on their structural and dynamical properties, experimental investigations are carried out on isolated TM fragments in membrane mimic environment (see for instance [22–26] and references cited therein). This “divide and conquer” approach reviewed by Bordag and Keller[27]is based on the “two stages” model proposed initially in early 90s by Popot and Engelman [28,29] according to which the folding of proteins in a membrane environment is achieved in two steps. First independent α-helical TM segments are formed and inserted across the membrane. Then, the TM segments get associated and may reorient within the membrane. More recently additional stages[30]and a thermodynamic framework[31]have been added to the model to complete the MP folding process and TM peptide-bilayer interactions.
Here, we will focus on structural properties of three TM peptides that belong to the MSD1 and MSD2 domains: TM10, TM16 and TM17 (Fig. 1B). These three fragments play important roles in the hMRP1 functions. For example, mutations of two threonine (T550A and T556A), a tryptophan (W553A), and a proline (P557A) in TM10 modify the drug-resistance profile of the protein or decrease the transport of various organic substrates[32–35]. Moreover, the TM16 and TM17 fragments are connected by a small extracytoplasmic loop of seven residues (I1220–S1226), and are part of the TM transport pore[19,20]. These fragments contain polar amino acid residues that also play a role in protein expression and/or in the transport of endogenous metabolite[35–37]. Indeed, mutations of the ionizable residues (for example, R1197E, R1202(G,L) and E1204L) have impact on protein expression, substrate binding and/or transport [37], whereas the
mutation of a single tryptophan W1246A in TM17 affects the estradiol 17-β-D-glucuronide transport [36]. To obtain information on these functional fragments, native or slightly modified peptides (i.e. mTM10, mTM16, TM17 and KTM17, seeTable 1) which all contain a single tryptophan residue, were studied by one of us (BdF) by means of far-UV circular dichroism and tryptophanfluorescence spectroscopy in various environments, such as water, trifluoroethanol (TFE), and micelles of dodecylphosphocholine (DPC) and dodecyl-β-D-maltoside (DDM) (Fig. 2)[38–40]. It was expected that the hydrophobicity of these peptides, quantified by their interfacial partitioning free energy from water to bilayer (ΔGuof−7.44, −3.33, −6.23 and −5.41 kcal mol−1, respectively[38–41]), could lead to different binding and localization of the peptide in the micelle. Indeed, it was shown that these TM peptides remained partially folded inα-helix and were located mainly in the micelle polar head groups, the precise location of the peptide in the micelle depending on the nature of the detergent[38–40].
Despite the important information gleaned from these experimental studies, the exact mechanism that governs the hMRP1 peptide–micelle interactions remains not well understood especially at the atomic level.
Fig. 1. Topology of the hMRP1 membrane protein. (A) Functional unit of hMRP1 containing the three membrane-spanning domains (MSD0–2) and the two nucleotide-binding domains (NBD1–2). (B) Isolated native sequences of the TM10, TM16 and TM17 fragments studied in this work with their corresponding tryptophan (W), cysteine (C) and N- and C-termini residues highlighted in black, green and orange circles, respectively (see main text for details).
Figure redrawn and adapted from references[38–40].
Table 1
Sequences and formal charges of the TM peptides composed of 25 amino acid residues, extracted from human MRP1 (hMRP1) and studied in this work. Peptide residues are numbered according to hMRP1 wild type sequence (GenBank accession no.2828206). SeeFig. 1for localizations of these TM fragments in the hMRP1 protein.
Name Sequence Formal
charge (qe−) mTM10 Ac-S546AVGTFTW553VS555TPFLVALS563TFAVYVT570-Am 0 mTM16 Ac-A1195NRW1198LAVRLES1205VGNS1209IVLFAALFAV1219-Am +1 TM17 Ac-A1227GLVGLSVSYSLQVTTYLNW1246LVRMS1251-Am +1 KTM17 Ac-K1227GLVGLSVSYSLQVTTYLNW1246LVRMS1251-Am +2
To gain insights on these aspects, we have carried out explicit molecular dynamics (MD) simulations of these same peptides (Table 1) solvated in pure water, TFE and in micelles of DPC and DDM. TFE is known to stabilize[42]or promote[43,44]α-helical structures of peptides and small proteins through intra-peptide hydrogen bonds (IHB) and hydrophobic interactions[45]. DPC and DDM were also chosen because they are widely used as detergents for purification, solubilization and stabilization for many MPs (i.e. not only for hMRP1, as previously discussed)[38–40,46–53]. In particular, DPC is often used with NMR spectroscopy (see for instance references [47,48,54–58]), since it forms small (with Naggin the range of 50–60 [57–59]), and stable micelles as well as protein–detergent complexes with fast tumbling times, which lead to observable signals in NMR. Moreover, with a zwitterionic head group similar to that of phosphatidylcholine, DPC is a good tool to model eukaryotic membrane interface and favors amphipathic peptide structuring (e.g. see references[47,50]). Finally, DDM with its sugar headgroup is considered as a “mild” (i.e. not denaturing) detergent, which is widely used to maintain MP in their native states while they are crystallized[59,60]. Thus, the main focus of this work is to investigate the effect of the peptide–detergent interactions on the structural features of micelle complexes and to highlight their dynamics of self-aggregation.
2. Simulation methods 2.1. Molecular topologies
The initial helical conformations of the hMRP1 TM peptides TM10, TM16 and TM17 were obtained from the work of DeGorter et al.[19]. To simulate the identical sequences as in the experiments[38–40], the four native cysteine residues in TM10 and TM16 at positions 555, 563, 1205 and 1209 were replaced by serine to avoid unwanted formation of intra-disulfide bonds in experiments [40]. Hereafter, these two mutated peptides will be named as mTM10 and mTM16, respectively. It is found experimentally that the replacement of C1205 and C1209 by a serine residue has no effect in the protein expression or function
[37]. As for the TM17 peptide, we carried out MD simulations on two peptides: Afirst one (TM17) with the native sequence of the peptide and a second one (KTM17), where thefirst alanine residue was replaced by a lysine (i.e. A1227K). Experimental evidences[38,40]show that the C→ S and A → K variants slightly reduce the hydrophobic nature of the
peptides and the depth of their insertion in the micelle surface. Mutations were achieved with the SCWRL4.0 program[61].
The resulting peptides were then acetylated and amidated at the N-and C-termini, respectively, N-and MD simulations were performed based on the Amber99SB-ILDN forcefield[62].Table 1provides the amino-acid sequences of the four peptides studied in this work, numbered according to the hMRP1 wild type sequence. Restrained ElectroStatic Potential (RESP) atomic charges and the forcefield library for TFE were obtained from the“W-16” project available in the RESP ESP charge DDataBase (R.E.DD.B.) athttp://q4md-forcefieldtools.org/REDDB/projects/ W-16/ [63]. These charges were derived using the R.E.D. tools[64]from quantum mechanics calculations at the HF/6–31G⁎ level of theory for four molecular orientations per conformation and for the trans and a gauche conformations involving the CCOH dihedral angle. Indeed, it has been previously shown by X-ray[65], neutron diffraction experiments and simulations[65,66]that both conformations coexist in liquid TFE. TFE RESP charges were then combined with the bonded and non-bonded parameters of Chitra et al. (set 4 in reference[67]) based on the Cornell et al. forcefield[68]. The later was used by Bodkin and Goodfellow
[69]to study the structural properties of a helical peptide in the water/TFE mixture. For the DPC surfactant, we used the RESP charges developed by us
[70]and freely available in the“F-92” R.E.DD.B. project at http://q4md-forcefieldtools.org/REDDB/projects/F-92/. These charges were also derived by using the R.E.D. tools by means of the“building blocks” approach
[64,71] and we demonstrated that this model reproduces well the structural and dynamical properties of pure DPC micelles in water. As in Ref.[70], these RESP charges were combined with the bonded and non-bonded parameters available in the Amber99SB forcefield [62,72] to model DPC inter- and intra-molecular interactions. Finally, in the case of the DDM surfactant, we used the RESP atomic charges developed and tested previously[73]in MD simulations of pure DDM micelles in water and available athttp://q4md-forcefieldtools.org/REDDB/projects/F-72/for n-alkyl-glycoside surfactants. As in Ref.[73], these charges were combined with the GLYCAM06 (f version) forcefield[74].
2.2. Molecular dynamics
MD simulations described in this work were carried out with the GROMACS (v4.5.3) simulation package [75,76]. The initial structure of each molecular system was constructed with a self-aggregation strategy, where the corresponding number of peptide molecule,
water, TFE, chloride ions, DPC and DDM molecules (summarized in
Table 2) was randomly placed in a cubic box letting evolving the molecular system in unconstrained simulation conditions for more than 100 ns in all cases. In particular, two different simulations were run for each system (named hereafter R1 and R2) with two different input configurations. This was achieved by generating random orientations for each molecule (i.e. peptide, surfactant, ions and water) during the boxfilling stage. As, to our best knowledge, the micellar DPC and DDM aggregation numbers, Nagg, in the presence of hMRP1 TM peptides were not experimentally determined, we used the Naggvalues of Zhang and Lazaridis[77]and Dupuy et al.[78]for pure (i.e. without peptide) DPC and DDM micelles in water, respectively. Thus, in the simulations presented here Naggof 55 and 132 was used for DPC and DDM, respectively, which are close to values adopted in previous works[70,73,77]. We notice that, at least for DDM, using an Naggvalue obtained for micelles in water with no peptide is supported by experiments[38]showing that the peptide–detergent complex has a similar rotational correlation time and, by extrapolation, a similar size to a pure DDM micelle.
In the DDM–peptide simulations, the GLYCAM06 and the Amber99SB-ILDN forcefields were combined to model DDM–peptide interactions and as these two forcefields use different scaling factors for the 1–4 interactions (i.e. fudgeQQ = fudgeLJ = 1.0 and fudgeQQ = 0.5 and fudgeLJ = 0.83333, respectively), these interactions were properly scaled. For that, the half-ε double pair list method described in reference[79] was used. The TIP3P water model [80] with the SETTLE algorithm [81] to keep the geometry of water rigid was considered in the simulations reported in this work. MD simulations described in this paper were carried out with periodic boundary conditions with the electrostatic interactions treated by the Particle-Mesh Ewald method[82]. Each system was first energy minimized with the GROMACS steepest descent algorithm with an energy tolerance lower than 1000.0 kJ mol−1nm−1. The resulting molecular
systems were then equilibrated in the NVT ensemble at 298 K by using the Berendsen thermostat[83]with a coupling constant ofτT= 0.1 ps for 400 ps. Peptides, detergents and solvent (i.e. chloride ions, TFE and water) molecules were coupled to separate thermostatic baths. Subsequently, these systems were equilibrated in the NPT ensemble at T = 298 K and P = 1.015 bar for 400 ps with the Bussi et al.[84]
thermostat (τT= 0.1 ps) and the Parrinello-Rahman[85,86]barostat with τp and a compressibility of 1.0 ps and 4.5 × 10⁻⁵ bar−1, respectively. During these steps, peptides were harmonically restrained with a force constant of 1000 kJ mol−1nm−2in order to equilibrate the solvent, surfactant and ion molecules. Finally, the resulting systems were simulated for production in the NPT ensemble at T = 298 K and P = 1.015 bar. In these production runs, the previous thermostat was replaced with that of Nosé-Hoover [87,88](τT= 0.4 ps) while the barostat and its parameters were kept unchanged. At that time, molecular restraints were released and the runs lasted between 112 and 271 ns, depending on the system examined as described in
Table 2. A cutoff of 10 Å for both short and long-range interactions in the direct lattice was used. To restrain bond lengths to their equilibration values, the P-LINCS algorithm was used[89]. A 2 fs time step was used to integrate the equations of motion with the neighbor list updated every 10 fs. Finally, the simulation trajectories were recorded by collecting the system coordinates every 2 ps. The trajectories were analyzed by means of the GROMACS tools and of an analysis code written by us.
3. Results and discussions
3.1. Peptide–DPC and DDM micelle structures 3.1.1. Micelle–peptide aggregation process
We first consider the influence of the peptide on the micelle aggregation process for the different micellar systems simulated in
Table 2
Simulation parameters. Npep, Nw, Ncl−,NTFE, NDPCand NDDMare the numbers of peptide, water, chloride ions, TFE, DPC and DDM molecules in each simulation box, respectively. R1 and R2
are thefirst and second simulation series. tsimis the productive simulation time in ns.
System Media Simulation name Npep Nw Ncl− NTFE NDPC NDDM tsim
mTM10 Water mTM10-W-R1 1 14,138 0 – – – 114 mTM10-W-R2 122 TFE mTM10-TFE-R1 1 – 0 2607 – – 119 mTM10-TFE-R2 114 DPC mTM10-DPC-R1 1 16,059 0 – 55 – 185 mTM10-DPC-R2 188 DDM mTM10-DDM-R1 1 25,000 0 – – 132 203 mTM10-DDM-R2 203 mTM16 Water mTM16-W-R1 1 14,141 1 – – – 112 mTM16-W-R2 124 TFE mTM16-TFE-R1 1 – 1 2607 – – 114 mTM16-TFE-R2 115 DPC mTM16-DPC-R1 1 16,092 1 – 55 – 185 mTM16-DPC-R2 192 DDM mTM16-DDM-R1 1 25,000 1 – – 132 230 mTM16-DDM-R2 271 TM17 Water TM17-W-R1 1 14,139 1 – – – 113 TM17-W-R2 118 TFE TM17-TFE-R1 1 – 1 2607 – – 117 TM17-TFE-R2 115 DPC TM17-DPC-R1 1 16,091 1 – 55 – 246 TM17-DPC-R2 259 DDM TM17-DDM-R1 1 24,999 1 – – 132 214 TM17-DDM-R2 224 KTM17 Water KTM17-W-R1 1 14,127 2 – – – 113 KTM17-W-R2 124 TFE KTM17-TFE-R1 1 – 2 2607 – – 118 KTM17-TFE-R2 115 DPC KTM17-DPC-R1 1 16,066 2 – 55 – 252 KTM17-DPC-R2 255 DDM KTM17-DDM-R1 1 24,998 2 – – 132 200 KTM17-DDM-R2 229
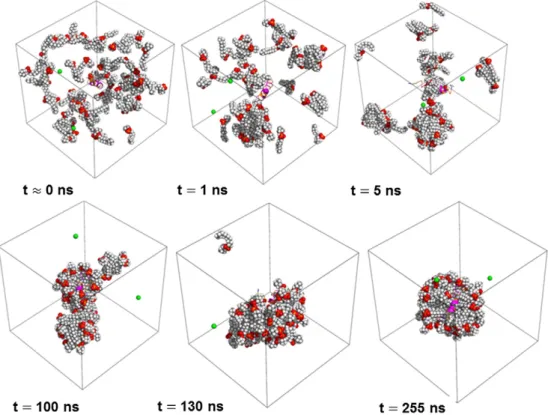
this work.Figs. 3 and 4present representative snapshots of the peptide– DPC and DDM micelle aggregation stages for KTM17-DPC-R2 and TM17-DDM-R1 simulations, respectively. As shown in thesefigures,
early after the beginning of the simulation production time the surfactant monomers diffuse through the simulation box and interact with the peptide and with the other surfactant molecules to form
Fig. 3. Aggregation process of DPC monomers into a micelle vs. time for the KTM17-DPC simulation (case R2). The snapshots at 0b tb 10ns and at 5nsb tb 130ns correspond approximately to the fast and slow periods of the surfactant aggregation process, respectively (see main text for details). DPC surfactants and chloride ions are drawn in the CPK representation, whereas the peptide is displayed with ribbons. Chloride ions are shown in green, whereas water is not shown for clarity. Carbons of the head group and the alkyl tail are in light blue and in gray colors, respectively, whereas the oxygen, phosphorus, nitrogen, and hydrogen atoms are in red, yellow, blue and white colors. Thesefigures were designed using the PyMOL program[96].
Fig. 4. Aggregation process for the DDM monomers into a micelle as the function of the simulation time for the TM17-DDM simulation (case R1). The snapshots at 0b t b 10 ns and 10b t b 70 ns correspond approximately to the fast and slow period of the surfactant aggregation process, respectively (see main text for details). DDM surfactant molecules and chloride ions are drawn in the CPK representation, whereas the peptide is displayed with ribbons. Chloride ions are shown in green, whereas water is not shown for clarity. Carbons of the head group and the alkyl tail are in light blue and gray colors, respectively, whereas oxygen and hydrogen atoms are represented in red and white colors. Thesefigures were designed using the PyMOL program[96].
small clusters of various sizes and shapes. Next, a peptide–surfactant complex is formed, which coexists with small surfactant clusters and free monomers. During this stage the peptide starts to lose its initial helical secondary structure (see below). Finally, a fusion between the peptide–surfactant complex and the remaining surfactant aggregates is observed and a larger peptide–surfactant complex is formed. The length of this last stage depends on the simulation, the peptide sequence and the surfactant type. We alsofind that a single peptide– surfactant aggregate is not completely formed in some cases (see next paragraph). These different peptide–surfactant aggregation stages are similar to the aggregation process recently described by Tian et al.[90]
in simulations involving the α-synuclein protein, an intrinsically disordered protein, solvated with sodium dodecyl sulfate surfactant.
To compare the DPC and DDM self-aggregation processes in the presence of a peptide with simulation results obtained for pure DPC
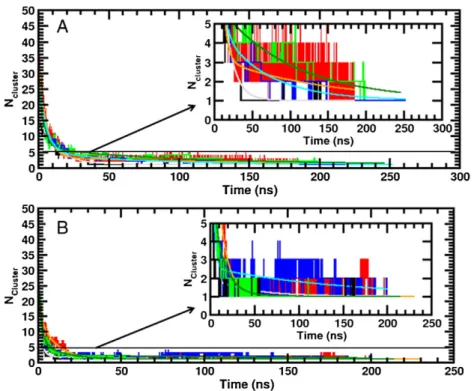
[70]and DDM micelles (see Section II of the Supporting Information), we present inFigs. 5and S3 (hereafter, the letter“S” refers to the figures and tables of the Supporting Information), the instantaneous number of DPC and DDM clusters as a function of time, Ncluster(t), for each simulation. As previously reported[70,91], two DPC or DDM surfactants were considered to belong to the same cluster if any of their alkyl chain carbon atoms are within 4.1 Å of each other. As shown inFigs. 5and S3 the different starting conditions and the peptide itself can significantly affect the micelle aggregation kinetic and structure. The time required to obtain a stable aggregate (i.e. Ncluster(t∞) = 1) is in the range of ~40–220 ns for DPC R1 and R2 simulation series. In the case of the DDM simulations,Figs. 5and S3 (and inset) show that for the R1 simulations, Ncluster(t∞) reaches a stable value of 1 before the end of the simulation. This is contrast with the R2 simulation series, where for three simulation conditions (i.e. mTM16-DDM-R2, TM17-DDM-R2 and KTM17-DDM-R2) the surfactant aggregation is not complete (i.e. N-cluster(t∞)N1), even after a long simulation time (tN270ns). As shown in Fig. S4F and G, for these systems DDM forms two aggregates connected by the peptide.
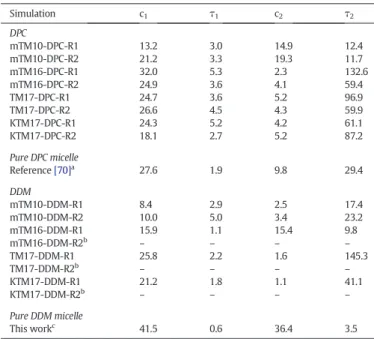
As noted previously in simulations[70,92], the micelle aggregation process can be separated in two stages that occur in two different time scales: One“fast” (tfastb 10 ns) and one “slow” (tslow= 20– 220 ns). The“fast” process can be associated with the quick aggregation of the surfactant monomers into small clusters and a fusion of these small clusters into larger ones. During the slow process, the different aggregates merge to form a single and stable micelle[93,94]. As in our previous work[70], to characterize these time scales involved in the micelle aggregation process, theΔNcluster(t) = Ncluster(t)− 1 function wasfitted with a double exponential function: c1e−t / τ1+ c2e−t / τ2. Here,τ1andτ2are the characteristic relaxation times for the fast and slow processes, respectively[93,95], and c1and c2represent the waning number of clusters involved in the two previously defined simulation periods. Fitting was performed only for the micellar systems for which the Ncluster(t) function reached a constant value of one during the last 30 ns of simulation. As we used different input conditions and initial random seeds, and that the surfactant molecules were not restrained during the NPT equilibration periods, the number of clusters at the beginning of the simulation production phase Ncluster(t = 0) is slightly different among the simulations and not equal to the number of DPC and DDM monomers in the system (i.e. 55 and 132), but around 50 and 45, respectively. The c1, c2,τ1andτ2fitted values obtained from the Ncluster(t) functions are reported inTable 3. As shown by these values, the kinetics of the micellization process differs among the simulations. Generally, the DPC micelle aggregation process occurs slower than for DDM. In particular, we obtained for the ensemble of the DPC simulations,τ1andτ2values in range of 2.2–5.3 ns and 11.7– 144.2 ns, respectively. These values are, respectively, 1.2–2.8 and 2.5– 4.9 times larger than the values previously obtained for pure DPC micelles with 54 DPC monomers and simulated with the Amber99SB forcefield[70]. In case of the eight DDM simulations, except for the mTM16-DDM-R2, TM17-DDM-R2 and KTM17-DDM-R2 simulations, the Ncluster(t) functions were wellfitted by the double exponential function.τ1andτ2values obtained are in the range of 1.8–2.9 ns and
Fig. 5. Aggregation process for the DPC (A) and DDM (B) monomers. The number of clusters is plotted here as the function of the simulation time for R1 series (see text). The black, red, green and blue colors refer to the simulations carried out with the mTM10, mTM16, TM17 and KTM17 peptides, respectively. The double exponentialfitting results are shown in the inset and drawn with continuous lines in gray, orange, dark green and cyan for mTM10, mTM16, TM17 and KTM17, respectively. The number of DPC and DDM clusters contained in each simulation cell were computed every 10 ps.
9.8–258.7 ns, respectively. These values are also larger than τ1andτ2 values obtained in a simulation of the pure DDM micelle (τ1= 0.6 ns andτ2= 3.5 ns (Fig. S1)).
Thefinal snapshots of the four peptide–micelle complexes obtained with DPC and DDM in the R1 and R2 simulation series drawn with the Pymol program[96]are presented inFigs. 6and S4, respectively. They show that the peptides in the DPC and DDM simulations are partially unfolded and located at the micelle surface (seeSection 3.2for details) with small portions of the peptide surfaces exposed to the aqueous environment and partially buried by the surfactant head group as illustrated for the TM17-DDM simulations inFigs. 6H and S4.
3.1.2. Micelle size and shape
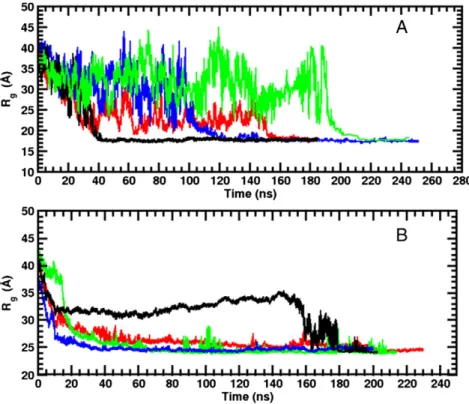
The micelle size in the presence of peptides was characterized by computing its instantaneous radius of gyration (excluding the peptide), Rg, which was compared with that calculated from simulations of pure DPC and DDM micelles. As shown inFigs. 7and S5, after large initial variations the Rgvalues of DPC and DDM reach stable values around 18 and 25 Å after 40–220 ns depending on the considered peptide, respectively. The Rgmean values obtained from the last 40 ns of each DPC and DDM simulation (that corresponds roughly to the period where Rgreaches a stable value) are reported in the second column of
Table 4. For the DPC micelle simulations these values are in the range of 17.5–18.2 Å, with an average Rgfor the different DPC simulations of 17.9 ± 0.2 Å. As expected, given the larger value of Naggand the peptide perturbation, this value is slightly larger than that previously obtained for a pure DPC micelle with 54 DPC monomers simulated with the Amber99SB forcefield (16.9 ± 0.1 Å)[70]. This result indicates that the overall geometry of the micelle is partially impacted by the peptides. In contrast to the DPC case, the average size and shape (see below) of the DDM micelles is more influenced by the peptide presence and by the input simulation conditions. This is corroborated by the larger spread of Rg, calculated between 24.2 and 29.8 Å in the R1 and R2 simulations. When the micelle is considered not completely formed at
Table 3
Double-exponentialfitting values for the DPC and DDM simulations, respectively (see main text for details).τ1andτ2are in ns.aResults obtained for the DPC micelle with 54
monomers modeled with the Amber99SB forcefield (see reference[70]for details).b
Not computed (see main text for details).c
See Section I in the Supplementary material information. Simulation c1 τ1 c2 τ2 DPC mTM10-DPC-R1 13.2 3.0 14.9 12.4 mTM10-DPC-R2 21.2 3.3 19.3 11.7 mTM16-DPC-R1 32.0 5.3 2.3 132.6 mTM16-DPC-R2 24.9 3.6 4.1 59.4 TM17-DPC-R1 24.7 3.6 5.2 96.9 TM17-DPC-R2 26.6 4.5 4.3 59.9 KTM17-DPC-R1 24.3 5.2 4.2 61.1 KTM17-DPC-R2 18.1 2.7 5.2 87.2 Pure DPC micelle Reference[70]a 27.6 1.9 9.8 29.4 DDM mTM10-DDM-R1 8.4 2.9 2.5 17.4 mTM10-DDM-R2 10.0 5.0 3.4 23.2 mTM16-DDM-R1 15.9 1.1 15.4 9.8 mTM16-DDM-R2b – – – – TM17-DDM-R1 25.8 2.2 1.6 145.3 TM17-DDM-R2b – – – – KTM17-DDM-R1 21.2 1.8 1.1 41.1 KTM17-DDM-R2b – – – – Pure DDM micelle This workc 41.5 0.6 36.4 3.5
Fig. 6. Final snapshots of the TM10, mTM16, TM17 and KTM17 peptides with DPC (A–D) and DDM micelles (E–H) for the R1 simulations. The carbon atoms of the head group and the alkyl tail are in gray color. Oxygen, phosphorus, and nitrogen atoms are in red, yellow and blue, respectively. Hydrophobic, polar uncharged, negatively and positively charged amino-acid residues are colored in orange, magenta, yellow and blue colors, respectively. The tryptophan residue of each peptide is shown in black color. Thefigures were designed using the PyMOL program[96].
the simulation timescale (i.e. mTM16-DDM-R2, TM17-DDM-R2 and KTM17-DDM-R2), the micelle Rgis significantly larger (±2–3 Å) than the average Rgvalue calculated from the R1 simulations (i.e. 24.8 ± 0.9 Å) or for pure DDM micelles construct by using self-assembled (24.9 ± 0.2 Å) and preformed (25.2 ± 0.2 Å) simulations (see Fig. S1B and ref.[73]).
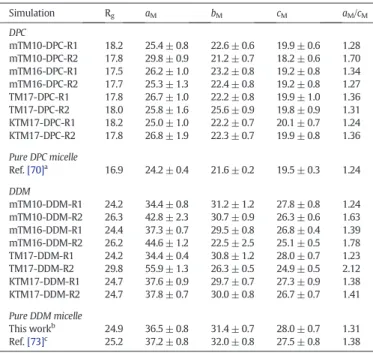
To characterize the micelle shape, the instantaneous micelle semi-axis lengths, aM, bMand cMwere also computed from the inertia tensor
and the average ellipsoidal axis ratio between the micelle major (aM) and minor (cM) semi-axis lengths, i.e. aM/cM, was deduced for the last 40 ns of each simulation. These values are reported inTable 4and are compared to values obtained from previous simulations of pure DPC and DDM micelles (see references[70,73]and the results reported in the Supporting Information). Except for mTM10-DPC (case R2), where the aMvalue is significantly larger (29.8 Å) than for the other peptide– DPC simulations, the semi-axis lengths aM, bMand cMdo not change
Fig. 8. Peptide–micelle center of mass distance, dpep–mic, as a function of time of DPC (A) and DDM (B) obtained from the R1 simulation cases. The trajectory for mTM10, mTM16, TM17 and
KTM17 are shown in black, red, green and blue colors, respectively.
Fig. 7. Radius of gyration values displayed as a function of the simulation time for the DPC (A) and DDM (B) micelles. The trajectory of the R1 simulation cases for the mTM10 (black), mTM16 (red), TM17 (green) and KTM17 (blue) peptide is presented (see text). Peptide atoms were not included in the calculation of the Rgvalues.
much with the different peptides. Thus, we observed that the mean aM, bMand cMvalues are 25.9±0.7, 22.9±1.2 and 19.7±0.4Å, respectively, with an average aM/cMaxial ratio of 1.30 ± 0.05. These values are 5.9%, 6.9%, 6.1% and 6.4% higher than those calculated for the pure DPC micelle (24.2±0.4, 21.6±0.2, 19.5±0.3Å and 1.24±0.39, respectively)
[70]. For DDM, as it was found for their Rgvalues, the aM, bMand cM values show much larger fluctuations, especially for the mTM10-DDM-R2, mTM16-DDM-R2 simulations and TM17-DDM-R2. These three micelles are found more ellipsoidal than other ones or the pure DDM micelle with aM/cMvalues greater than 1.60. The mean aM, bM, cMand aM/cMvalues for the DDM simulation series (excluding these three simulations) are equal to 36.3 ± 1.7, 30.2 ± 0.7, 27.3 ± 0.6 Å and 1.33 ± 0.1, respectively. These values are close to the values obtained previously for pure DDM micelles (see the last two rows ofTable 4
and reference[73]).
3.2. Peptide–micelle interactions
3.2.1. Peptide–micelle non-specific interactions
Peptide–micelle interactions were examined by computing the center of mass (COM) distance between the peptide and the micelles, dpep–mic, as a function of the simulation time for the R1 and R2 simulation series (Figs. 8and S6, respectively). We wish to underline that the micelle COM is here defined as the COM of all the detergent molecules. As discussed inSection 3.1and illustrated inFigs. 3 and 4, each peptide is located in the center of the simulation box and is surrounded by small surfactant aggregates and monomers in the input conditions. This arrangement gives a value around 0 Å for dpep–mic. In mTM10-DPC and mTM16-DPC simulations (both R1 and R2 cases) the initial dpep–micvalues are found between 2 and 5 Å. dpep–micvalues increase up to ~15–20 Å during the first 30 ns of production, before reaching stable values between 13 and 15 Å after 60 ns. For the TM17 and KTM17 simulations largerfluctuations are observed and dpep–mic values take between 140 and 200 ns of simulation to reach stable values (between 15 and 17 Å). In all cases, we notice that thefinal dpep–mic values are close to the DPC micelle Rgcomputed inSection 3.1(with an average Rg~ 18 Å), indicating that the peptides are located at the micelle surface in the micelle headgroup region as we can deduce from the radial density function profiles (see below). A representative view of the peptide–micelle complex for the four peptides in the DPC simulation conditions (case R1) is shown inFig. 6A–D, validating this scenario. Concerning the DDM simulations, the initial dpep–micvalues are also found between 2 and 5 Å at the beginning of the productive simulations, and these values increase to values of 17.5–20.0 Å after 20 ns of simulation. Except for the TM17-DDM conditions (case R1) where large fluctuations for dpep–micare observed between 80 and 160 ns (Fig. 9), dpep–micreach stable values between 17.5 and 24.0 Å after ~60 ns of production (as compared to an average Rgof ~26 Å). The large dpep–micrange obtained for DDM suggests that, in contrast to the DPC simulations, the localization of the peptide at the micelle surface is less defined (probably in relation to the larger DDM than DPC headgroup region). In DDM, we also observed that peptides can be more or less buried at the micelle surface (as suggested by the dpep–micvalues slightly lower (by 2 to 8 Å) than the DDM Rgvalues) with a large part of the peptide covered by the detergent head group, as illustrated, for example, inFig. 6F. These results are consistent with tryptophan fluorescence spectroscopy experiments [38–40], which attest that these peptides do not insert in a typical TM position in the micelles[39].
To glean more information about peptide–micelle interactions, we have computed, for the DPC and the DDM simulations, the average radial density functions profile ρ(r) for all the relevant system components as a function of the distance r from the micelle COM. As
Table 4
Average dimensions of the micelle semi-axes in the different simulation conditions studied in this work. Values were computed by including all the micelle atoms (see main text for details). The radii of gyration, aM, bMand cMwere computed from the last
30 ns of each simulation. All results are in Å. The statistical error (maximum error) for the Rgand aM/cMare lower than 0.2 Å and 0.05, respectively.aMicelle with 54 DPC
monomers.b
Values obtained from the last 45 ns of the simulation.c
Values obtained from the simulation carried out with the GLYCAM06 forcefield (version f)[74].
Simulation Rg aM bM cM aM/cM DPC mTM10-DPC-R1 18.2 25.4 ± 0.8 22.6 ± 0.6 19.9 ± 0.6 1.28 mTM10-DPC-R2 17.8 29.8 ± 0.9 21.2 ± 0.7 18.2 ± 0.6 1.70 mTM16-DPC-R1 17.5 26.2 ± 1.0 23.2 ± 0.8 19.2 ± 0.8 1.34 mTM16-DPC-R2 17.7 25.3 ± 1.3 22.4 ± 0.8 19.2 ± 0.8 1.27 TM17-DPC-R1 17.8 26.7 ± 1.0 22.2 ± 0.8 19.9 ± 1.0 1.36 TM17-DPC-R2 18.0 25.8 ± 1.6 25.6 ± 0.9 19.8 ± 0.9 1.31 KTM17-DPC-R1 18.2 25.0 ± 1.0 22.2 ± 0.7 20.1 ± 0.7 1.24 KTM17-DPC-R2 17.8 26.8 ± 1.9 22.3 ± 0.7 19.9 ± 0.8 1.36 Pure DPC micelle Ref.[70]a 16.9 24.2 ± 0.4 21.6 ± 0.2 19.5 ± 0.3 1.24 DDM mTM10-DDM-R1 24.2 34.4 ± 0.8 31.2 ± 1.2 27.8 ± 0.8 1.24 mTM10-DDM-R2 26.3 42.8 ± 2.3 30.7 ± 0.9 26.3 ± 0.6 1.63 mTM16-DDM-R1 24.4 37.3 ± 0.7 29.5 ± 0.8 26.8 ± 0.4 1.39 mTM16-DDM-R2 26.2 44.6 ± 1.2 22.5 ± 2.5 25.1 ± 0.5 1.78 TM17-DDM-R1 24.2 34.4 ± 0.4 30.8 ± 1.2 28.0 ± 0.7 1.23 TM17-DDM-R2 29.8 55.9 ± 1.3 26.3 ± 0.5 24.9 ± 0.5 2.12 KTM17-DDM-R1 24.7 37.6 ± 0.9 29.7 ± 0.7 27.3 ± 0.9 1.38 KTM17-DDM-R2 24.7 37.8 ± 0.7 30.0 ± 0.8 26.7 ± 0.7 1.41 Pure DDM micelle This workb 24.9 36.5 ± 0.8 31.4 ± 0.7 28.0 ± 0.7 1.31 Ref.[73]c 25.2 37.2 ± 0.8 32.0 ± 0.8 27.5 ± 0.8 1.38
Fig. 9. (A) Illustrative snapshot showing possible cation–π interactions between the W553 indole group and the two nearest DPC choline groups in the case of the mTM10 peptide in DPC micelle in the R1 simulation. (B) Interactions of the W1246 residue with the micelle in the case of the KTM17-DPC R1 simulation. The yellow dashed lines are the distances between the N atom and indole center. Water is not shown for visual clarity.
previously discussed elsewhere[73], the nonspherical nature of the micelles will affect theρ(r) value to a certain extent, causing broadening of these functions. Here, we focus on and discuss the density of the following system constituents (see Fig. 2 for the labels): the DPC phosphate (phospho) and choline (choline), the two DDM glucose units (GlcA and GlcB), the dodecane tail group (alkyl), water, the whole peptide, and the peptide tryptophan residue. The radial density ρ(r) values were computed every 2 ps and averaged over the last 40 ns of each simulation. The plots for the 16 simulations (8 in DPC and 8 in DDM) are shown in the Supplementary material in Figs. S7– S10.
An important observation is that the structure of the detergent components is largely affected by the degree of peptide penetration in the micelle, and that DDM micelles are those where this effect is more visible. The averageρ(r) values for mTM10 in DPC and in DDM for the two sets of runs, R1 and R2 are reported in Figs. S7–S10 (panel A). We find that for both detergents the run labeled R2 brings mTM10 deeper in the micelle than R1. In DPC (Figs. S7 and S8), although the density profiles of the alkyl tails and of the phospho groups are broader in R2 than in R1, mTM10 induced micelle profile changes are rather small. In DDM instead, as shown in Figs. S9 and S10 (panel A), micelle profile changes induced by mTM10 penetration are much larger. Indeed, in R2 compared to R1 the two sugar profiles change significantly, so that new peaks appear at short distances from the COM of the micelle. This is a sign of strong interactions between GlcA and GlcB with mTM10, which are also observed for TM17 and KTM17. In the run R2 of mTM10 the alkyl density at 10 Å from the micelle COM drops around 0.5 g cm−3, well below the experimental dodecane density (0.745 g cm−3)[97,98].
The density profiles of water in the DDM micelle simulations are also affected by the peptide embedding in the micelle interior. For mTM10, TM17 and KTM17 (Fig. S10A, C and D), this is shown by the apparition of small peaks at distances below 20 Å in their waterρ(r)s, which implies specific bonds between water and peptide residues inside the micelle. In this perspective, it is interesting to investigate the interactions of the tryptophan residue with water and with the other components of the micelle. Indeed, thefluorescence properties of this residue are affected by the nature of its local environment and fluorescence spectroscopy experiments are used to probe the hydrophilic or hydrophobic surroundings around a specific tryptophan (see for instance ref.[99]). In the DPC simulation series (Figs. S7 and S8), the W553, W1198 and W1246 residues of mTM10, mTM16 and KTM17 peptides, respectively, are located between 10 and 20 Å from the micelle COM, sometimes near the phospho group, in a region with an alkyl density ranging from 0.25 to 0.5 g cm−3. In the DDM micelles (Figs. S9 and S10), the tryptophan residue is always closer to the surface except in the case of run R2 of mTM10, where the tryptophan density has a well-defined peak at 8 Å from the micelle COM. In contrast, for the R1 run of KTM17 in spite of a peptide located deeply in the micelle, the tryptophan density is found closer to the surface of the micelle, but still within an alkyl density of 0.18 g cm−3. The micelle snapshots given inFigs. 5and S4 support these results, and show that these residues are mainly localized in both micelles at the micelle–water interface and sometimes recovered by the surfactant head group in case of the DDM micelle (see for instance,Fig. 6G and H).
Finally, it was shown by circular dichroism spectroscopy or solid state2H NMR spectroscopy experiments[100]or molecular simulations
[101,102]that the tryptophan indole ring can form cation–π bonds with the cationic choline group of the phospholipid headgroup. To examine this aspect, we have computed the distance between the nitrogen of choline group with respect to the center of the tryptophan ring during the last 20 ns of each peptide–DPC simulation (not shown). We found that for each peptide the distancefluctuate around 4.3–10 Å indicating formation of sporadic cation–π bond (4.5–6.0 Å) [101–103] as it is illustrated inFig. 9A in the case of the mTM10-R1 simulation. Larger
distance between the nitrogen of choline group and the Trp indole groups indicate that the Trp indole can move sporadically away from DPC headgroup and stand in the micelle hydrocarbon core as illustrated in Fig. 7B in the case of the KTM17-DPC R1 simulation. Previous fluorescence quenching experiments[38–40]suggest that the trypto-phan residue is partly in contact with the detergent alkyl chain. 3.2.2. Peptide–water interactions
For the different reported simulations, wefind that the peptides are localized at the surface of the micelle, as shown in the pictorial view given inFigs. 6and S4. To examine more quantitatively the degree of embedding of each peptide in the micelle and its exposure to water, the peptide solvent accessible surface area (SASApep) was computed from the simulations. SASApepvalues were computed every 10 ps with the trjVoronoi program[70,104], which uses the Voro++ software library [105] used to analyze GROMACS trajectories. This program computes the SASA for any segment of the system as the Voronoi surface shared between water and the considered segment, which in turn is obtained by summing up all the atomic Voronoi polyhedral face areas of the segment atoms shared with any water atoms. The total Voronoi surface of the segment is defined as the sum of all atomic Voronoi facets shared with atoms others than those of the segment. As in references[70,73,106,107], explicit hydrogen atoms were excluded from these calculations. Wefind that except for mTM16-DDM (case R2) and TM17-DDM (case R1), where the equilibrium takes longer to attain (N100 ns), implying a high mobility and structural disorder for the peptides, instantaneous SASA values decrease monotonically and reach a plateau after 20–50 ns of production. The solvent exposure values of the whole mTM10, mTM16, TM17 and KTM17 peptides are, on average, reduced by 47.7 (66.7), 42.5 (51.8), 37.5 (55.0) and 48.7% (67.5) in DPC (in DDM) compared to SASA in water; see last rows of Tables S2–S5. This observation demonstrates that the solvent exposure of the peptide is smaller in DDM than in DPC, and is consistent with the results derived from tryptophanfluorescence spectra and quenching by acrylamide[38–40].
We have examined the SASA between water and each peptide residue or SASAX. The raw data averaged over the last 30 ns of each simulation are presented in Tables S2 through S5. InFig. 10, these results are summarized by plotting the relative change in SASAX,ΣX, when a peptide is transferred from water to a micelle, i.e.ΣX= (SASAXWater− SASAXMicelle) / SASAXWater. The SASAXWaterand SASAXMicellevalues are the average Voronoi surfaces of each peptide residue computed in the absence and presence of surfactants, respectively. The quantityΣXis positive if SASA decreases going from water to the micelle, hence signaling that the residue is in contact with the detergent molecule, and has a larger affinity for the micelle than for water. Also, residues buried in the micelle display larger ΣX values (up to 1), whereas residues freely exposed to water have negativeΣXvalues or values closer to zero. In the different panels, one for each peptide, a hydropathy plot is added for the residues, which gives a measure of their hydrophobic/hydrophilic characters. Such plot was obtained with a method described by Kyte and Doolittle[108]and with the help of the ExPASy server[109]. A window of three residues was used in the profile computation, and thus only the hydrophobic characters for the second up to the twenty fourth residues are plotted in the figure.
By examiningFig. 10, wefirst notice that ΣXvalues are on the overall always larger for DDM than DPC for the four peptides, indicating that the peptides are less accessible to solvent in DDM micelles than in DPC ones. We alsofind more embedded residues (ΣXclose to 1) for a given peptide in DDM than in DPC. However, the same overall trend in water exposure of the residues is visible for the two micelles and, usually, residues with larger (or smaller) water exposure in one micelle behave similarly in the other. The calculation ofΣXfor the four peptides has also revealed the exposure of the tryptophan residue to water, significantly lower in DDM than in DPC for W553 (in mTM10) but
with less differences in the other cases. These data are consistent with experimental estimates obtained fromfluorescence experiments
[39,40]. In water, formation of peptide oligomers (as we will see in the next section) prevents comparison with the simulation results of isolated peptide.
Concerning the hydropathicity plot, we were not able to discern a clear correlation between the hydrophobicity of the residue andΣX. In a few cases, residues with low hydrophobic character have also a smallΣX(e.g. T556 in mTM10 or T1242 in TM17), but in many others the opposite is also true. This is probably because these residues are
Fig. 10. Differences in SASAXand hydropathicity for the (A) mTM10, (B) mTM16, (C) TM17 and (D) KTM17 peptides. In each panel, the hydropathicity scale and the relative difference in
SASAXbetween the water and the micelle environment is presented in the upper and lower part respectively. The hydropathicity scale of each residue (black) was computed with the
Kyte–Doolittle approach[103]used by the ExPAsy server[104]with a window of three. Regions with values above and below zero are considered as hydrophobic and hydrophilic, respectively (see main text for details). In the panels, results for DPC are in blue and in red for DDM. The black line in thefigures highlights the tryptophan residue positions of each peptide.
Fig. 11. RMSDCαin water (A), TFE (B), DPC (C) and DDM (D) for mTM10 (black), mTM16 (red), TM17 (green) and KTM17 (blue) for the R1 simulation cases. Results obtained in the R2
during the simulation time sporadically buried in the micelle or in contact with water.
3.3. Secondary structure peptide changes in different environments 3.3.1. Peptide structural changes
The stability of the initial helical conformation of each peptide during the simulation was examined by computing the peptide alpha-carbon, Cα, root mean square deviations (RMSDCα). We used as a reference for each RMSDCα calculations the minimized structure of each peptide. The RMSDCα curves obtained in water, TFE, DPC and DDM for the four peptides are plotted inFigs. 11and S15, for the R1 and R2 simulations, respectively. As shown in thesefigures, for all peptides, the evolution of the RMSDCαvalues as a function of the simulation time shows various trends specific to each peptide environment, with slight variations in the R1 and R2 starting conditions. In water (panel A), for all peptides, RMSDCαvalues increase up to 6– 10 Å after a few ns of simulation, andfluctuate significantly during the simulation production time. This behavior is also reflected by the loss of the initial helical conformation and in large variability in the peptide secondary structures (see below). These results contrast with those obtained in TFE (panel B), where the peptide RMSDCαvalues are rather stable with values in the range of 3–4 Å. The only exception is for mTM16 in the R1 simulation case, where an increase of the RMSDCα up to 6 Å is observed after 50–70 ns of simulation. The relatively low RMSDCαvalues obtained for the peptide Cα in TFE are consistent with the fact that the input peptide helical secondary structure is conserved in this solvent (see below). Finally, when the peptides are solvated with DPC and (DDM), intermediate results are obtained, with an increase of the RMSDCαvalues to 5–6 Å (4–6 Å) during the first 10– 20 ns, followed by a stabilization around 4–6 Å (3–6 Å) after ~60 ns of simulation. The increase in RMSDCαvalues at the beginning of the DDM and DPC simulations is a result of the partial unfolding of the peptides observed during the micellization process and a larger peptide contact with the solvent (see below).
3.3.2. Peptide secondary structure changes
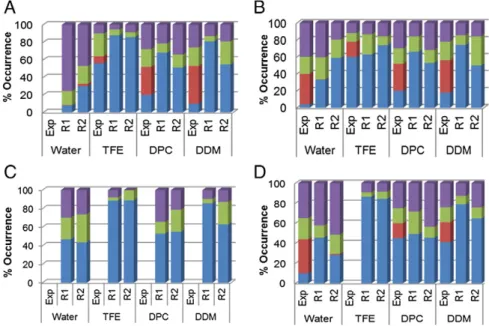
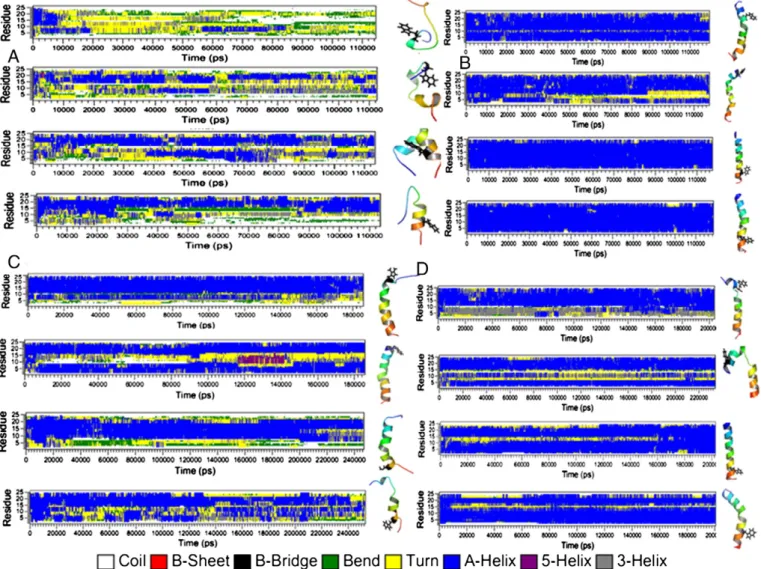
The time evolution of the peptide secondary structure (SS) in water, TFE, DPC and DDM environments was examined every 20 ps with the help of the DSSP program[110]. This program assigns the most likely
class of SS to segments of the peptide based on the peptide trajectory coordinates. InFigs. 12 and S16, the evolution of SS assignment of varying segments of the peptide is described in comparison to canonical protein structure (i.e.“coil”, “sheets”, “bend”, “turn” and “helix”). On the right of eachfigure, the last peptide snapshot extracted from each simulation is presented. Additionally, in order to compare with the percentage of SS elements extracted from circular dichroism exper-iments[38–40], histograms, that give the percentage of turn, strand, helix and unordered (i.e.“coil and bend”) structures computed for the last 30 ns of each simulation are provided inFig. 13.Figs. 12A and S16A show that, in water, the initial helical structure of each peptide is unstable and early after 2–4 ns of production, starts to unfold. The unfolding process proceeds in slightly different ways for a given peptide with the R1 and R2 initial conditions. However, the four peptides show helical segments for most of the simulations. In particular, wefind helical conformation for the residue ranges V560–V567 of mTM10, V1200–E1204 and I1210–R11215 of mTM16, G1231–Y1236 and T1241–V1248 of TM17 and N1244–V1248 of KTM17. For the latter one, the A1227K mutation seems to promote the destabilization of the helical structure located above the mutation point at residue positions of L1231–S1236. For each peptide (except TM17), the average percentage of helical contents computed from the last 30 ns of each simulation vary between the R1 and R2 simulations (Fig. 13), and are on average equal to 19.0 ± 15.6% for mTM10, 46.0 ± 18.4% for mTM16, 45.5 ± 2.1% for TM17 and 36.0 ± 12.7% for KTM17 for the two simulations. Thus, the unfolded structures of these peptides in water are in agreement with their inherent hydrophobicity, discussed above. The circular dichroism experiments carried out on TM16 and KTM17
[38–40]also showed that the helical content of these peptides was the lowest in buffer, as compared to the other environments (although the helical content was found significantly lower, in the range of 4–10%, likely due to peptide aggregation).
A different behavior is observed in TFE. Here, the peptide helical structure is mainly conserved over the course of the entire simulation (Figs. 12B and S16B) with large average helix contents for mTM10, TM17 and KTM17 computed from the last 40 ns of each peptide (86.9 ± 1.4, 88.9 ± 0.7 and 85.4 ± 1.4%, respectively). A smaller helical content is found for mTM16 (68.3 ± 7.8%). This is probably the consequence of the presence of an unfolded region located at the V1200–S1205 segment during the last 30 ns of the simulation. The
Fig. 12. Percentage of secondary structure contents for the mTM10 (A), mTM16 (B), TM17 (C) and KTM17 (D) peptides. Each value was computed from the last 30 ns of trajectory. Exp., R1 and R2 are for experimental, thefirst and second simulation series, respectively. The percentages of helix, strand, turn and unordered structures were colored in blue, red, green and violet colors, respectively.
experimental results extracted from far-UV circular dichroism experiments also reported a maximal helical content for these peptides in organic media, again slightly lower than in the simulations (percentages of helical content of 55% and 60% for mTM10 and mTM16 respectively in TFE[39,40]and 80% for KTM17 in methanol
[38]).
Fig. 12C and D and the last six columns of the histograms inFig. 13
report the SS evolution as a function of time and the average percentage of SS elements for the peptides in the DPC and DDM simulations. In DPC, mTM10 has, on average, 59.6 ± 11.9% of helical content and the unfolding occurs mainly in the peptide N-terminus region up to the V560 residue including the W553 tryptophan. In the presence of DDM, this region is also unfolded (in particular, the segment delimited by S546 and T557) and the peptide average helical content is 67.9 ± 18.7%. For mTM16 in DPC (with an average helix content of 59.5 ± 4.9%), the unfolding process occurs in a region delimited by L1203– G1207, whereas in DDM (average helix content of 62.1 ± 17.5%) the unfolding occurs in a ten-residue segment delimited by the L1199– S1209 amino-acids. In the case of TM17 and KTM17, their N-termini regions delimited by A1227 and T1241 are unfolded in both micelles. For TM17 in DPC, the L1247–S1251 central segment can also be unfolded during relative short periods of time (~20 ns, seeFigs. 11C and S16C). In DDM instead, TM17 and KTM17 remain folded, with a helical content of 74.5 ± 16.9% and 71.9 ± 9.9%, respectively. In all
cases, peptides are less structured (i.e. less folded) in DPC than in DDM. The results for mTM10, mTM16 and KTM17 are reminiscent of those obtained in CD experiments[38–40], in that the peptide helical content in detergent (DPC or DDM) is intermediate between that in water and that in TFE. However, the experimental helical content values are lower than the present ones for mTM10 and mTM16 and are only comparable for KTM17 in DPC (45 and 56% helical structure from CD and simulation respectively). This is probably due to the fact that the lysine electric charge in KTM17 prevents peptide aggregation. In addition, the peptides were slightly less structured in DDM than in DPC. Finally, we also note that in contrast to far-UV circular dichroism experiments[38,40], our simulations do not show any formation of β-strand structures. In order to examine this issue in more details, a series of detergent complexes involving more than one peptide were studied. Indeed, it is known that hydrophobic peptides in water solution or in micelles can aggregate and form β-strand struc-tures[111,112]. This is particularly true when the peptide number per micelle is not close to 1, but larger. This secondary structure can be stabilized if the peptide, as it is the case of mTM16, has both positive (R1197 and R1202) and negative (E1204) formal charges in its sequence leading to a head–tail arrangements (i.e. as in hairpin). To explore this issue, three additional simulations were performed with three mTM16 peptides in bulk water (i.e. condition named 3-mTM16-W) and in micelles of DPC DPC) and DDM
(3-mTM16-Fig. 13. Changes in the secondary structure for the mTM10, mTM16, TM17 and KTM17 peptides as a function of time in water (A), TFE (B), DPC (C) and DDM (D) conditions for the R1 simulation cases. In each of the four frame results corresponding to the different peptides are given in thefirst, second, third and fourth plots, respectively. SeeTable 1for the corresponding position of each peptide residues along each peptide chain.
DDM), see Section II in the Supporting Information and Figs. S18(A-B). Our results confirm that in water the mTM16 peptides can form a stable aggregate after ~50 ns of simulation, but do not form anyβ-strand SS even after long simulation time (t ~ 317 ns, Fig. S17A). In water the peptides have a hairpin structure, where the positively charged residues R1197 and R1202 in the N-termini interact with the negatively charged residue E1204 (Fig. 14A). The percentage ofα-helix content of the three peptides in water (47.0 ± 2.8%) is similar to the value obtained for a single mTM16 peptide in the same solvent (46.0 ± 18.4%) (Fig. S17D). As in water, the three peptides do not form anyβ-strand SS in DPC and DDM (Fig. S17B and C). As for the simulations carried out with a single peptide, we alsofind that DDM surfactant has a more stabilizing effect on the three peptide secondary structure compared to DPC, with helix contents of 60.8% and 40.3%, respectively (Fig. S17B and C). These values are 32.2% and 2.1% lower than the values previously obtained for a single mTM16 peptide in DPC and in DDM micelles.
4. Conclusion
This paper describes the formation and the resulting structure of peptide–detergent complexes as obtained by MD simulations in the hundreds of ns time range. The peptides considered here, mTM10, mTM16, TM17 and KTM17 represent three fragments from the last two membrane-spanning domains of hMRP1 which play an important role in the hMRP1 functions. Structural models were available for these three fragments and the four peptides considered are those previously studied by CD and Trpfluorescence[38–40]so that detailed comparison could be made between simulation and experiments in closely similar conditions. We have studied the interactions between these peptides and two widely used detergents, DPC and DDM. The structural and dynamical data of the micelle complexes were compared to those obtained for peptides in pure water and TFE and for micelles alone.
Wefirst described the effect of peptide on micelle formation. We find that the micelle aggregation kinetics is affected at different degrees by the presence of the peptides. For both DPC and DDM micelles the aggregation kinetic is slowed significantly down by the peptide compared to that observed for pure micelle[70,93,94], by a factor of 1.4–2.8 for DPC and 2.5–4.5 for DDM. The size of the micelles is also,
on average, slightly increased by the peptide, as indicated by Rgvalues, with a larger spread of the results with DDM micelles: thus, Rgvalues are within 24.2–29.8 Å for DDM aggregates and within 17.5 and 18.2 Å for DPC.
We then focused on peptide position and structure within the complexes. In agreement withfluorescence spectroscopy experiments
[38–40], the results show that the four peptides have tangential orientations at the DPC and DDM micelle surfaces in the performed simulations, and no evidence of transverse orientations was observed. This is clearly visualized in thefinal snapshots of the peptide–detergent complexes (e.g.Fig. 6). This is also shown by the values of dpep–mic (Fig. 8) which should be smaller or close to zero in case of transverse orientation. Similarly, the SASA values should be lower for a transverse peptide with lower water accessibility. Consistent withfluorescence spectroscopy experiments, peptides are in general more buried in DDM than in DPC and, consequently, have larger exposure to water in DPC than in DDM. In the case of the peptide Trp residues, they can also form cation–π interactions with the choline group of the DPC or stand near the hydrophobic core of the micelle (Fig. 7). This work also revealed how the percentage SS is affected in the different simulation conditions. In particular, in TFE the initial helical SS of the different peptides is maintained during the entire simulation trajectories, and the average helix content is in the range of 68.3–88.9%. In contrast, the peptides helical SS is in part quickly lost in water after only ~2–4 ns, whereas on average over the length of the runs helical contents are found in the range between 19.8% and 46.0%. An intermediate situation is found in detergent micelles, where the peptides remain partially folded and are more structured in DDM than in DPC, with an average helix content of 62.1–74.5% and 47.3–59.6%, respectively. Finally, simulations performed with three mTM16 peptides in DPC and DDM micelles, in order to simulate peptide–peptide interactions as occurred in experiments, have shown no sign ofβ-strand SS formation as invoked by far-UV circular dichroism experiments [39,40]. However, such structural change may take longer than the short simulation time.
In addition to its general and theoretical interest in terms of modeling peptide–membrane interaction with two detergents of general use, this work complements previous experimental work on hMRP1 fragments. In CD andfluorescence experiments, in particular, the overall peptide SS and tryptophan accessibility were described for
Fig. 14. MD snapshots for three mTM16 peptides in water (A), DPC (B) and DDM (C) conditions after 317, 215 and 218 ns of simulation, respectively. The DPC and DDM surfactant molecules in Figures B and C were not shown for visual clarity. Thefigures were designed with the PyMOL program[96].
the same detergents studied in this paper. In addition, our work provides new data on conditions not covered by those experiments: interaction of a single peptide with detergents forming a single micelle, structure and dynamics at the atomic level. The general trends previously observed were strengthened, and when some quantitative results were at variance (for instance, higher helix extent in some simulations than in experiments), this probably results from peptide– peptide association in the experimental conditions. This work provides further support to the fact that these peptides adopt an interfacial and not a transverse orientation within the micelles[39,40]. Thisfinding might seem counterintuitive, considering peptide TM location in the protein structural models. However given the clear amphiphilic character of these protein fragments, it seems likely that their structural stability as TM helices is related not only to interactions with the membrane, but also with the whole protein. Following on these lines, it will be interesting in the future to compare the results obtained here, with additional MD simulations of other TM hMRP1 fragments, for example TM4, which is not expected to belong to the translocation pore and, according to experimental results[39], is known to adopt transverse orientation in micelles.
Acknowledgements
This work was, in part, granted access to the HPC resources of CCRT/ CINES under the allocation t2011076076 made by GENCI (Grand Equipement National de Calcul Intensif). We are also grateful to Drs. Manuel Garrigos for providing usFig. 1and Chris Neal (U. of Toronto, Canada) for insightful discussions.
Appendix A. Supplementary data
Supplementary data to this article can be found online athttp://dx. doi.org/10.1016/j.bbamem.2013.10.012.
References
[1] M. Dean, A. Rzhetsky, R. Allikmets, The human ATP-binding cassette (ABC) transporter superfamily, Genome Res. 11 (2001) 1156–1166.
[2] S. Cole, G. Bhardwaj, J.H. Gerlach, J.E. Mackie, C.E. Grant, K.C. Almquist, A.J. Stewart, E.U. Kurz, A.M. Duncan, R.G. Deeley, Overexpression of a transporter gene in a multidrug-resistant human lung cancer cell line, Science 258 (1992) 1650–1654. [3] A. Tabcharani, X.B. Chang, J.R. Riordan, J.W. Hanrahan, Phosphorylation-regulated
Cl−channel in CHO cells stably expressing the cysticfibrosis gene, Nature 352 (1991) 628–631.
[4] M.J. Dunne, C. Kane, R.M. Shepherd, J.A. Sanchez, R.F.L. James, P.R.V. Johnson, A. Aynsley-Green, S. Lu, J.P. Clement, K.J. Lindley, S. Seino, L. Aguilar-Bryan, G. Gonzalez, P.J. Milla, Familial persistent hyperinsulinemic hypoglycemia of infancy and mutations in the sulfonylurea receptor, N. Engl. J. Med. 336 (1997) 703–706. [5] D.L. Goksel, K. Fischbach, R. Duggirala, B.D. Mitchell, L. Aguilar-Bryan, J. Blangero, M.P. Stern, P. O'Connell, Variant in sulfonylurea receptor-1 gene is associated with high insulin concentrations in non-diabetic Mexican Americans: SUR-1 gene variant and hyperinsulinemia, Hum. Genet. 103 (1998) 280–285. [6] R.G. Deeley, C. Westlake, S.P.C. Cole, Transmembrane transport of endo- and
xenobiotics by mammalian ATP-binding cassette multidrug resistance proteins, Physiol. Rev. 86 (2006) 849–899.
[7] I. Akan, S. Akan, H. Akca, B. Savas, T. Ozben, Multidrug resistance-associated protein 1 (MRP1) mediated vincristine resistance: effects of N-acetylcysteine and Buthionine sulfoximine, Cancer Cell Int. 5 (2005) 22.
[8] K.J. Linton, Structure and function of ABC transporters, Physiology 22 (2007) 122–130.
[9] S.P.C. Cole, R.G. Deeley, Multidrug resistance mediated by the ATP-binding cassette transporter protein MRP, BioEssays 20 (1998) 931–940.
[10] C. Kast, P. Gros, Epitope insertion favors a six transmembrane domain model for the carboxy-terminal portion of the multidrug resistance-associated protein, Biochemistry 37 (1998) 2305–2313.
[11] C. Kast, P. Gros, Topology mapping of the amino-terminal half of multidrug resistance-associated protein by epitope insertion and immunofluorescence, J. Biol. Chem. 272 (1997) 26479–26487.
[12] D.R. Hipfner, Membrane topology of the multidrug resistance protein (MRP) a study of glycosylation-site mutants reveals an extracytosolic NH2 terminus, J. Biol. Chem. 272 (1997) 23623–23630.
[13] E. Bakos, Functional multidrug resistance protein (MRP1) lacking the N-terminal transmembrane domain, J. Biol. Chem. 273 (1998) 32167–32175.
[14] K. Hollenstein, R.J.P. Dawson, K.P. Locher, Structure and mechanism of ABC transporter proteins, Curr. Opin. Struct. Biol. 17 (2007) 412–418.
[15] A. Ward, C.L. Reyes, J. Yu, C.B. Roth, G. Chang, Flexibility in the ABC transporter MsbA: alternating access with a twist, Proc. Natl. Acad. Sci. U. S. A. 104 (2007) 19005–19010.
[16] R.J.P. Dawson, K.P. Locher, Structure of the multidrug ABC transporter Sav 1866 from Staphylococcus aureus in complex with AMP-PNP, FEBS Lett. 581 (2007) 935–938.
[17] R.J.P. Dawson, K.P. Locher, Structure of a bacterial multidrug ABC transporter, Nature 443 (2006) 180–185.
[18] M.F. Rosenberg, C.J. Oleschuk, P. Wu, Q. Mao, R.G. Deeley, S.P.C. Cole, R.C. Ford, Structure of a human multidrug transporter in an inward-facing conformation, J. Struct. Biol. 170 (2010) 540–547.
[19] M.K. DeGorter, G. Conseil, R.G. Deeley, R.L. Campbell, S.P.C. Cole, Molecular modeling of the human multidrug resistance protein 1 (MRP1/ABCC1), Biochem. Biophys. Res. Commun. 365 (2008) 29–34.
[20] J.D. Campbell, K. Koike, C. Moreau, M.S.P. Sansom, R.G. Deeley, S.P.C. Cole, Molecular modeling correctly predicts the functional importance of Phe594 in transmembrane helix 11 of the multidrug resistance protein, MRP1 (ABCC1), J. Biol. Chem. 279 (2004) 463–468.
[21] R.G. Deeley, S.P.C. Cole, Substrate recognition and transport by multidrug resis-tance protein 1 (ABCC1), FEBS Lett. 580 (2006) 1103–1111.
[22] T. Lazarova, K.A. Brewin, K. Stoeber, C.R. Robinson, Characterization of peptides corresponding to the seven transmembrane domains of human adenosine A2a receptor, Biochemistry 43 (2004) 12945–12954.
[23] A.M.S. Duarte, E.R. de Jong, R.B.M. Koehorst, M.A. Hemminga, Conformational studies of peptides representing a segment of TM7 from H+-VO-ATPase in SDS micelles, Eur. Biophys. J. 39 (2010) 639–646.
[24] J. Oates, M. Hicks, T.R. Dafforn, D. DiMaio, A.M. Dixon, In vitro dimerization of the bovine papillomavirus E5 protein transmembrane domain, Biochemistry 47 (2008) 8985–8992.
[25] A. Rath, D.V. Tulumello, C.M. Deber, Peptide models of membrane protein folding, Biochemistry 48 (2009) 3036–3045.
[26] D.V. Tulumello, C.M. Deber, Efficiency of detergents at maintaining membrane protein structures in their biologically relevant forms, Biochim. Biophys. Acta 1818 (2012) 1351–1358.
[27] N. Bordag, S. Keller,α-Helical transmembrane peptides: a “divide and conquer” approach to membrane proteins, Chem. Phys. Lipids 163 (2010) 1–26. [28] J.-L. Popot, D.M. Engelman, Helical membrane protein folding, stability an
evolution, Annu. Rev. Biochem. 69 (2000) 881–922.
[29] J.-L. Popot, D.M. Engelman, Membrane protein folding and oligomerization: the two-stage model, Biochemistry 29 (1990) 4031–4037.
[30] D.M. Engelman, Y. Chen, C.-N. Chin, A.R.R. Curran, A.M. Dixon, A.D. Dupuy, A.S. Lee, U. Lehnert, E.E. Matthews, Y.K. Reshetnyak, A. Senes, J.-L. Popot, Membrane protein folding: beyond the two stage model, FEBS Lett. 555 (2003) 122–125. [31] S.H. White, W.C. Wimley, Membrane protein folding and stability: physical
principles, Annu. Rev. Biophys. Biomol. Struct. 28 (1999) 319–365.
[32] J. Karwatsky, R. Daoud, J. Cai, P. Gros, E. Georges, Binding of a photoaffinity analogue of glutathione to MRP1 (ABCC1) within two cytoplasmic regions (L0 and L1) as well as transmembrane domains 10–11 and 16–17, Biochemistry 42 (2003) 3286–3294.
[33] K. Koike, G. Conseil, E.M. Leslie, R.G. Deeley, S.P.C. Cole, Identification of proline residues in the core cytoplasmic and transmembrane regions of multidrug resistance protein 1 (MRP1/ABCC1) important for transport function, substrate specificity, and nucleotide interactions, J. Biol. Chem. 279 (2004) 12325–12336. [34] K. Koike, C.J. Oleschuk, A. Haimeur, S.L. Olsen, R.G. Deeley, S.P.C. Cole, Multiple
membrane-associated tryptophan residues contribute to the transport activity and substrate specificity of the human multidrug resistance protein, MRP1, J. Biol. Chem. 277 (2002) 49495–49503.
[35] D.-W. Zhang, K. Nunoya, M. Vasa, H.-M. Gu, S.P.C. Cole, R.G. Deeley, Mutational analysis of polar amino acid residues within predicted transmembrane helices 10 and 16 of multidrug resistance protein 1 (ABCC1): effect on substrate specificity, Drug Metab. Dispos. 34 (2006) 539–546.
[36] D.-W. Zhang, S.P.C. Cole, R.G. Deeley, Determinants of the substrate specificity of multidrug resistance protein 1: role of amino acid residues with hydrogen bonding potential in predicted transmembrane helix 17, J. Biol. Chem. 277 (2002) 20934–20941.
[37] D. Situ, A. Haimeur, G. Conseil, K.E. Sparks, D. Zhang, R.G. Deeley, S.P.C. Cole, Mutational analysis of ionizable residues proximal to the cytoplasmic interface of membrane spanning domain 3 of the multidrug resistance protein, MRP1 (ABCC1): glutamate 1204 is important for both the expression and catalytic activity of the transporter, J. Biol. Chem. 279 (2004) 38871–38880. [38] M. Vincent, J. Gallay, N. Jamin, M. Garrigos, B. de Foresta, The predicted
trans-membrane fragment 17 of the human multidrug resistance protein 1 (MRP1) behaves as an interfacial helix in membrane mimics, Biochim. Biophys. Acta Biomembr. 1768 (2007) 538–552.
[39] B. de Foresta, M. Vincent, M. Garrigos, J. Gallay, Transverse and tangential orientation of predicted transmembrane fragments 4 and 10 from the human multidrug resistance protein (hMRP1/ABCC1) in membrane mimics, Eur. Biophys. J. 40 (2011) 1043–1060.
[40] B. de Foresta, M. Vincent, J. Gallay, M. Garrigos, Interaction with membrane mimics of transmembrane fragments 16 and 17 from the human multidrug resistance ABC transporter 1 (hMRP1/ABCC1) and two of their tryptophan variants, Biochim. Biophys. Acta 1798 (2010) 401–414.
[41] C. Snider, S. Jayasinghe, K. Hristova, S.H. White, MPEx: a tool for exploring membrane proteins, Protein Sci. 18 (2009) 2624–2628.
[42] M. Buck, Trifluoroethanol and colleagues: cosolvents come of age. Recent studies with peptides and proteins, Q. Rev. Biophys. 31 (1998) 297–355.