HAL Id: inserm-02312357
https://www.hal.inserm.fr/inserm-02312357
Submitted on 11 Oct 2019
HAL is a multi-disciplinary open access
archive for the deposit and dissemination of
sci-entific research documents, whether they are
pub-lished or not. The documents may come from
teaching and research institutions in France or
abroad, or from public or private research centers.
L’archive ouverte pluridisciplinaire HAL, est
destinée au dépôt et à la diffusion de documents
scientifiques de niveau recherche, publiés ou non,
émanant des établissements d’enseignement et de
recherche français ou étrangers, des laboratoires
publics ou privés.
treatment
David Biau, Samuel Boulezaz, Laurent Casabianca, Moussa Hamadouche,
Philippe Anract, Sylvie Chevret
To cite this version:
David Biau, Samuel Boulezaz, Laurent Casabianca, Moussa Hamadouche, Philippe Anract, et al..
Us-ing Bayesian statistics to estimate the likelihood a new trial will demonstrate the efficacy of a new
treat-ment. BMC Medical Research Methodology, BioMed Central, 2017, 17 (1), pp.128.
�10.1186/s12874-017-0401-x�. �inserm-02312357�
R E S E A R C H A R T I C L E
Open Access
Using Bayesian statistics to estimate the
likelihood a new trial will demonstrate the
efficacy of a new treatment
David J. Biau
1,2,3*, Samuel Boulezaz
2, Laurent Casabianca
2, Moussa Hamadouche
2, Philippe Anract
1,2and Sylvie Chevret
1,4Abstract
Background: The common frequentist approach is limited in providing investigators with appropriate measures for conducting a new trial. To answer such important questions and one has to look at Bayesian statistics.
Methods: As a worked example, we conducted a Bayesian cumulative meta-analysis to summarize the benefit of patient-specific instrumentation on the alignment of total knee replacement from previously published evidence. Data were sourced from Medline, Embase, and Cochrane databases. All randomised controlled comparisons of the effect of patient-specific instrumentation on the coronal alignment of total knee replacement were included. The main outcome was the risk difference measured by the proportion of failures in the control group minus the proportion of failures in the experimental group. Through Bayesian statistics, we estimated cumulatively over publication time of the trial results: the posterior probabilities that the risk difference was more than 5 and 10%; the posterior probabilities that given the results of all previous published trials an additional fictive trial would achieve a risk difference of at least 5%; and the predictive probabilities that observed failure rate differ from 5% across arms. Results: Thirteen trials were identified including 1092 patients, 554 in the experimental group and 538 in the control group. The cumulative mean risk difference was 0.5% (95% CrI:−5.7%; +4.5%). The posterior probabilities that the risk difference be superior to 5 and 10% was less than 5% after trial #4 and trial #2 respectively. The predictive probability that the difference in failure rates was at least 5% dropped from 45% after the first trial down to 11% after the 13th. Last, only unrealistic trial design parameters could change the overall evidence accumulated to date.
Conclusions: Bayesian probabilities are readily understandable when discussing the relevance of performing a new trial. It provides investigators the current probability that an experimental treatment be superior to a reference treatment. In case a trial is designed, it also provides the predictive probability that this new trial will reach the targeted risk difference in failure rates.
Trial registration: CRD42015024176.
Keywords: Meta-analysis, Bayesian statistics, Cumulative, Direct probability, Posterior probability, Predictive probability, Superiority
* Correspondence:[email protected]
1
INSERM U1153, Paris, France
2Service de chirurgie orthopédique,Hôpital Cochin, 27 rue du faubourg
Saint-Jacques, 75014 Paris, France
Full list of author information is available at the end of the article
© The Author(s). 2017 Open Access This article is distributed under the terms of the Creative Commons Attribution 4.0 International License (http://creativecommons.org/licenses/by/4.0/), which permits unrestricted use, distribution, and reproduction in any medium, provided you give appropriate credit to the original author(s) and the source, provide a link to the Creative Commons license, and indicate if changes were made. The Creative Commons Public Domain Dedication waiver (http://creativecommons.org/publicdomain/zero/1.0/) applies to the data made available in this article, unless otherwise stated.
Biau et al. BMC Medical Research Methodology (2017) 17:128 DOI 10.1186/s12874-017-0401-x
Background
For the past decade efforts have been made, both by scien-tists, journal editors and funding sources, to increase value and reduce waste of medical research [1]. As early as 1996, the CONSORT statement required that data from a new trial should be interpreted“in the light of the totality of the available evidence” [2]. Editors later joined in by asking those submitting RCTs to set the new results in the con-text of systematic reviews or meta-analyses of the re-sults of any other relevant RCTs [3, 4]. The effect of such a policy has yet to be seen however [5, 6]. Fun-ders are also participating in order to avoid wasting of financial resources. Recently the National Institute for Health Research has stated that it “will only fund primary research where the proposed research is in-formed by a review of the existing evidence” [7].
Overall, when planning a trial researchers would like to answer three questions given the available previous evi-dence: the first is “what is the likelihood that the experimental treatment is superior to the control treat-ment given the evidence accumulated so far?”; the second is“what is the likelihood that a new trial, given some de-sign parameters and previous evidence, will demonstrate the superiority of the experimental treatment?”; and the last is“what are is likelihood that this new planned trial shifts the overall evidence accumulated in the literature?”. To summarize evidence from the literature, meta-analyses are used, based on fixed or random-effect models. In the fixed-effects model, the parameter of interest is assumed to be identical across studies and the difference between the observed proportion and the mean is only due to sam-pling error. In the random-effects model, the observed dif-ference between the proportions and the mean cannot be entirely attributed to sampling error but may rely to other unobserved factors. However, these common frequentist’s approaches are unable to answer such important ques-tions. By contrast, Bayesian statistics, that also consider the parameter of interest as a random variable, and com-bining accumulated evidence from different sources, ap-pear to fit naturally this situation. Indeed, it provides direct probability statements with regards to effect sizes and/or predictive distributions. These probabilities, for in-stance the likelihood that an experimental treatment is superior to a control treatment, can then be used to ap-preciate how any future trial would change the conclusion of the available literature [8]. In the specific setting of cu-mulative meta-analyses with recursive access to informa-tion, Bayesian approaches appear quite appropriate to identify the time when another trial becomes superfluous.
For instance, a current question among the orthopaedic community is whether patient-specific instrumentation, a recent innovative technology used during total knee re-placement to improve implant positioning, is superior to conventional instrumentation [9]. To ensure the long term
success of a knee replacement it is paramount that the best limb alignment (180°) is achieved during the oper-ation: knees which deviate by more than 3° from this angle are more likely to fail early. The standard procedure to en-sure limb alignment is to use intra-medullary jigs. Re-cently, patient specific guides based on a preoperative scanner or MRI have been developed to improve the pre-cision of limb alignment during the surgery. Seventeen studies and 10 reviews or meta-analyses have been pub-lished to address the issue in less than 4 years and there is still no evidence for a difference between both treatments.
We therefore conducted a Bayesian cumulative meta-analysis of patient-specific instrumentation compared to conventional instrumentation in patients undergoing total knee replacement. We first estimated the probabil-ity that the experimental treatment is superior to the control treatment cumulatively through time given the evidence accumulated. We then estimated the probabil-ity that a new fictive trial, based on previous evidence, would demonstrate the superiority of the experimental treatment. Last, we estimated the design requirements for a trial to change the overall evidence accumulated.
Methods
Protocol and registration
Eligibility criteria, information sources, data items and methods of the analysis were specified in advance and documented in a protocol. The protocol was registered at PROSPERO (protocol registration number: CRD420150 24176). PRISMA guidelines were followed [10].
Eligibility criteria, information sources, and search strategy
Two reviewers (SB, LC) independently evaluated studies for eligibility; disagreements between the reviewers were re-solved by consensus, and if necessary, by consultation with a third reviewer (DB). Randomized clinical trials studying conventional versus patient-specific instrumentation for total knee replacement were eligible. We considered studies including participants of any age, undergoing total knee re-placement for any reason. Conventional instrumentation included intra- or extra-medullary alignment techniques; patient-specific instrumentation included CT- or MRI-based preoperative planning. Total knee replacements per-formed with computer navigation were excluded. The pri-mary outcome measure was the proportion of failures. Failures were defined as patient with a frontal alignment departing from neutral by more than three degrees, in varus or valgus. No restriction was made on the method used for measuring the frontal alignment.
Publication in English, until January 1st, 2016 were examined. Studies were identified by searching Medline via PubMed, EMBASE and the Cochrane library. The last search was performed on May 1, 2016. Two authors (SB,
LC) selected eligible studies first on titles and abstracts and then on full text for selection criteria. Finally, the references of included studies were hand searched in order to detect additional studies. We excluded duplicate reports, pilot studies, and abstracts from meeting proceedings unless published as full-text reports in a peer-reviewed journal, given concerns related to their small sample size and study design. We used, in various relevant combinations, key-words pertinent to the groups and intervention of interest: custom-fit, custom, patient-specific, psi, patient specific in-strumentation, and knee replacement.
Data items and risk of bias in individual studies
Two investigators (SB, LC) independently extracted data from the primary texts, Appendix and Additional file 1, using a data abstraction sheet that contained fields for: first author name, trial name, year of publication and re-cruitment period, number of patients in each treatment group, crossover, imaging method used for preoperative planning in the patient-specific instrumentation group and surgical technique used in the conventional instru-mentation group, number of failures, details regarding trial design. Disagreements were resolved by consensus, and if necessary, after consultation with a third and fourth reviewer (DB, MH). The risk of bias in individual studies was assessed at the outcome level using the Cochrane collaboration’s tool [11]. Authors were con-tacted to provide additional information when relevant.
Summary measures, synthesis of results, and risk of bias across studies
Bayesian meta-analysis was performed cumulatively, on trials ordered according to publication time (Entrez date on PubMed). The risk of publication bias was assessed by funnel plots of effect estimates against sample size [12]. Consider K comparative studies reporting summary bin-ary outcomes. The data from each study, j = 1,…, K, con-stitutes a pair of independent binomial variables, X1Jand
X2j, the number of events out of n1and n2subjects in the
treatment and control arms.: X1j ~ Binom (n1, p1j) and
X2j ~ Binom (n2, p2j), where pijfori = 1, 2 are the risks in
the treatment and the control arm, respectively. In a Bayesian framework, the proportion of failures pij was
modelled through a beta-binomial model in each random-ized arm (i = 1, 2), separately. Our prior information with regards to each of these proportions is formalized by a prior that is then actualized along the meta-analyses into a posterior distribution. Indeed, the beta distribution is the conjugate prior distribution for the parameter if the data are binomial, so that the posterior is still a beta distribu-tion. First, non-informative Beta priors (i.e., uniform priors), were used to represent the large uncertainty with regards to the outcomes before any published trial data. Then, the posterior distributions computed after the trial,
were used as the priors for the next trial, and so on. We defined the posterior probability that the failure propor-tion in the experimental arm is below that in the controls, namely the risk difference, as the treatment effect meas-ure. The risk of bias across studies was assessed visually for each of the seven Cochrane collaboration’s items [11].
First, we estimated the posterior probabilities that the pro-portion of failures in the experimental group was below that observed in the control group by 5 and 10% according to the accumulated evidence, i.e. after the inclusion of each new trial in the cumulative meta-analysis; such values were considered of clinical importance in this particular setting. We then computed the predictive probabilities that given the results of all previous published trials (a priori informa-tion), the next scheduled trial would achieve a risk difference of observed failure rates of at least 5% or 10% in favour of the experimental treatment. We also assessed the likelihood that a new planned trial shifts the overall evidence accumu-lated in the literature, by simulating samples of patients with response rate in the control arm drawn from the last poster-ior (obtained at the end of the meta-analysis), with varying sample sizes and failure probability in the intervention arm, then computing the posterior probability of reaching a dif-ference of at least 5% between arms.
We finally computed the required sample size of a new trial to reach a 95% coverage probability on average for the posterior credible interval (CrI) of 5% length for the risk difference. All point estimates are presented with 95% CrI and were computed using Markov Chain Monte Carlo (MCMC) simulation (see Additional file 1 for details).
As a sensitivity analysis, frequentist cumulative and non-cumulative standard random effects meta-analyses were also performed. We used a Binomial-normal model that imposed a normal distribution on log-odds odds in treatment and control arms to incorporate the between-studies heterogeneity. Estimates of the risk difference were obtained from random-effect models using the DerSimo-nian and Laird method [13], with 95% confidence inter-vals. According to the Cochrane principles, a value of 0.5 was added to arms where no failure occurred; trials where no failures occurred were excluded from the analysis. I2 was used to quantify heterogeneity and we used the Q chi-squared statistic to test heterogeneity across trials with P < 0.1 being considered significant.
All computations were performed on R version 3.2.2 (https://www.R-project.org/), using the R2jags (https:// cran.r-project.org/web/packages/R2jags/) and rmeta (https://cran.r-project.org/web/packages/rmeta/) packages.
Patient involvement
No patients were involved in setting the research question or the outcome measures, nor were they involved in devel-oping plans for design or implementation of the study. No
patients were asked to advice on interpretation or writing up of results. There are no plans to disseminate the results of the research to study participants or the relevant patient community.
Results
Study selection, study characteristics, results of individual studies, and risk of bias within studies
Thirteen trials, published between 2013 and 2015, were identified and used, based on complete text review (Appendix Figure 4) [14–26]. Overall, 1092 patients with a mean age of 68 [67–70] years old and a mean BMI of 29.5 [28.5–30.5] were included, 554 in the experimental group and 538 in the control group (Table 1). Six studies used MRI for preoperative planning, five CT, and two studies used both (when necessary, groups were pooled to avoid the duplicate counts of patients). Individual risk differ-ences ranged from −25 to +18.5% (Appendix Figure 5a). Due to the procedure evaluated, the risk of bias was sig-nificant for all individual studies with regards to blinding since surgeons could not be blinded; however, for most studies, the outcome assessor was blinded (Table 1). Based on the funnel plot of the effect sizes of all studies we did could not identify any serious evidence in favour of a publication bias (Appendix Figure 6).
Synthesis of results, and risk of bias across studies
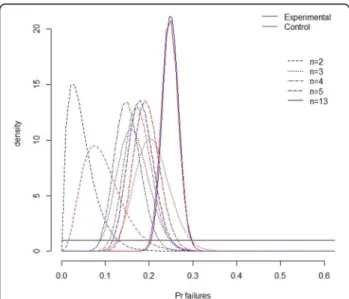
Based on the information accumulated after the last trial, the mean posterior estimates of failure probabilities in each group evolved over time to stop at 24.1% (95% CrI: 20.7%; 27.7%) in the experimental arm compared to 24.6% (95%CrI: 21.0%; 28.4%) in the control arm (Fig. 1; Table 2). In other words, patient-specific instrumentation decreased the estimated
proportion of failures by 0.5% (95% CrI: −5.7%; +4.5%) (Fig. 2; Table 2); there was no important difference with the pooled estimate obtained from the sensitivity frequentist random-effect meta-analysis (Appendix Figure 5b). The risk of bias across studies was, by design, maximum for blinding of care providers, pos-sibly significant for the randomisation and allocation concealment procedures (Appendix Figure 7).
What is the likelihood that the experimental treatment is superior to the control treatment given the evidence accumulated so far?
The posterior probabilities that the proportion of failures in the experimental group be inferior to the proportion of failures in the control group by 5 and 10% was less than 5% after trial #4 and trial #2 respectively. After all the available evidence, these probabilities were 4.2 and 0.013% (Table 2). The likelihood that the experimental treatment is superior to the control treatment is there-fore marginal at best.
What is the likelihood that the next trial, given some design parameters and previous evidence, will demonstrate the superiority of the experimental treatment?
When designing a new trial according to the evidence accumulated previously, we computed that the predict-ive probability that the failure rate was below that ob-served in controls by 5% dropped from 45% after the first trial down to 11% after the 13th; when considering difference of at least 10%, these figures decreased from 21 to 0.5%, respectively (Table 2). This argues in some
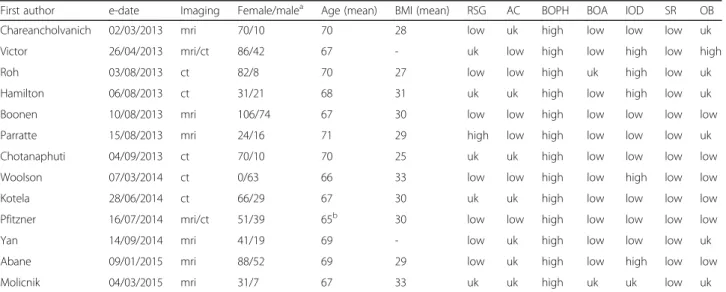
Table 1 Description of the retrieved trials
First author e-date Imaging Female/malea Age (mean) BMI (mean) RSG AC BOPH BOA IOD SR OB
Chareancholvanich 02/03/2013 mri 70/10 70 28 low uk high low low low uk
Victor 26/04/2013 mri/ct 86/42 67 - uk low high low high low high
Roh 03/08/2013 ct 82/8 70 27 low low high uk high low uk
Hamilton 06/08/2013 ct 31/21 68 31 uk uk high low high low uk
Boonen 10/08/2013 mri 106/74 67 30 low low high low low low low
Parratte 15/08/2013 mri 24/16 71 29 high low high low low low uk
Chotanaphuti 04/09/2013 ct 70/10 70 25 uk uk high low low low low
Woolson 07/03/2014 ct 0/63 66 33 low low high low high low low
Kotela 28/06/2014 ct 66/29 67 30 uk uk high low low low low
Pfitzner 16/07/2014 mri/ct 51/39 65b 30 low low high low low low low
Yan 14/09/2014 mri 41/19 69 - low uk high low low low uk
Abane 09/01/2015 mri 88/52 69 29 low uk high low high low low
Molicnik 04/03/2015 mri 31/7 67 33 uk uk high uk uk low uk
RSG random sequence generation, AC allocation concealment, BOPH blinding of participants/care providers, BOA blinding of outcome assessors, IOD incomplete outcome data, SR selective reporting, OB other biases.a
sex ratio in shown for patients randomized and outcome is shown for patients analyzed, therefore numbers may differ.bmean of group’s median
sense that the likelihood of any consequent benefit for patients in the new trial is rather low.
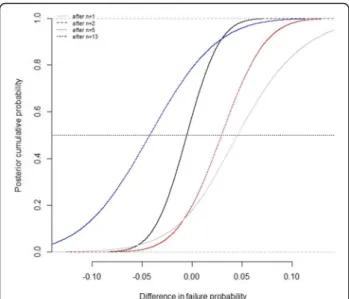
What is the likelihood that a new planned trial shifts the overall evidence accumulated in the literature?
Given the evidence provided by the meta-analysis, that is a 24.1% of failures in the experimental vs. 24.6% in the control arm, the predictive probabilities that a new 14th fictive simulated trial shifts the evidence in favour of the patient-specific instrumentation were rather small unless the number of patients included were large and the pro-portion of failures in the experimental group low com-pared to previous estimates (Fig. 3).
Discussion
The increasing number of randomized controlled trials (RCT) reported in the medical literature is associated with redundancy [27]. Scientists, journal editors and funding sources, are increasingly aware of this issue and actions are gradually being taken in order to reduce the waste of medical research [1, 3, 4, 7]. Using Bayesian inference we were able to answer three important questions an investi-gator should ask when considering another trial. In the present case we showed that, after the fourth trial, the probabilities that the experimental treatment decreases the proportion of failures by 5% was less than 20%, and by 10% less than 2%. After the next trial, these proportions dropped to 1% or less erasing all hopes of ever demon-strating the superiority of the experimental treatment. Moreover, the planning of another trial at that time, given reasonable design parameters relative to previous trials, had only a 2% probability of demonstrating the superiority of the experimental treatment. Last we showed that only
an overly-optimistic effect size can pretend changing the evidence accumulated after the last trial.
Our work has several limitations. First, the analyses pre-sented are performed on the basis that the evidence pub-lished is appropriate, based on quality-based trials. We only considered RCTs while pooling results from RCTs and non-randomized studies using Bayesian methods appears promising [28]. Moreover, initial evidence is sometimes reliable, for various reasons, and initially favourable or un-favourable results can later be challenged [29]. Investigators could therefore plan a trial contrary to the evidence accu-mulated. Second, trialists and methodologists usually see the evidential landscape from a different perspective. The former will think their study is unique and target usually large effect sizes contrary to what is suggested by the evi-dence accumulated by the latter [30]. Numerous reasons, beyond optimism bias, can explain this discrepancy, such as differences in patient selection and improvements of the ex-perimental treatment. Last, we only considered beta-binomial models for each trial arm, assuming independence between the failures from the two arms of each trial, while joint model such as that proposed by Sarmanov could have been used to handle potential sources of correlation within each trial [31]. Note also that beta-binomial model has been recently reported as a feasible alternative to the standard random-effects model for meta-analysis of odds ratios [32].
Frequentist methods have limited reach to help investiga-tors in deciding if the trial they plan is relevant. Practitioners and methodologists will usually get an approximate answer to this question by looking at, or per-forming, an up-dated meta-analysis of all previous pub-lished trials to yield a pooled estimate of the treatment effect. This is, however, rarely done [30, 33, 34]. The first reason for this failure may be that the pooled estimate of treatment effect does not speak to a practitioner enough, all the more when the volume of the evidence accumulated is small. For instance, in the present cumulative meta-analysis, after the fourth trial, the estimation of the risk dif-ference was−0.013 (95% CrI -0.095; 0.069) in favour of the experimental treatment. Given the rather centred pooled estimate and its credible interval, one could see that evi-dence as inconclusive; effect sizes of 5 and 10% in favour of the experimental treatment could be deemed reasonable [35]. On the contrary the Bayesian approach provides a quite readily understandable quantity: there is little chance that the experimental treatment is superior to the control treatment. The second reason is that trialists looking at the previous evidence in a frequentist perspective to define de-sign parameters are likely to succumb to an optimism bias, namely the unwarranted belief in the efficacy of new ther-apies, and hence distort the planning of the trial in favour of the experimental treatment [36]. In a retrospective ana-lysis of 359 trials Djulbegovic and colleagues showed that investigators consistently overestimated the expected
Fig. 1 Evolution over the meta-analysis of the uncertainty in the proportion of failures in both arms, as quantified by the prior (black line) then actualized into a posterior distribution aftern = 2, 3, 4, 5, and 13 trials
Table 2 Estimates of the risk difference FirsFirs t autho r e dat e Nb Eve nts Nb Event s Cum ulative Eviden ce Fictive Trial Me an posterior esti mates of out lier probabilities Estimated risk differ ence a (95% CrI) Pr. risk diff. Above Addition al planned sample size Predi ctive proba bility that proportion of failu res in the next sample was in the treat ed compared to the control Con trol Treated Co ntrol Treated 5% 10% 5% less 10 % less Chare anchol vanich 2013 –03-0 2 40 3 40 1 0. 0952 0.0476 − 0.04 8 (− 0.161; +0,05 9) 0.464 0.16 -48.5% 25 .6% Victor 2013 –04-2 6 64 18 61 15 0. 2075 0.1650 − 0.04 2 (− 0.100; +0.24 2) 0.444 0.14 125 47.5% 24 .0% Roh 2013 –08-0 3 48 5 42 5 0. 1753 0.1517 − 0.02 4 (− 0.107; 0.059) 0.267 0.036 90 33.3% 9. 8% Ham ilton 2013 –08-0 6 26 8 26 9 0. 1944 0.1813 − 0.01 3 (− 0.095; 0.069) 0.187 0.018 52 26.3% 6. 6% Boone n 2013 –08-1 0 82 15 86 26 0. 1908 0.2218 0.031 (− 0.038; 0.101) 0.011 0.0001 2 168 5.4% 0. 5% Parr atte 2013 –08-1 5 20 2 20 4 0. 1844 0.2202 0.036 (− 0.031; 0.102) 0.0057 0.0000 3 40 3.8% 0. 2% Chota naphuti 2013 –09-0 4 40 5 40 2 0. 1770 0.1987 0.022 (− 0.039; 0.083) 0.010 0.0000 4 80 5.2% 0. 3% Wools on 2014 –03-0 7 26 10 22 9 0. 1925 0.2124 0.020 (− 0.039; 0.081) 0.011 0.0000 5 48 5.6% 0. 3% Kotela 2014 –06-2 8 46 14 49 24 0. 2056 0.2474 0.042 (− 0.016; 0.101) 0.001 0.0000 01 95 1.5% <0 .0% Pfitzn er 2014 –07-1 6 30 13 60 11 0. 2217 0.2388 0.017 (− 0.039; 0.073) 0.009 0.0000 2 90 4.9% 0. 2% Yan 2014 –09-1 4 30 13 30 8 0. 2357 0.2406 0.005 (− 0.050; 0.060) 0.024 0.0000 9 60 8.4% 0. 4% Abane 2015 –01-0 9 67 22 59 19 0. 2476 0.2495 0.002 (− 0.050; 0.054) 0.025 0.0000 6 126 8.6% 0. 4% Molic nik 2015 –03-0 4 19 4 19 0 0. 2463 0.2410 − 0.00 5 (− 0.057; 0.045) 0.042 0.0001 3 38 11.2% 0. 5% *Negative values favour the experimental treatment. Number of patients in the control (n. ctr) and experimental (n. exp) groups; number of events (ev . ctr and ev. exp); credibility interval (ctrCrI); probability (Pr) Estimation of the probabilities that the proportion of outliers in the experimental group is below that observed in the control group by 5 and 10% accor ding to the accumulated evidence. Estimation of the Bayes predictive probability that the risk difference be of at least 5 and 10% in favour on the experimental group
treatment effect and this was more pronounced for incon-clusive trials [35]. On the contrary, the formal use of prior information in a Bayesian framework could help in redu-cing this optimism bias. In the present study, given the evi-dence accumulated so far and the sample size used by investigators, the probabilities that the planned trial had more than a 80% chance to demonstrate an effect size of at least 5% quickly fell below 10%.
The Bayesian approach provides readily usable probabil-ities for clinicians and policymakers. With those, they can directly appreciate the relevance of a new trial, the prob-ability that this trial will succeed, and how likely it is to change the evidence accumulated so far. Moreover meta-analyses are often performed once a relatively important
amount of evidence has been reached, while one may wish to repeatedly perform cumulative analysis of all the trial data accumulated starting at an early time. In this frame-work, Bayesian methods are particularly useful given their natural fit to sequentially accumulated data and their dir-ect translation in terms of probability statements with regards to the effect size. The Bayesian approach should not be seen in opposition to the more common frequen-tist approach but more so as a complementary viewpoint. If used appropriately, it could help clinicians designing successful trials early and convince policymakers to aban-don the funding of unnecessary later trials.
Although the probabilities presented seem more easily understandable, it remains to be demonstrated that clini-cians, investigators, and policymakers are more receptive to those. Frequentist methods provide some help in decid-ing whether another trial is justified, but they lack clarity [37]. Bayesian statistics have attracted a rather unreason-able mistrust over time and may fail to convince trialists used to look at things from a frequentist standpoint [38]. Future research should aim at measuring how the scien-tific community is responsive to these estimates.
Conclusions
Bayesian probabilities are readily understandable when discussing the relevance of performing a new trial. It provides investigators the current probability, that is given all previous evidence, that an experimental treat-ment be superior to a reference treattreat-ment. In case a trial is designed, it also provides the predictive probability that this new trial be successful, namely that it will reach the targeted risk difference in failure rates.
Appendix
F4
Fig. 2 Posterior distribution function of the difference in failures rates across arms; for instance, there was a 0.042 posterior probability, after the results of the 13 trials that the failures rate in the experimental was below that of the control by 5%
Fig. 3 Predictive probabilities that a new 14th fictive simulated trial shifts the evidence in favour of the experimental group according to
various design parameters Fig. 4 Flow diagram of study selection
F5 F6 F7
Fig. 5 Forest plot of the risk difference in failure rates between the control and experimental groups in a non-cumulative frequentist meta-analysis (I2= 45%, Q = 0.04) (a) and in a cumulative frequentist meta-analysis (b). Negative estimates are in favour of the experimental group
Fig. 6 Funnel plots of effect estimates against sample size
Additional file
Additional file 1: Bayesian Analyses. (DOCX 21 kb)
Abbreviations
BMI:Body mass index; CrI: Credibility interval; CT: Computer tomography; IQR: Interquartile range; MRI: Magnetic resonance imaging; RCT: Randomized controlled trial
Acknowledgements Not applicable
Funding None
Availability of data and materials
The datasets used and/or analysed during the current study are available from the corresponding author on reasonable request.
Authors’ contributions
DB, MH, PA and SC were responsible for the study concept. DB, SB, LC, MH, PA and SC were responsible for study design. SB was responsible for the literature search. SB, LC, MH, and DB were responsible for study selection. SB, and LC were responsible for data extraction. DB, and SC were responsible for statistical analysis. DB, SB, LC, MH, PA, and SC were responsible for data analysis and interpretation. DB, and SC were responsible for drafting the manuscript. DB, SB, LC, MH, PA and SC were responsible for critical revision of the manuscript. DB is the guarantor. All authors read and approved the final manuscript.
Ethics approval and consent to participate Not applicable.
Consent for publication Not applicable.
Competing interests
DB, SB, LC, SC have no competing interests. PA and MH have received personal fees from implant manufacturers in the last 3 years that might have an interest in the submitted work.
Publisher’s Note
Springer Nature remains neutral with regard to jurisdictional claims in published maps and institutional affiliations.
Author details
1INSERM U1153, Paris, France.2Service de chirurgie orthopédique,Hôpital
Cochin, 27 rue du faubourg Saint-Jacques, 75014 Paris, France.3Université
Paris-Descartes, Paris 5, Paris, France.4Université Paris-Diderot, Paris 7, Paris, France.
Received: 11 March 2017 Accepted: 2 August 2017
References
1. Chalmers I, Bracken MB, Djulbegovic B, Garattini S, Grant J, Gülmezoglu AM, Howells DW, Ioannidis JP, Oliver S. How to increase value and reduce waste when research priorities are set. Lancet. 2014;383(9912):156–65.
2. Altman DG. Better reporting of randomised controlled trials: the CONSORT statement. BMJ. 1996;313(7057):570–1.
3. Clarke M. Doing new research? Don't forget the old. PLoS Med. 2004;1(2):e35. 4. Young C, Horton R. Putting clinical trials into context. Lancet. 2005;
366(9480):107–8.
5. Clark S, Horton R. Putting research into context—revisited. Lancet. 2010; 376(9734):10–1.
6. Clarke M, Hopewell S, Chalmers I. Clinical trials should begin and end with systematic reviews of relevant evidence: 12 years and waiting. Lancet. 2010; 376(9734):20–1.
7. NHS National Institute for Health Research. NIHR Research for Patient Benefit (RfPB) Programme Guidance Information for Applicants. Date of issue: 10 August 2016. p. 14.
8. Spiegelhalter D, Abrams K, Myles J. Bayesian Approaches to Clinical Trials and Health-care Evaluation. NewYork: Wiley; 2004.
9. Thienpont E, Bellemans J, Delport H, Van Overschelde P, Stuyts B, Brabants K, Victor J. Patient-specific instruments: industry's innovation with a surgeon's interest. Knee Surg Sports Traumatol Arthrosc. 2013;21(10):2227–33. 10. Liberati A, Altman DG, Tetzlaff J, Mulrow C, Gøtzsche PC, Ioannidis JP, Clarke
M, Devereaux PJ, Kleijnen J, Moher D. The PRISMA statement for reporting systematic reviews and meta-analyses of studies that evaluate healthcare interventions: explanation and elaboration. BMJ. 2009;339:b2700.
11. Higgins JP, Altman DG, Gøtzsche PC, Jüni P, Moher D, Oxman AD, Savovic J, Schulz KF, Weeks L, Sterne JA, Cochrane Bias Methods Group, Cochrane Statistical Methods Group. The Cochrane Collaboration's tool for assessing risk of bias in randomised trials. BMJ. 2011;343:d5928.
12. Egger M, Smith GD, Schneider M, Minder C. Bias in metaanalysis detected by a simple, graphical test. BMJ. 1997;315:629–34.
13. DerSimonian R, Laird N. Meta-analysis in clinical trials. Control Clin Trials. 1986;7:177–88.
14. Abane L, Anract P, Boisgard S, Descamps S, Courpied JP, Hamadouche M. A comparison of patient-specific and conventional instrumentation for total knee arthroplasty: a multicentre randomised controlled trial. Bone Joint J. 2015;97-B(1):56–63.
15. Boonen B, Schotanus MG, Kerens B, van der Weegen W, van Drumpt RA, Kort NP. Intra-operative results and radiological outcome of conventional and patient-specific surgery in total knee arthroplasty: a multicentre, randomised controlled trial. Knee Surg Sports Traumatol Arthrosc. 2013;21(10):2206–12. 16. Chareancholvanich K, Narkbunnam R, Pornrattanamaneewong C. A
prospective randomised controlled study of patient-specific cutting guides compared with conventional instrumentation in total knee replacement. Bone Joint J. 2013;95-B(3):354–9.
17. Chotanaphuti T, Wangwittayakul V, Khuangsirikul S, Foojareonyos T. The accuracy of component alignment in custom cutting blocks compared with conventional total knee arthroplasty instrumentation: prospective control trial. Knee. 2014;21(1):185–8.
18. Hamilton WG, Parks NL, Saxena A. Patient-specific instrumentation does not shorten surgical time: a prospective, randomized trial. J Arthroplast. 2013; 28(8 Suppl):96–100.
19. Kotela A, Kotela I. Patient-specific computed tomography based instrumentation in total knee arthroplasty: a prospective randomized controlled study. Int Orthop. 2014;38(10):2099–107.
20. Molicnik A, Naranda J, Dolinar D. Patient-matched instruments versus standard instrumentation in total knee arthroplasty: a prospective randomized study. Wien Klin Wochenschr. 2015;127(Suppl 5):S235–40. 21. Parratte S, Blanc G, Boussemart T, Ollivier M, Le Corroller T, Argenson JN.
Rotation in total knee arthroplasty: no difference between patient-specific and conventional instrumentation. Knee Surg Sports Traumatol Arthrosc. 2013;21(10):2213–9.
22. Pfitzner T, Abdel MP, von Roth P, Perka C, Hommel H. Small improvements in mechanical axis alignment achieved with MRI versus CT-based patient-specific instruments in TKA: a randomized clinical trial. Clin Orthop Relat Res. 2014;472(10):2913–22.
23. Roh YW, Kim TW, Lee S, Seong SC, Lee MC. Is TKA using patient-specific instruments comparable to conventional TKA? A randomized controlled study of one system. Clin Orthop Relat Res. 2013;471(12):3988–95. 24. Victor J, Dujardin J, Vandenneucker H, Arnout N, Bellemans J.
Patient-specific guides do not improve accuracy in total knee arthroplasty: a prospective randomized controlled trial. Clin Orthop Relat Res. 2014;472(1):263–71.
25. Woolson ST, Harris AH, Wagner DW, Giori NJ. Component alignment during total knee arthroplasty with use of standard or custom instrumentation: a randomized clinical trial using computed tomography for postoperative alignment measurement. J Bone Joint Surg Am. 2014;96(5):366–72. 26. Yan CH, Chiu KY, Ng FY, Chan PK, Fang CX. Comparison between
patient-specific instruments and conventional instruments and computer navigation in total knee arthroplasty: a randomized controlled trial. Knee Surg Sports Traumatol Arthrosc. 2015;23(12):3637–45.
27. Fergusson D, Glass KC, Hutton B, Shapiro S. Randomized controlled trials of aprotinin in cardiac surgery: could clinical equipoise have stopped the bleeding? Clin Trials. 2005;2(3):218–29. discussion 229-32
28. Schmidt AF, Klugkist I, Klungel OH, Nielen M, de Boer A, Hoes AW, et al. Bayesian methods including nonrandomized study data increased the efficiency of postlaunch RCTs. J Clin Epidemiol. 2015;68(4):387–96. 29. Pereira TV, Horwitz RI, Ioannidis JP. Empirical evaluation of very large
treatment effects of medical interventions. JAMA. 2012;308(16):1676–84. 30. Bakbergenuly I, Kulinskaya E. Beta-binomial model for meta-analysis of odds
ratios. Stat Med. 2017;36:1715–34.
31. Robinson KA, Goodman SN. A systematic examination of the citation of prior research in reports of randomized, controlled trials. Ann Intern Med. 2011;154:50–5.
32. Sarmanov O. Generalized normal correlation and two-dimensional Fréchet classes. Sov Math Dokl. 1966;7:596–9.
33. Clark T, Berger U, Mansmann U. Sample size determinations in original research protocols for randomised clinical trials submitted to UK research ethics committees: review. BMJ. 2013;346:f1136.
34. Goudie AC, Sutton AJ, Jones DR, Donald A. Empirical assessment suggests that existing evidence could be used more fully in designing randomised controlled trials. J Clin Epidemiol. 2010;63:983–91.
35. Djulbegovic B, Kumar A, Magazin A, Schroen AT, Soares H, Hozo I, Clarke M, Sargent D, Schell MJ. Optimism bias leads to inconclusive results-an empirical study. J Clin Epidemiol. 2011;64(6):583–93.
36. Chalmers I, Matthews R. What are the implications of optimism bias in clinical research? Lancet. 2006;367(9509):449–50.
37. Ferreira ML, Herbert RD, Crowther MJ, Verhagen A, Sutton AJ. When is a further clinical trial justified? BMJ. 2012;345:e5913.
38. Howard G, Coffey CS, Cutter GR. Is Bayesian analysis ready for use in phase III randomized clinical trials? Beware the sound of the sirens. Stroke. 2005; 36(7):1622–3.
• We accept pre-submission inquiries
• Our selector tool helps you to find the most relevant journal • We provide round the clock customer support
• Convenient online submission • Thorough peer review
• Inclusion in PubMed and all major indexing services • Maximum visibility for your research
Submit your manuscript at www.biomedcentral.com/submit
![Fig. 7 Risk of bias across studies according to the Cochrane collaboration tool [11]](https://thumb-eu.123doks.com/thumbv2/123doknet/14700908.564750/9.892.83.809.868.1069/fig-risk-bias-studies-according-cochrane-collaboration-tool.webp)
