Publisher’s version / Version de l'éditeur:
Vous avez des questions? Nous pouvons vous aider. Pour communiquer directement avec un auteur, consultez la première page de la revue dans laquelle son article a été publié afin de trouver ses coordonnées. Si vous n’arrivez pas à les repérer, communiquez avec nous à [email protected].
Questions? Contact the NRC Publications Archive team at
[email protected]. If you wish to email the authors directly, please see the first page of the publication for their contact information.
https://publications-cnrc.canada.ca/fra/droits
L’accès à ce site Web et l’utilisation de son contenu sont assujettis aux conditions présentées dans le site LISEZ CES CONDITIONS ATTENTIVEMENT AVANT D’UTILISER CE SITE WEB.
The Journal of Biological Chemistry, 281, October 50, pp. 38440-38447, 2006-10
READ THESE TERMS AND CONDITIONS CAREFULLY BEFORE USING THIS WEBSITE. https://nrc-publications.canada.ca/eng/copyright
NRC Publications Archive Record / Notice des Archives des publications du CNRC :
https://nrc-publications.canada.ca/eng/view/object/?id=b87e7e23-4061-4d4d-afc7-c768c298a8b5
https://publications-cnrc.canada.ca/fra/voir/objet/?id=b87e7e23-4061-4d4d-afc7-c768c298a8b5
NRC Publications Archive
Archives des publications du CNRC
This publication could be one of several versions: author’s original, accepted manuscript or the publisher’s version. / La version de cette publication peut être l’une des suivantes : la version prépublication de l’auteur, la version acceptée du manuscrit ou la version de l’éditeur.
For the publisher’s version, please access the DOI link below./ Pour consulter la version de l’éditeur, utilisez le lien DOI ci-dessous.
https://doi.org/10.1074/jbc.M606736200
Access and use of this website and the material on it are subject to the Terms and Conditions set forth at
Amyloid-β-(1-42) increases ryanodine receptor-3 expression and
function in neurons of TgCRND8 mice
Supnet, Charlene; Grant, Jeffrey; Kong, Hong; Westaway, David; Mayne,
Michael
Amyloid--(1– 42) Increases Ryanodine Receptor-3
Expression and Function in Neurons of TgCRND8 Mice
*
Received for publication, July 14, 2006, and in revised form, October 5, 2006 Published, JBC Papers in Press, October 18, 2006, DOI 10.1074/jbc.M606736200 Charlene Supnet‡§, Jeff Grant‡¶1, Hong Kong‡, David Westaway储, and Michael Mayne‡§¶**2
From the‡Institute for Nutrisciences and Health, National Research Council of Canada, Charlottetown, Prince Edward Island C1A 5T1, the§Department of Biomedical Sciences, Atlantic Veterinary College/University of Prince Edward Island, Charlottetown, Prince Edward
Island C1A 4P3, the¶Department of Pharmacology and Therapeutics, University of Manitoba, Winnipeg, Manitoba R3E 0T6,储Centre for Research in Neurodegenerative Disease, University of Toronto, Toronto, Ontario M5S 3H2, and **Division of Neurodegenerative Disorders, St. Boniface General Hospital Research Centre, University of Manitoba, Winnipeg, Manitoba R2H 2A6, Canada
Disruption of intracellular calcium homeostasis precedes the neurodegeneration that occurs in Alzheimer disease (AD). Of the many neuronal calcium-regulating proteins, we focused on endo-plasmic reticulum (ER)-resident ryanodine receptors (RyRs) because they are increased in the hippocampus of mice expressing mutant presenilin-1 and are associated with neurotoxicity. Others have observed that ryanodine binding is elevated in human post-mortem hippocampal regions suggesting that RyR(s) are involved in AD pathogenesis. Here we report that extracellular amyloid-(A)-(1– 42) specifically increased RyR-3, but not RyR-1 or RyR-2, gene expression in cortical neurons from C57Bl6 mice. Furthermore, endogenously produced A-(1– 42) increased RyR-3 mRNA and protein in cortical neurons from transgenic (Tg)CRND8 mice, a mouse model of AD. Increased RyR-3 mRNA and protein was also observed in brain tissue from 4- to 4.5-month-old Tg animals compared with non-Tg littermate controls. In experiments performed in nominal extracellular calcium, neu-rons from Tg mice had significant increases in intracellular cal-cium following ryanodine or glutamate treatment compared with littermate controls, which was abolished by treatment with small interfering RNA directed to RyR-3, indicating that the higher levels of calcium originated from RyR-3-regulated stores. Taken together, these observations suggest that A-(1– 42)-mediated changes in intracellular calcium homeostasis is regulated in part through a direct increase of RyR-3 expression and function.
Alzheimer disease (AD)3 is a neurodegenerative disorder
characterized by neuritic plaques composed of aggregated
extracellular amyloid- (A), intracellular neurofibrillary tan-gles, and containing selective neuron and synapse loss leading to irreversible cognitive decline and memory impairment (1). Although the cause of AD is still unknown, it is believed that accumulation of A in the brain is an initial pathogenic event (2). A-(1– 42) is a fibrillogenic peptide resulting from the sequential endoproteolytic cleavage of amyloid precursor pro-tein by - and ␥-secretase, and its overproduction and deposi-tion are associated with early-onset (or familial) and sporadic AD (3). Consequently, there is an extensive effort to determine the molecular and cellular actions of A on neurons and glial cells.
Alterations in intracellular calcium (Ca2⫹
i) homeostasis
con-stitute an early signaling event that initiates the manifestation of AD (4). Ca2⫹
ilevels are maintained by voltage-, ligand-gated,
or store-operated Ca2⫹channels on the plasmalemma and by
endoplasmic reticulum (ER)-resident channels (5). Several studies have indicated that disruption of ER-regulated Ca2⫹
i
homeostasis is associated with neurotoxicity in AD (6). The ER is an important dynamic Ca2⫹source and sink, it regulates
neu-rotransmitter release, synaptic plasticity, gene expression, and signal transduction to the nucleus (7). Ryanodine receptors (RyRs) and inositol 1,4,5-trisphosphate receptors (IP3Rs) are
the two major Ca2⫹release channels found on the ER (8) and
are activated through Ca2⫹-induced Ca2⫹release and IP 3
-in-duced Ca2⫹release, respectively (9).
Our study focuses on the role of RyRs in the regulation of Ca2⫹
i homeostasis because others have observed that
hip-pocampal brain specimens from AD patients with early cogni-tive decline have increased ryanodine binding, suggescogni-tive of increased RyR levels (1). We observed that RyR expression and function were increased in neurons that expressed mutant PS-1 (10). Furthermore, high levels of RyRs mediated dysregulation of Ca2⫹
iin cortical neurons from other mouse models of AD
(11–13). In brain, RyRs are concentrated in postsynaptic neu-rons, astrocytes and oligodendrocytes, where they regulate Ca2⫹
ilevels, membrane potential, and second messenger
sys-tems. Three isoforms of RyRs have been identified as follows: type-1, which is found in skeletal muscle; type-2, which is con-centrated in the heart; and type-3, which is concon-centrated in hippocampus (14), cerebral cortex, and corpus striatum (15). All isoforms exist in brain, where RyR-2 is the most abundant, but previous studies give no indication as to which isoform is *This work was supported in part by the Manitoba Health Research Council,
an industry award from the Alzheimer Society of Canada, Canadian Insti-tute for Health Research, and AstraZeneca. The costs of publication of this article were defrayed in part by the payment of page charges. This article must therefore be hereby marked “advertisement” in accordance with 18 U.S.C. Section 1734 solely to indicate this fact.
1Supported by a graduate student fellowship from the Alzheimer Society of
Canada.
2To whom correspondence should be addressed: Institute of Nutrisciences
and Health, National Research Council of Canada, Rm. MO-02, 93 Mount Edward Rd., Charlottetown, Prince Edward Island C1A 5T1, Canada. Tel.: 902-566-7465; Fax: 902-569-4289; E-mail: [email protected].
3The abbreviations used are: AD, Alzheimer disease; ER, endoplasmic
reticu-lum; RyR, ryanodine receptor; Ry, ryanodine; Tg, transgenic; RT, reverse transcription; ANOVA, analysis of variance; IP3R, inositol
1,4,5-trisphos-phate receptor; APP, amyloid precursor protein; CHAPS, 3-[(3-cholamido-propyl)dimethylammonio]-1-propanesulfonic acid; siRNA, small interfer-ing RNA; LTP, long term potentiation; LTD, long term depression; AUC, area under the curve; Ca2⫹
i, intracellular calcium; GSR, GeneSilencer reagent.
at CISTI - Natl Research Council on June 29, 2009
www.jbc.org
important in the dysregulation of Ca2⫹
i homeostasis in AD
neurons.
The way A regulates the expression and function of the machinery that mediates disruption of Ca2⫹
ihomeostasis in
AD remains unclear. Here we report that high levels of A-(1– 42) selectively elevated RyR-3 mRNA and protein levels in vitro and in vivo. Functionally, increased RyR-3 facilitated significant increases in Ca2⫹
i levels following ryanodine or glutamate
treatment. These observations highlight a possible role for RyR-3 in the AD pathology.
EXPERIMENTAL PROCEDURES
Animals and Neuronal Cultures—APP695 (KM670/ 671NL⫹V717F) transgenic (Tg) CRND8 mice were a gift from Dr. David Westaway (University of Toronto) and have been described previously to exhibit A plaques and cognitive defects by 3 months of age (16). Timed pregnant C57Bl6 mice were obtained from the animal housing facility at the University of Manitoba. Cerebral cortices were dissected from embryonic day 16 C57Bl6 or CRND8 (non-Tg or Tg) fetuses and used for primary culture of cortical neurons as described previously (10). CRND8 fetuses were genotyped for the APP695 double mutation by real time PCR (Platinum TaqDNA polymerase; Invitrogen) before cell dissociation and tissue pooling. The sequences of primers used for double mutant APP695 were as follows: 5⬘ TGT CCA AGA TGC AGC AGA ACG GCT ACG AAAA and 3⬘ AGA AAT GAA GAA ACG CCA AGC GCC GTG ACT. PCR products were generated by 30 cycles of 94/68/ 72 °C. PCR product levels were determined during each cycle by SYBR-Green I (1/10,000 dilution; Molecular Probes, Eugene, OR) using iCycler iQ real time PCR detection system (Bio-Rad). Non-Tg and TgCRND8 cortical tissues were pooled separately and seeded at 8 ⫻ 105cells per well onto poly-D-lysine
(Sigma)-coated 6-well culture plates, 6.5 ⫻ 105cells per 40-mm glass
coverslips for Ca2⫹imaging experiments, or 8 ⫻ 105cells per
25-mm glass coverslips for immunofluorescence assay. CRND8 cortical neurons were maintained as above. Experiments were performed on C57Bl6 primary cortical neurons following 8 days of in vitro culture. Experiments conducted on non-Tg or TgCRND8 cultures were completed following 5 days of in vitro culture to ensure high viability of Tg neurons. Cultures were ⬃80% MAP-2 (Chemicon, Sunnyville, CA)-positive neurons and 20% were glial fibrillary acidic protein (Abcam, Cambridge, MA)-positive astrocytes by immunofluorescence assay (data not shown).
A Treatments of Primary Cortical Neurons—A-(25–35), A-(35-25), A-(1– 40), A-(1– 42), and A-(42-1) peptides (Bachem, Torrance, CA) were prepared as 200 Mstocks in
Locke’s buffer containing 154 mMNaCl, 3.6 mMNaHCO3, 5.6
mMKCl, 1.0 mMMgCl2, 5 mMglucose, 5 mMHEPES, and 2.3
mMCaCl2(Fisher), pH 7.2, and incubated at 37 °C (5% CO2
atmosphere) 24 h prior to use. C57Bl6 neurons were incubated with 1000 nMof A-(25–35), A-(35-25),A-(1– 40), A-(1–
42), or A-(42-1) peptide for 18 h or with 100 or 1000 nM
iono-mycin (Sigma) for 30 min in conditioned media. Non-Tg and TgCRND8 primary cortical neurons were incubated with 1000 nMof A-(1– 40), A-(1– 42), and A-(42-1), peptide or 1.3
g/ml A-(1– 42) antibody (rabbit polyclonal IgG)
(BIO-SOURCE) or as a negative control 1.3 g/ml gp-116 (HHV-6) antibody (mouse monoclonal IgG) (Advanced Biotechnologies, Inc., Columbia, MD) for 18 h.
Reverse Transcription-PCR—Total RNA was purified from 8 ⫻ 105neurons or a small cortical section of the right
hemi-sphere of the brain (⬃10 mg) from non-Tg and TgCRND8 mice using the GenElute Total Mammalian RNA isolation kit (Sigma). RT-PCR amplification of RyR-1 and RyR-3 mRNA was conducted as outlined previously (10). PCR amplification of RyR-2 mRNA was conducted using primers 5⬘ GAA TCA GTG AGT TAC TGG GCA TGG and 3⬘ CTG GTC TCT GAG TTC TCC AAA AGC, yielding a product of 650 bp. RyR-2 PCR prod-ucts were generated by 35 cycles of 94/53/72 °C. IP3R-1 levels
were determined using 5⬘ TCA TGG AAA GCA GAC ACG AT and 3⬘ CCG CTC TGT GGT GTA ATA TA yielding a PCR product of 404 bp, generated by 30 cycles of 94/54/72 °C. SERCA-2b levels were determined using 5⬘ GGG AGT GGG GCA GTG GCA GC and 3⬘ CGT CTC TCT GGG CTG AGG GG yielding a PCR product of 350 bp, generated by 30 cycles of 94/62/72 °C. -Actin levels were determined using 5⬘ ATG GAT GAC GAT ATC GCT GC and 3⬘ CGT ACA TGG CTG GGG TGT TG primers that yielded a PCR product of 399 bp, generated by 25 cycles of 94/53/72 °C. Alignment analysis of each primer was conducted to ensure that they were gene- and isoform-specific. Densitometric analysis of RT-PCR products was performed using NIH Image software, version 1.60. RyR pixel density levels were normalized to -actin levels and are depicted as fold changes, where the untreated condition is con-sidered 1-fold.
Western Blot Analysis—Non-Tg and TgCRND8 brains were harvested from 4- to 4.5-month-old mice (16 –18 weeks) sacri-ficed by intraperitoneal injection of 50 mg/kg pentobarbital (Bimeda-MTC Animal Health Inc., Cambridge, Ontario, Can-ada) followed by decapitation. Whole brains were dissected on ice into cerebellar, cortical, hippocampal, and basal regions (the remainder of tissue after the removal of the cortex, hippocam-pus, and brain stem). Tissue was immediately homogenized on ice with 400 l of lysis buffer containing 25 mMTris, 50 mM
HEPES, pH 7.4, 137 mMNaCl, 1% CHAPS, 2.5 mM
dithiothre-itol (Fisher) and protease inhibitor mixture (Roche Applied Sci-ence). Samples were incubated on ice for 1 h and then centri-fuged at 950 ⫻ g to pellet insoluble proteins. 125 g of supernatant was loaded onto a 3– 8% Tris acetate NuPAGE威 gradient gel (Invitrogen) and transferred under reducing con-ditions onto 0.4 m polyvinylidene difluoride membranes (Fisher) on ice for 24 h at 20 V. Membranes were blocked with 5% nonfat milk in TBS for 1 h at room temperature and incu-bated in blocking buffer with 1/1000 dilution of RyR-1, -2, or -3 antibodies overnight at 4 °C (isoform-specific RyR rabbit poly-clonal antibodies were a gift from Dr. V. Sorrentino, University of Siena, Italy). The same membranes were probed for actin (Santa Cruz Biotechnology, Santa Cruz, CA). RyR pixel density levels were normalized to actin levels and are depicted as fold changes, where the untreated condition is considered 1-fold.
Immunofluorescence Analysis—Non-TgCRND8 neurons seeded at 8 ⫻ 105on
poly-D-lysine-coated glass coverslips were
treated with 1000 nMA-(1– 42) for 24 h on in vitro day 4 to
elevate RyR expression. Non-Tg and TgCRND8 cultures were
A Directly Increases Ryanodine Receptor Function
at CISTI - Natl Research Council on June 29, 2009
www.jbc.org
fixed with 4% paraformaldehyde (Fisher) in phosphate-buff-ered saline (Sigma) on in vitro day 5 at 37 °C, 5% CO2for 12 min and permeabilized with HEPES/Triton buffer containing 20 mMHEPES, 300 mMsucrose, 50 mMNaCl, 3 mMMgCl2, and
0.5% Triton X-100 (Fisher) for 10 min at room temperature. Cells were blocked with 5% goat serum (Sigma) in phosphate-buffered saline for 1 h at room temperature and incubated with 1/1000 dilution of RyR-1, -2, and -3 antibodies (17) in blocking buffer overnight at 4 °C. Neurons were incubated for 1 h at room temperature with secondary antibodies at 1/1000 dilu-tion (Molecular Probes), and nuclei were stained using Hoechst 33342 (Sigma). Neurons were imaged using an Axioskop 2 plus (Carl Zeiss Canada, Ltd.) with Axiovision Release 4.2 software. For detection of RyRs, all images were exposed for 260 ms under fluorescein isothiocyanate.
Small Interfering RNA (siRNA) Design and Delivery—siRNAs were generated using the Dicer siRNA generation kit (Genelan-tis, San Diego) and were based on the rabbit RyR-3 mRNA sequence (GenBankTMaccession number X68650). The region
of the RyR-3 mRNA chosen showed 88% alignment with mouse RyR-3, 9.6% with mouse RyR-2, and 0% with mouse RyR-1 after BLAST analysis. Primers used to amplify RyR-3 from plasmid for diced siRNA generation were specific to mouse and rabbit RyR-3 as determined by alignment analysis. Tg neurons seeded at 8 ⫻ 105per well in 6-well plates were transfected with 200 ng
of siRyR-3 or nonspecific control siRNA (Qiagen, Mississauga, Ontario, Canada) using 3 l of GeneSilencer威 siRNA transfec-tion reagent (Genelantis) per ml of conditransfec-tioned media for 24 h. Gene silencing was confirmed 72 h post-transfection by RT-PCR and Western blot analysis as described previously. Trans-fection efficiency was determined using 1 g of AlexaFluor 546威-labeled nonspecific siRNA (Qiagen) and calculated as the number of nuclei localized with siRNA ⫼ total number of nuclei ⫻ 100%.
Measurement of Free Intracellular Calcium—Free intra-cellular Ca2⫹(Ca2⫹
i) levels were quantified using fluorescence
ratio microscopy as described elsewhere (10), using the Ca2⫹
indicator dye Fura-2 (Molecular Probes). Fura-2 bound to Ca2⫹, an indication of free Ca2⫹levels, and was excited at 340
nm, and unbound Fura-2 was excited at 380 nm. Ca2⫹ ilevels
are depicted as a ratio of 340/380 nm emission at 510 nm. Briefly, 6 ⫻ 105cells were loaded for 30 min with 1 g/ml of
acetoxymethyl ester (AM) Fura-2 in Locke’s buffer. Cells were imaged on an inverted Zeiss microscope using a CoolSnapHQ (Roper Scientific Inc., Trenton, NJ) camera with a 40⫻ oil objective lens. Changes in Ca2⫹
ilevels were determined using
Stallion Imaging software (Downingtown, PA).L-(⫹)-glutamic
acid (EM Science, Gibbstown, NJ) was converted to 1Mstock of
glutamate by addition of 10NNaOH (Fisher) to pH 7.2.
Ryan-odine (Sigma) was prepared as a stock solution of 50 mM in
100% Me2SO (Sigma). Treatments were delivered to neurons
by perfusion. Experiments were performed in nominal extra-cellular Ca2⫹(Locke’s buffer without CaCl
2). Each experiment
was repeated at least three separate times, 15–30 cells imaged at each time. Of the cells imaged, data were pooled from cells that responded to both glutamate and ryanodine.
Statistical Analysis—Densitometric analysis was performed using NIH Scion Image software, version 1.60. Data were
ana-lyzed using GraphPad Prism, version 3.02 (San Diego, CA). One-way ANOVA with Student-Newman-Keuls post-test was performed to determine the difference between means after treatment. Two-way ANOVA with Bonferroni post-test was used to determine the difference between genotypes and treat-ments and the possible interactions of each. Differences were considered significant at p ⬍ 0.05.
RESULTS
A-induced RyR-3 mRNA Expression in Primary Cortical Neurons—To test the hypothesis that A directly increased RyR mRNA levels, C57Bl6 cortical neurons were treated with A-(1– 42) peptide (1000 nM) for 18 h and analyzed for RyR
mRNA levels (Fig. 1A). As determined by RT-PCR, C57Bl6 pri-mary cortical cells incubated with 1000 nM A-(1– 42)
increased RyR-3 mRNA levels 3.5 ⫾ 1.38-fold S.E. (n ⫽ 4, p ⬍ 0.001, one-way ANOVA, Student-Newman-Keuls post-test). Although not statistically significant, RyR-1 mRNA increased ⬃2.4 ⫾ 0.84-fold S.E. Treatment with A-(25–35), A-(35– 25),A-(1– 40), and A-(42-1) peptides did not alter RyR gene expression in primary cortical neurons from C57Bl6 (Fig. 1A). Furthermore, identical treatments did not alter RyR-2, IP3R-1,
or SERCA-2b mRNA levels (not shown). To rule out the involvement of rapid increases in Ca2⫹
iin the up-regulation of
RyR gene expression, we treated C57Bl6 primary cortical neu-rons with an ionophore, ionomycin, for 30 min. The treatment was removed and replaced with conditioned media for 18 h at 37 °C. Consistent with the observations made in a previous study (18), we did not see an induction of RyR gene expression after treatment with ionomycin (n ⫽ 2). Cell viability was unal-tered by a 30-min treatment with ionomycin as assessed 18 h after treatment by trypan blue exclusion assay (data not shown). RyR-3 Transcription and Protein Levels Are Increased in TgCRND8 Mice—Because A increased RyR gene expression in primary cortical neurons, we hypothesized that RyR-3 expression is elevated in TgCRND8 mice, a mouse model of Alzheimer disease that produces high levels of A and expresses early cognitive decline (16). Examination of cere-brum (forebrain) from the right hemisphere of 4 – 4.5-month-old TgCRND8 animals showed that RyR-3 mRNA levels were ⬃2.6 ⫾ 0.43-fold S.E. higher (n ⫽ 16, p ⬍ 0.01, two-way ANOVA, Bonferroni post-test) compared with their non-Tg littermates (Fig. 1B). There was no change in RyR-1 and RyR-2 (Fig. 1B) or in IP3R-1 and SERCA-2b mRNA levels (not shown). To determine where in TgCRND8 brain the increases in RyR were located, lysates of different brain regions dissected from 4-to 4.5-month-old CRND8 mice were analyzed for RyR protein by Western blot analysis using isoform-specific antibodies (17). Similar to mRNA levels, RyR-3 levels were increased ⬃2.7 ⫾ 0.42-fold S.E. (n ⫽ 14, p ⬍ 0.001, two-way ANOVA, Bonferroni post-test) in the cortex of Tg mice as compared with non-Tg, whereas RyR-1 and RyR-2 levels were unchanged (Fig. 1C). RyR-3 levels were increased 1.9 ⫾ 0.26-fold S.E. in the hip-pocampus as well (n ⫽ 14, p ⬍ 0.01, two-way ANOVA, Bonfer-roni post-test) but were unchanged in the basal and cerebellar regions (Fig. 1D). Our statistical tests reveal that these differ-ences in RyR-3 expression are attributed to the genotype (p ⬍ 0.0001) and specific to the brain region (p ⫽ 0.0011).
at CISTI - Natl Research Council on June 29, 2009
www.jbc.org
A Increased RyR-3 mRNA and Protein Levels in CRND8 Cortical Neurons—Based on our observations that A increased RyR gene transcription in naive cortical neurons (Fig. 1A) and that RyR levels are increased in TgCRND8 brain sam-ples (Fig. 1, B–D), we hypothesized that the cortical neurons of TgCRND8 mice had increased RyR gene expression. Primary neuronal cultures from TgCRND8 animals had an increase of ⬃3.6 ⫾ 0.71-fold S.E. (n ⫽ 3, p ⬍ 0.001, two-way ANOVA, Bonferroni post-test) in RyR-3 mRNA levels as determined by RT-PCR compared with non-Tg littermate controls on in vitro day 5 (Fig. 2A). A-(1– 42) treatment of non-TgCRND8 neu-rons increased gene expression of RyR-3 3.1 ⫾ 0.17-fold S.E. compared with untreated (n ⫽ 3, p ⬍ 0.001, two-way ANOVA, Bonferroni post-test) to levels comparable with those expressed in TgCRND8 neurons (Fig. 2A). Other treatments, including A-(1– 40) and A-(42-1), did not influence RyR-3 gene expression, nor did IP3R-1 and SERCA-2b mRNA levels differ between non-Tg and TgCRND8 neurons (not shown). As an
alternative approach to determine whether extracellular A was directly involved in elevating RyR gene expression, we treated TgCRND8 neurons with A-(1– 42) antibody (1.3 g/ml) for 18 h. Quenching of extracellular A-(1– 42) decreased neuronal RyR-3 mRNA levels in Tg neurons by 2.2 ⫾ 0.30-fold S.E. compared with untreated (n ⫽ 3, p ⬍ 0.001, two-way ANOVA, Bonferroni post-test) to levels similar to non-TgCRND8 littermates (Fig. 2B). Our statistical tests reveal that these differences in RyR-3 expression are attributed to the genotype (p ⬍ 0.0001) and spe-cific to the type of treatment (p ⫽ 0.0056). To determine relative RyR protein levels in CRND8 neurons, an immunofluorescence assay was performed with using isoform-spe-cific RyR antibodies. RyR-3 levels were markedly increased in TgCRND8 primary cortical neu-rons compared with their non-Tg littermate control cultures (Fig. 2C), whereas RyR-1 and RyR-2 levels did not change. Similarly, non-Tg neu-rons treated with A-(1– 42) (1000 nM) for 18 h had increased RyR-3,
but not RyR-1 or RyR-2, levels com-parable with Tg neurons (Fig. 2C).
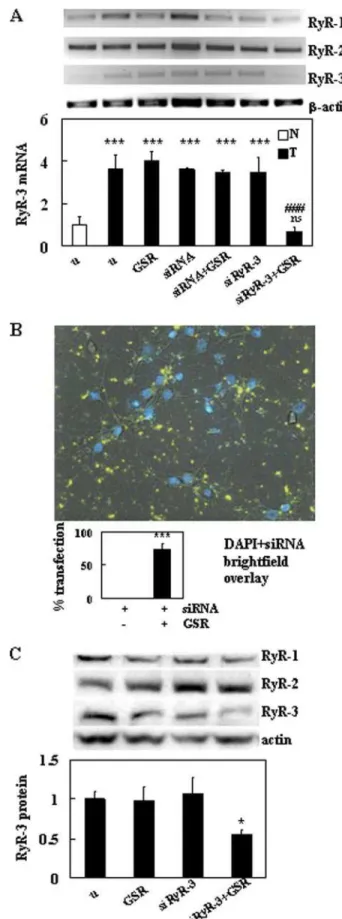
Targeting RyR-3 by Gene Silenc-ing Techniques—It was reported recently that RyR levels are increased in other models of AD, and as a result neurons from trans-genic mice have elevated responses to 20 –25 mM caffeine (12, 13).
Given our observations showing increased RyR-3 levels in TgCRND8 neurons, we wanted to determine whether RyR-3 was involved in the elevated response. Because of a lack of phar-macological tools to selectively block RyR-3, we opted for a molecular approach to target RyR-3 and depress its expression in Tg neurons prior to Ca2⫹imaging studies. Diced siRNAs
selective for RyR-3 were generated to span a 613-bp section of the mRNA and knock down RyR-3 levels. 200 ng of siRyR-3 was transfected into Tg neurons with GeneSilencer reagent (GSR) for 24 h. At 72 h post-transfection, RyR-3 levels were signifi-cantly decreased by 2.9 ⫾ 0.47-fold S.E. compared with untreated (n ⫽ 4, p ⬍ 0.001, two-way ANOVA, Bonferroni post-test) and were comparable with non-Tg neurons (Fig. 3A), whereas RyR-1 and RyR-2 levels did not change (fold changes not shown). Tg neurons treated with GSR, siRyR-3 alone, non-specific siRNA alone (200 ng), and siRNA with GSR did not show significant changes in RyR-1, -2 (not shown), or -3 (Fig. 3A) mRNA levels. To determine the transfection efficiency of
FIGURE 1. RyR mRNA and protein are increased in the cerebrum of TgCRND8 mice. A, representative agarose gel showing relative levels of RyR RT-PCR products from C57Bl6 cells. Neurons (in vitro culture day 8) were treated with 1000 nMof various A peptide fragments for 18 h. Relative RyR-1 and RyR-3 RT-PCR products were normalized to -actin levels. Neurons were treated with 20 Mglutamate (glut) as a stress response control. Values are the mean ⫾ S.E. of fold change determinations made in samples from four cultures; ***, p ⬍ 0.001 compared with values for untreated (u) cells (one-way ANOVA with Student-Neuman-Keuls post-test).
B, representative agarose gel showing levels of RyR-1, RyR-2, and RyR-3 RT-PCR products from 4- to
4.5-month-old CRND8 cerebrum. Non-Tg (N) are littermate controls, and TgCRND8 (T) are heterozygous for the APP695 double mutation. Values are the mean ⫾ S.E. of the fold changes of RyR RT-PCR products from 16 mice each of non-Tg and TgCRND8. **, p ⬍ 0.01 compared with littermate control values (two-way ANOVA with Bonferroni post-test). C, representative immunoblot of RyR proteins from cortex of 4 non-Tg and 4 TgCRND8 mice at 4 – 4.5 months of age probed with anti-RyR-1, -2, and -3. Skeletal and cardiac muscle microsomes were used as positive controls for RyR-1 and RyR-2, respectively. Values are the mean ⫾ S.E. of fold changes in RyR levels from four separate experiments (3– 4 brains of non-Tg and TgCRND8 were used for each experiment, n ⫽ 14). ***, p ⬍ 0.001 compared with littermate control values (two-way ANOVA with Bonferroni post-test). D, immu-noblot of RyR-3 proteins from hippocampus, basal region, and cerebellum of three non-Tg and three TgCRND8 mice at 4 – 4.5 months of age. Values are the mean ⫾ S.E. of fold changes in RyR levels from four separate experiments (3– 4 brains of non-Tg and TgCRND8 were used for each experiment, n ⫽ 14). **, p ⬍ 0.001 compared with littermate control values (two-way ANOVA with Bonferroni post-test).
A Directly Increases Ryanodine Receptor Function
at CISTI - Natl Research Council on June 29, 2009
www.jbc.org
our experiments, we transfected Tg neurons with AlexaFluor 546威-labeled nonspecific siRNA (1 g) under the same condi-tions as the siRyR-3 experiments. A transfection efficiency of 74.2 ⫾ 8.3 S.E. % (n ⫽ 4 (12 separate fields total), p ⬍ 0.001, one-way ANOVA, Student-Newman-Keuls post-test) was obtained at 72 h post-transfection. Knockdown of RyR-3 pro-tein levels in Tg neurons was confirmed by Western blot using isoform-specific antibodies (n ⫽ 3, Fig. 3C). At 72 h post-trans-fection, RyR-3 levels were reduced to 1.79-fold ⫾ S.E. (p ⬍ 0.05, one-way ANOVA, Student-Newman-Keuls post-test) that of untreated Tg neurons. This is a reduction of 44.4 ⫾ 4.5 S.E. %. RyR-1 and RyR-2 levels were unchanged after any treatment (fold changes not shown).
Calcium Released from ER Stores Is Increased in TgCRND8 Neurons Expressing Elevated Levels of RyR-3—To determine some of the functional consequences of increased levels of RyR-3 in TgCRND8 mice, we measured Ca2⫹
ilevels of neurons
after treatments of glutamate and ryanodine. Because of our interest in the contribution of ER Ca2⫹ stores to the overall
Ca2⫹
i response, experiments were
conducted in the presence of nomi-nal extracellular Ca2⫹to minimize
the contribution of Ca2⫹ influx.
Increased Ca2⫹
i because of
gluta-mate is closely associated with neu-rotoxicity (19 –23) and with alter-ations in AD neurophysiology (24); therefore, we sought to determine whether Tg neurons had altered Ca2⫹
iresponses because of increased
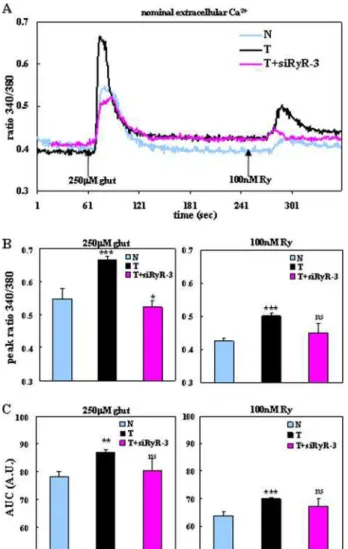
RyR-3. TgCRND8 neurons at in vitro day 5 demonstrated an ele-vated Ca2⫹
iresponse to 250 M
glu-tamate treatment as compared with non-Tg littermate controls (Fig. 4A), with a peak response of 0.67 ⫾ 0.01 S.E. Fura-2 fluorescence ratio 340/380 nM(n ⫽ 15, p ⬍ 0.001,
one-way ANOVA, Student-Newman-Keuls post-test) for Tg neurons was in contrast to 0.55 ⫾ 0.03 S.E. 340/ 380 nMfor non-Tg (n ⫽ 18) (Fig.
4B). To determine the contribution of RyR-3 to the observed increases in Ca2⫹
i levels, Tg neurons were
treated with siRyR-3 for 72 h prior to Ca2⫹ imaging experiments.
Knockdown of RyR-3 levels resulted in a decreased Ca2⫹response of Tg
neurons to glutamate (Fig. 4A), with a peak response of 0.52 ⫾ 0.02 S.E. ratio 340/380 nM(Fig. 4B) that was
significantly lower than non-Tg (0.55 ⫾ 0.06 S.E., n ⫽ 15, p ⬍ 0.05, one-way ANOVA, Student-New-man-Keuls post-test).
To determine the direct contri-bution of RyR-gated Ca2⫹stores to
Ca2⫹
ilevels, we performed experiments using an agonistic
con-centration (100 nM) of ryanodine (Ry) in the presence of
nom-inal extracellular Ca2⫹. After treatment of glutamate, ER stores
become charged with Ca2⫹and are then available for Ca2⫹
liberation (25). TgCRND8 neurons had increased Ca2⫹ ilevels
after 100 nMRy treatment (Fig. 4A), with a peak response of
0.50 ⫾ 0.01 S.E. ratio 340/380 nM(n ⫽ 15, p ⬍ 0.001, one-way
ANOVA, Student-Newman-Keuls post-test) as compared with littermate controls (Fig. 4C). siRyR-3 treatment of Tg neurons prior to the experiment reduced the Ca2⫹
iresponse to Ry (Fig.
4A) to peak levels that were not significantly different from littermate controls (Fig. 4C).
To determine the role of ER Ca2⫹load, we calculated the area
under the curve (AUC) of our Fura-2 traces (Fig. 4, D and E). AUC calculations, or the ratio of 340/380 nMmultiplied by time
and depicted in arbitrary units, represent the total amount of Ca2⫹being liberated from the ER after glutamate or Ry
treat-ment. In both instances, Tg neurons had higher levels of ER Ca2⫹released after agonist treatment (n ⫽ 15, p ⬍ 0.01, p ⬍
FIGURE 2. Levels of RyR-3 are increased in cortical neurons of TgCRND8 mice. A, representative agarose gel showing fold changes of RyR-3 RT-PCR products from embryonic day 16 CRND8 primary cortical neurons. Neurons cultured for 4 days were treated with 1000 nMA peptides as before (Fig. 1A). Cells were collected on
in vitro day 5. Non-Tg (N) are littermate controls, and Tg (T) neurons are heterozygous for the APP695 double
mutation. Values are the mean ⫾ S.E. of determinations made in samples from three cultures. Tg values were compared with littermate controls (non-Tg) at all treatments (ns indicates no statistical difference; ***, p ⬍ 0.001), and A-treated non-Tg values were compared with untreated (u) non-Tg (###, p ⬍ 0.001, two-way ANOVA with Bonferroni post-test). B, representative agarose gel showing fold changes of RyR-3 RT-PCR prod-ucts from 4-day-old cultures treated with 1.3 g/ml A-(1– 42) antibody or 1.3 g/ml gp-116 antibody (non-specific monoclonal antibody control) for 18 h at 37 °C before analysis (cells collected at in vitro day 5). Values are the mean ⫾ S.E. of determinations made in samples from three cultures. Tg values were compared with littermate controls (non-Tg) at all treatments (ns indicates no statistical difference; ***, p ⬍ 0.001) and anti-A-treated Tg values were compared with unanti-A-treated Tg (###, p ⬍ 0.001, two-way ANOVA with Bonferroni post-test). C, immunofluorescence assay for RyR-1, RyR-2, and RyR-3 protein in non-Tg and Tg primary cortical neurons is representative of three separate cultures. Non-Tg neurons are treated with 1000 nMA-(1– 42) peptide as before (Fig. 1A). Cells were imaged at 400⫻ magnification.
at CISTI - Natl Research Council on June 29, 2009
www.jbc.org
0.001, one-way ANOVA, Student-Newman-Keuls post-test) compared with littermate controls. After knockdown of RyR-3 levels by siRyR-3 treatment, Tg neurons had similar AUC val-ues to non-Tg littermates.
DISCUSSION
Several studies now clearly implicate a role for RyRs in the development and progression of Alzheimer disease (10 –13). Findings here have implicated RyR-3 as a key player in altering Ca2⫹homeostasis of neurons in response to A. We have come
to this conclusion based on the following evidence. First, our in vitro studies show that A-(1– 42), regardless of the source of peptide (endogenously produced or synthetic), increased levels of RyR-3. As a direct consequence, Tg neurons had exaggerated Ca2⫹
iresponses to ryanodine and to glutamate, which can
trig-ger CICR from RyR stores (4, 26 –29). Second, after knockdown of RyR-3 levels by siRNA, Ca2⫹ imaging experiments
con-firmed that the RyR-3 pools represented the majority of the glutamate-induced increase in Ca2⫹ in Tg neurons. Finally,
RyR-3 levels were increased in vivo in the cortex and hippocam-pus, areas of the brain affected in AD, and suggest an important role for RyR-3 in disease progression.
It is well documented that alterations in Ca2⫹homeostasis
occur early in AD, before profound neuronal damage and cell death (4, 30). These changes in Ca2⫹
ilevels appear to correlate
more closely with cognitive decline compared with the formation of A-containing senile plaques, the pathological hallmark of AD (31). It is interesting to note that TgCRND8 mice begin to display cognitive defects in spatial learning tasks at 19 –22 weeks of age, where their ability to acquire new information is impaired (32). Of relevance to our study, we observed an increase in RyR-3 levels and Ca2⫹disruption within this time frame.
The impact of dysregulated Ca2⫹homeostasis as a result of
increased RyR-3 in the in AD is still unclear. In fact, the exact function of RyR-3 in brain has yet to be determined, although their relative abundance in neurons of the hippocampus sug-gests a role for RyR-3 in hippocampal Ca2⫹regulation (14). The
generation of RyR-3 knock-out mice has given some insight into its function. Two independent groups have generated RyR-3 knock-out mice, and each group performed electro-physiological and behavioral studies to determine the role of RyR-3 in synaptic plasticity and hippocampus-dependent learning (33, 34). Both groups demonstrated evidence of increased long term potentiation (LTP), a physiological
corre-FIGURE 3. Levels of RyR-3 mRNA and protein are decreased in TgCRND8
neurons after treatment with siRNA. A, representative agarose gel showing
fold changes of RyR-1, RyR-2, and RyR-3 RT-PCR products from non-Tg (N) and TgCRND8 (T) 8.0 ⫻ 105primary cortical neurons treated with siRNA. RT-PCR
analysis was conducted 72 h post-transfection. The treatments include untreated (u), 3 l of GSR, 200 ng of control siRNA, or 200 ng of siRyR-3. The
graph is representative of the relative expression of RyR-3. Values are the
mean ⫾ S.E. of the fold change of RyR-3 RT-PCR levels from four cultures each of non-Tg and Tg. Tg values were compared with untreated (u) littermate (non-Tg) at all treatments (ns indicates no statistical difference; ***, p ⬍ 0.001), and T⫹siRyR-3⫹GSR was compared with untreated Tg (###, p ⬍ 0.001, two-way ANOVA with Bonferroni post-test). B, image of Tg neurons transfected with 1 g of AlexaFluor 546姞-labeled nonspecific siRNA at 72 h post-transfec-tion. Nuclei were labeled with Hoechst 33342 and imaged under 4⬘,6-dia-midino-2-phenylindole (DAPI). The graph is representative of transfection efficiency of GSR and is pooled from three separate experiments. siRNA⫹GSR was ***, p ⬍ 0.001 (one-way ANOVA with Student-Newman-Keuls post-test) compared with siRNA treatment alone. C, representative immunoblot for RyR-1, RyR-2, and RyR-3 in Tg neurons treated with siRyR3 as in A and is rep-resentative of three separate cultures. The graph is reprep-resentative of RyR-3 protein levels relative to actin, and values are the mean ⫾ S.E. of the fold change of RyR-3. *, p ⬍ 0.05 (one-way ANOVA with Student-Newman-Keuls post-test) compared with untreated.
A Directly Increases Ryanodine Receptor Function
at CISTI - Natl Research Council on June 29, 2009
www.jbc.org
late for learning and memory, after particular types of stimula-tion, namely short or weak tetanus, suggesting a role for RyR-3 in the depression of LTP and long term depression (LTD). However, after subjecting the RyR-3-deficient mice to the Mor-ris water maze to assess spatial learning competencies, the two groups came to contradictory conclusions. Although Futatsugi et al. (34) showed that mutant mice had enhanced spatial learn-ing, which would be expected if RyR-3 mediated the depression of LTP, Balschun et al. (33) observed that RyR-3 knock outs had significant deficiencies in their ability to acquire new informa-tion compared with mice with wild-type RyR. Interestingly, it has been shown that RyR-mediated Ca2⫹release from
post-synaptic CA1 (35, 36) or pre-post-synaptic CA3 (35, 37) neurons is required for the induction of LTD. Of the three different RyR
isoforms, RyR-3 would be the likely candidate for the fine-tun-ing of these synaptic changes. RyR-3 is less sensitive to Ca2⫹in
comparison to RyR-1 and RyR-2 and therefore requires higher cytosolic Ca2⫹ levels to be activated and deactivated (38).
Taken together, these observations suggest that RyR-3 may contribute to synaptic plasticity by modulating the balance between LTP and LTD, and the up-regulation of RyR-3 could be a response to an increase in neuronal excitability.
Such a mechanism could be at play in AD, and the up-regu-lation of RyR-3 might be an effort mounted by neurons to pro-tect against the increased excitability brought about by the pathology of AD, specifically A accumulation. Other aspects of Ca2⫹
isignaling in AD neurons are also enhanced, in
partic-ular N-methyl-D-aspartic acid receptor (39) and IP3R-mediated
signaling (40), leading to increased excitotoxicity. In fact, Stutz-mann et al. (12) showed that RyR Ca2⫹stores were directly
responsible for the exaggerated hyperpolarization responses of PS1 mutant neurons to IP3and therefore impacted membrane excitability. Furthermore, RyR-3 mRNA was transiently increased in rat brain after kainic acid-induced status elipticus (41), implicating a role in modulating excitability. Higher levels of RyRs could be considered advantageous in protecting against putative excitotoxicity in AD, but the implications of chronic up-regulation of RyR-3, which could occur as long as A is being produced, might lead to the opposite effect. As the bal-ance of excitation and depression are skewed, the resulting effect could be an increase to overall Ca2⫹
i levels, oxidative
stress, and activation of pathways leading to toxicity and neu-rodegeneration (10, 11, 41). Further studies are required to resolve why RyR-3 is being up-regulated so significantly and specifically in TgCRND8 mice.
The results of our study describe a mechanism by which A contributes to the dysregulation of intraneuronal Ca2⫹
home-ostasis by up-regulating the expression and function of a spe-cific ER Ca2⫹release channel, RyR-3. There is much evidence
to suggest that RyR Ca2⫹pools play an important role in the
neuronal dysfunction initiated by A deposition in AD (10 – 13). Our findings further focus on RyRs and implicate RyR-3 as the primary ER channel that facilitates Ca2⫹disruption in AD.
This information could be significant in understanding the neurobiology of AD pathology. RyR(s) may play a role in normal aging as well as contribute to AD pathology. In a report by Lu et al. (42), RyR-1 mRNA was increased significantly in aged human cortical tissue from individuals that were not demented, which suggests that increased RyRs may have a protective or positive role to play in neuronal function. Furthermore, it has been shown recently that RyR-3 mRNA and protein levels are increased in the superior cervical ganglia of aged rats and may serve to protect neurons from oxidative stress by modulating and increasing the protein expression of neuronal nitric-oxide synthase (43). A clearer picture of how RyRs are involved in balancing normal and pathological aging is required before they can be considered a feasible therapeutic target.
Acknowledgments—We thank Dr. D. Westaway, University of Toronto, for the TgCRND8 mice and Dr. V. Sorrentino, University of Siena for the RyR antibodies.
FIGURE 4. Calcium release from ER stores was significantly enhanced in
TgCRND8 primary cortical neurons via RyR-3 compared with littermate controls. A, representative recording of the average changes in Fura-2 340/
380 nm ratios of non-Tg (N), Tg (T), and T⫹siRyR-3 neurons in the presence of nominal extracellular calcium. The arrows represent the application of gluta-mate (glut) or ryanodine (Ry). The traces are representative of at least three separate experiments, n ⫽ 15 (N), n ⫽ 18 (T), and n ⫽ 12 (T⫹siRyR-3). B, graphs show the average peak response and S.E. of determinations made from at least three experiments. ns indicates no statistical significance; *, p ⬍ 0.05; ***, p ⬍ 0.001 compared with non-Tg (one-way ANOVA with Student-Neu-man-Keuls post-test). C, graphs showing the AUC of the corresponding traces in A. ns indicates no statistical significance; **, p ⬍ 0.01; ***, p ⬍ 0.001 com-pared with non-Tg (one-way ANOVA with Student-Neuman-Kuels post-test). Basal ratios of neurons under the various conditions were not statistically different from each other.
at CISTI - Natl Research Council on June 29, 2009
www.jbc.org
REFERENCES
1. Kelliher, M., Fastbom, J., Cowburn, R. F., Bonkale, W., Ohm, T. G., Ravid, R., Sorrentino, V., and O’Neill, C. (1999) Neuroscience 92, 499 –513 2. Hardy, J., and Selkoe, D. J. (2002) Science 297, 353–356
3. Selkoe, D. J. (2001) Proc. Natl. Acad. Sci. U. S. A. 98, 11039 –11041 4. LaFerla, F. M. (2002) Nat. Rev. Neurosci. 3, 862– 872
5. Ghosh, A., and Greenberg, M. E. (1995) Science 268, 239 –247
6. O’Neill, C., Cowburn, R. F., Bonkale, W. L., Ohm, T. G., Fastbom, J., Carmody, M., and Kelliher, M. (2001) Biochem. Soc. Symp. 67, 177–194 7. Verkhratsky, A. (2002) Cell Calcium 32, 393– 404
8. Sorrentino, V., and Rizzuto, R. (2001) Trends Pharmacol. Sci. 22, 459 – 464 9. Mattson, M. P., LaFerla, F. M., Chan, S. L., Leissring, M. A., Shepel, P. N.,
and Geiger, J. D. (2000) Trends Neurosci. 23, 222–229
10. Chan, S. L., Mayne, M., Holden, C. P., Geiger, J. D., and Mattson, M. P. (2000) J. Biol. Chem. 275, 18195–18200
11. Lee, S. Y., Hwang, D. Y., Kim, Y. K., Lee, J. W., Shin, I. C., Oh, K. W., Lee, M. K., Lim, J. S., Yoon do, Y., Hwang, S. J., and Hong, J. T. (2006) FASEB J.
20,151–153
12. Stutzmann, G. E., Smith, I., Caccamo, A., Oddo, S., Laferla, F. M., and Parker, I. (2006) J. Neurosci. 26, 5180 –5189
13. Smith, I. F., Hitt, B., Green, K. N., Oddo, S., and LaFerla, F. M. (2005) J. Neurochem. 94,1711–1718
14. Giannini, G., Conti, A., Mammarella, S., Scrobogna, M., and Sorrentino, V. (1995) J. Cell Biol. 128, 893–904
15. Ogawa, Y. (1994) Crit. Rev. Biochem. Mol. Biol. 29, 229 –274
16. Chishti, M. A., Yang, D. S., Janus, C., Phinney, A. L., Horne, P., Pearson, J., Strome, R., Zuker, N., Loukides, J., French, J., Turner, S., Lozza, G., Grilli, M., Kunicki, S., Morissette, C., Paquette, J., Gervais, F., Bergeron, C., Fraser, P. E., Carlson, G. A., George-Hyslop, P. S., and Westaway, D. (2001) J. Biol. Chem. 276,21562–21570
17. Rossi, D., Simeoni, I., Micheli, M., Bootman, M., Lipp, P., Allen, P. D., and Sorrentino, V. (2002) J. Cell Sci. 115, 2497–2504
18. Genazzani, A. A., Carafoli, E., and Guerini, D. (1999) Proc. Natl. Acad. Sci. U. S. A. 96,5797–5801
19. Jarvis, C. R., Lilge, L., Vipond, G. J., and Andrew, R. D. (1999) Neuroimage
10,357–372
20. Mattson, M. P., Gary, D. S., Chan, S. L., and Duan, W. (2001) Biochem. Soc. Symp. 67,151–162
21. Glazner, G. W., Chan, S. L., Lu, C., and Mattson, M. P. (2000) J. Neurosci.
20,3641–3649
22. Kim, H. S., Park, C. H., Cha, S. H., Lee, J. H., Lee, S., Kim, Y., Rah, J. C., Jeong, S. J., and Suh, Y. H. (2000) FASEB J. 14, 1508 –1517
23. Guo, Q., Fu, W., Sopher, B. L., Miller, M. W., Ware, C. B., Martin, G. M., and Mattson, M. P. (1999) Nat. Med. 5, 101–106
24. Ye, C., Walsh, D. M., Selkoe, D. J., and Hartley, D. M. (2004) Neurosci. Lett.
366,320 –325
25. Shmigol, A., Kirischuk, S., Kostyuk, P., and Verkhratsky, A. (1994) Pfluegers Arch. 426,174 –176
26. Emptage, N., Bliss, T. V., and Fine, A. (1999) Neuron 22, 115–124 27. Linn, C. L., and Gafka, A. C. (2001) J. Physiol. (Lond.) 535, 47– 63 28. Clodfelter, G. V., Porter, N. M., Landfield, P. W., and Thibault, O. (2002)
Eur. J. Pharmacol. 447,189 –200
29. Arundine, M., and Tymianski, M. (2003) Cell Calcium 34, 325–337 30. Berridge, M. J. (2001) Novartis Found. Symp. 239, 52–57, 150 –159 31. Chui, D. H., Tanahashi, H., Ozawa, K., Ikeda, S., Checler, F., Ueda, O.,
Suzuki, H., Araki, W., Inoue, H., Shirotani, K., Takahashi, K., Gallyas, F., and Tabira, T. (1999) Nat. Med. 5, 560 –564
32. Hyde, L. A., Kazdoba, T. M., Grilli, M., Lozza, G., Brusa, R., Zhang, Q., Wong, G. T., McCool, M. F., Zhang, L., Parker, E. M., and Higgins, G. A. (2005) Behav. Brain Res. 160, 344 –355
33. Balschun, D., Wolfer, D. P., Bertocchini, F., Barone, V., Conti, A., Zusch-ratter, W., Missiaen, L., Lipp, H. P., Frey, J. U., and Sorrentino, V. (1999) EMBO J. 18,5264 –5273
34. Futatsugi, A., Kato, K., Ogura, H., Li, S. T., Nagata, E., Kuwajima, G., Tanaka, K., Itohara, S., and Mikoshiba, K. (1999) Neuron 24, 701–713 35. Reyes, M., and Stanton, P. K. (1996) J. Neurosci. 16, 5951–5960 36. Nishiyama, M., Hong, K., Mikoshiba, K., Poo, M. M., and Kato, K. (2000)
Nature 408,584 –588
37. Unni, V. K., Zakharenko, S. S., Zablow, L., DeCostanzo, A. J., and Siegelbaum, S. A. (2004) J. Neurosci. 24, 9612–9622
38. Bouchard, R., Pattarini, R., and Geiger, J. D. (2003) Prog. Neurobiol. 69, 391– 418
39. Rogawski, M. A., and Wenk, G. L. (2003) CNS Drug Rev. 9, 275–308 40. Stutzmann, G. E. (2005) Neuroscientist 11, 110 –115
41. Mori, F., Okada, M., Tomiyama, M., Kaneko, S., and Wakabayashi, K. (2005) Epilepsy Res. 65, 59 –70
42. Lu, T., Pan, Y., Kao, S. Y., Li, C., Kohane, I., Chan, J., and Yankner, B. A. (2004) Nature 429, 883– 891
43. Vanterpool, C. K., Vanterpool, E. A., Pearce, W. J., and Buchholz, J. N. (2006) J. Appl. Physiol. 101, 392– 400
A Directly Increases Ryanodine Receptor Function
at CISTI - Natl Research Council on June 29, 2009
www.jbc.org