Publisher’s version / Version de l'éditeur:
Materials science and engineering, 527, 27-28, pp. 7413-7423, 2010-10-01
READ THESE TERMS AND CONDITIONS CAREFULLY BEFORE USING THIS WEBSITE. https://nrc-publications.canada.ca/eng/copyright
Vous avez des questions? Nous pouvons vous aider. Pour communiquer directement avec un auteur, consultez la première page de la revue dans laquelle son article a été publié afin de trouver ses coordonnées. Si vous n’arrivez pas à les repérer, communiquez avec nous à PublicationsArchive-ArchivesPublications@nrc-cnrc.gc.ca.
Questions? Contact the NRC Publications Archive team at
PublicationsArchive-ArchivesPublications@nrc-cnrc.gc.ca. If you wish to email the authors directly, please see the first page of the publication for their contact information.
NRC Publications Archive
Archives des publications du CNRC
This publication could be one of several versions: author’s original, accepted manuscript or the publisher’s version. / La version de cette publication peut être l’une des suivantes : la version prépublication de l’auteur, la version acceptée du manuscrit ou la version de l’éditeur.
For the publisher’s version, please access the DOI link below./ Pour consulter la version de l’éditeur, utilisez le lien DOI ci-dessous.
https://doi.org/10.1016/j.msea.2010.08.025
Access and use of this website and the material on it are subject to the Terms and Conditions set forth at
Hot tearing of aluminum-copper B206 alloys with iron and silicon
additions
Kamguo Kamga, H.; Larouche, D.; Bournane, M.; Rahem, A.
https://publications-cnrc.canada.ca/fra/droits
L’accès à ce site Web et l’utilisation de son contenu sont assujettis aux conditions présentées dans le site LISEZ CES CONDITIONS ATTENTIVEMENT AVANT D’UTILISER CE SITE WEB.
NRC Publications Record / Notice d'Archives des publications de CNRC:
https://nrc-publications.canada.ca/eng/view/object/?id=36391983-9674-42f6-b164-bb3ec8faccf6 https://publications-cnrc.canada.ca/fra/voir/objet/?id=36391983-9674-42f6-b164-bb3ec8faccf6Hot tearing of Aluminum-Copper B206 Alloys with
Iron and Silicon Additions
H. Kamguo Kamga
1, D. Larouche
2, M. Bournane
1, A. Rahem
31- University Research Center on Aluminum (CURAL), University of Quebec at Chicoutimi, Saguenay, Québec, Canada, G7H 2B1
2- Laval University, Dept of Mining, Metallurgy and Materials Engineering, Aluminum Research Center – REGAL, 1065, Ave de la Medecine, Quebec, Canada, G1V 0A6
3- National Research Council of Canada, Aluminum Technology Center (ATC), Saguenay, Quebec, Canada, G7H 8C3
Corresponding author. E-mail address: daniel.larouche@gmn.ulaval.ca
Abstract
Hot tearing of B206 aluminum alloys with additions of iron and silicon was studied with constrained mould casting (CRC) to investigate the combined effect of these additions on hot tear resistance. Susceptibility to hot tearing was found to increase gradually with iron content when the conditions were favourable to the formation of the (FeCu) phase. Additions of silicon with a Fe/Si mass ratio ≤ 1 and rapid cooling rates, which together promote the (MnFe) phase at the expense of the (FeCu) phase, were found beneficial to the hot tearing resistance. Hot Tearing Sensitivity (HTS) of the alloys were evaluated with a new index defined to reflect the compliance of the cracked specimens. This index showed an excellent qualitative agreement with the Katgerman’s hot tearing index (HCS), providing that one defines the temperature where inadequate feeding starts to be the temperature where 2% of the interdendritic volume is occupied by intermetallic phases. Examinations of the tear surfaces and crack profiles revealed that a premature crack opening created by insufficient healing correlates well the explanations based on the theoretical hot tearing index. The deleterious effect of iron on hot tearing was demonstrated on alloys having a coarse grain microstructure having Ti contents below or equal to 0.01wt%. Above this limit, fine grain microstructures were obtained and the influence of iron was not strong enough to have a significant impact on the castings produced.
Keywords: B206; Hot tearing; Intermetallics; Grain refining; Solidification
1. Introduction
Hot tearing is an inherent defect in 206 type aluminium alloys which is generally attributed to their long freezing range0. This defect essentially involves the formation of a macroscopic tear as a result of strain localization in the solidifying metal above the non-equilibrium solidus temperature of the alloy. Hot tearing requires both a susceptible microstructure and mechanical constraint, the later being most of the time imposed by the mold. Under these circumstances, the total strain is fixed to zero and the irreversible strain increases to compensate the solidification shrinkage and the thermal contraction strain. The mechanisms allowing the irreversible strain to increase depends of the fraction liquid involved. Above the dendrite coherency temperature, the distance between the grains can increase in the directions of tensile stresses, providing that the state of stress allows the conjugated flow of the liquid phase. Below the dendrite coherency temperature, grain boundary sliding will be activated and the stress will rise according to the level of lubrication of the grains 2. As long as the liquid films lubricating the grains are connected, the inflow of metal from regions where the hydrostatic pressure is high to regions where the hydrostatic pressure is low will prevent the formation of a cavity 3. When the flow of liquid becomes difficult, the system enters into the vulnerable time period for hot tearing [4, 5]. For a given cooling rate, the temperature range covered in this period is critical for hot tearing since the longer will be that range and the larger will be the irreversible strain necessary to accommodate the solidification shrinkage. Clyne and Davies[5] were the first to propose a hot tearing index based on the concept of the vulnerable time period versus the time
allowed for accommodation. Their index called the Cracking Susceptibility Coefficient (CSC) was defined as: v r t CSC t (1)
Where tv represents the vulnerable time period and tr represents the time period available for stress relief
processes. These two time periods are contiguous at the critical point (tcr) where, according to Katgerman [6]
, the system transits from a regime where liquid feeding is adequate to a regime where liquid feeding is inadequate. Katgerman also makes the point clear that the time period for stress relief starts when dendrite coherency is attained, since the latter is by definition the point where the stress sustained by the solid phase becomes different from those in the liquid phase [7]. Therefore, the total time period circumscribed between the time where the system reaches dendrite coherency (tcoh) and the time where the system becomes rigid
(t0.99) is divided in two contiguous segments: tv = t0.99 – tcr and tr = tcr− tcoh so that equation (1) can be
written as: 0.99 cr cr coh t t CSC t t (2)
This definition of the cracking susceptibility coefficient is often referred in the literature as the Katgerman’s hot tearing index. Indices of this kind are recognized to give a correct picture of the compositional dependence of hot tearing susceptibility [8]. They cannot be used however to predict the occurrence of hot tearing when casting conditions are changing, unless the times appearing in equation 2 are associated to the temperature distribution in the metal, as Katgerman did in the case of the direct chill casting [6]. In fact, prediction of hot tearing is only possible if the mechanical aspects of solidification are also taken into account [9]. Several criteria were proposed to predict hot tearing. Most of them have been evaluated in reference [10] by using a mathematical modeling of the direct chill casting process. In their paper, the authors concluded that the RDG criterion [3], which calculates the pressure drop associated to the deformation of the microstructure imposed by the solidification shrinkage, shown the greatest potential for hot tearing prediction. The other criteria examined failed to predict hot tearing in particular situations where normally hot tearing is encountered. The RDG criterion is based on the mass conservation equation and the most recent two-phase hot tearing models include such a feeding based criterion [7, 11-14]. Although these models include many features helping to capture the essential of the hot tearing phenomena, their major limitation is that they are two-phase models. Commercial alloys always have a certain amount of iron, which combines with the other elements to generate intermetallic phases at elevated temperature. So in general, there is not only two phases in the pre-eutectic portion of the solidification path but three and often more depending of the composition. Contrary to the dendrite arms, which coarsen by a uniform migration of the solid-liquid interface, secondary phases nucleate in the interdendritic space at punctual locations and grow across the liquid film. Their formation inevitably impedes the flow of liquid by a plugging effect and may induce premature cracking. Very few reports in the cited literature have explored the effect of pre-eutectic intermetallics in aluminium alloys. In their revue, Eskin et al. [15] wrote that impurities in amounts of tenths of a percent can considerably affect the ductility and the brittle range of alloys. They cited Novikov [16] who mentioned, as translated by Eskin et al., “that impurities or small additions that change the morphology and distribution of intermetallic particles can affect the ductility and the span of the brittle range accordingly”. Oya et al. [17] found that additions of Sn, Zn, Fe and Ni in Al-4.5%Cu and Al-4.5%Cu-5%Si alloys had for effect to reduce the hot tearing resistance of the alloy. They pointed out the importance of interdendritic fluid flow in the initiation of hot tears. Chadwick [18] arrived at the opposite conclusion regarding the influence of iron in Al-4.5%Cu. He explained his results by the action of the iron intermetallics filling the gap between the dendrites and forming a framework, “which isolates the eutectic into pockets increasing the ability of the test pieces to resist constraint stresses imposed by the die”. Chadwick also reported that the iron intermetallics had a deleterious effect on the tensile strength of the alloy. Novikov and Grushko [19] observed a gradual increase of the hot tearing susceptibility of two Al-Cu-Li alloys with manganese additions. They did not however report the causes of this deleterious effect. They only mention that there was a decrease in the elongation to failure with manganese additions in the solid-liquid condition. In a more recent contribution, Nagaumi et al. [20] found that iron additions increase the
crack sensitivity of a 6XXX type alloy due to the formation of the (MnFe) intermetallics, which crystallizes into grain boundary and make the latter to become fragile. They did not clearly stated whether the crack starts from the decohesion of the (MnFe)–dendrite interface or from the formation of a cavity in the liquid phase near the intermetallic particle. It is indeed a possibility that hot tearing may be initiated in the solid phases as pointed out recently by Lesoult [21] and before by Guven and Hunt [22]. The latter specified however that hot tear can start in the solid just below the eutectic temperature if the volume fraction of liquid is below 2%.
The presence of β(FeCu) phases in aluminum-copper alloys is well known to have deleterious effect on the tensile strength [23]. In a recent study on solidification of 206 type alloys [24],the authors showed that the precipitation of the β(FeCu) phase could be partially or completely suppressed depending of the iron to silicon ratio as well as the cooling rate. Under favorable conditions, precipitation of α(MnFe) phase can bypass the precipitation of the β(FeCu) phase, capturing then almost all the iron available. The porous structure of the α(MnFe) phase is likely to ease the flow of liquid metal, while its cubic structure may show more coherency with the aluminum matrix.
Having the same motivation as expressed by others [25], that it could be acceptable for automotive applications to use naturally aged 206 type alloy castings with higher iron contents, it was decided to investigate the effects of iron and silicon additions on the hot tearing susceptibility of the B206 alloy. The objective of this study was to determine the possibility that higher iron contents could be used while preserving most of good properties of the B206 aluminium alloy.
2. Experimental procedure
2.1 Materials
The base alloy is a B206 ingot produced by Rio Tinto Alcan and its chemical composition is shown in Table 1. Compositions were modified using aluminum1020 and commercial master alloys (50%Si, Al-25%Fe, Al-25%Mn, Al-50%Mg, and Al-50%Cu). Chemical analyses were carried out with an optical emission spectrometer and the compositions are presented in Table 2.
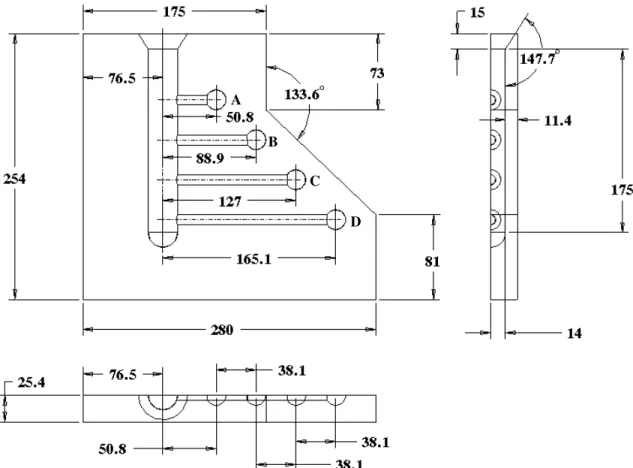
A Constrained Rod Casting (CRC) mould was used in this study. The design of this mould made of cast iron is presented in Figure 1. The mould cavity was designed to cast four 12.7mm diameter cylindrical constrained rods with nominal lengths of 50.8mm (bar A), 88.9mm (bar B), 127mm (bar C), and 165.1mm (bar D). The bars are constrained at one end by the sprue and at the other end by a spherical cavity of 19.05mm diameter. The cylindrical rods are separated from each other by a distance of 38.1mm center to center. The melt is fed to the rods through a 177.8 mm long sprue. To reduce experimental uncertainties, the mould cavity was cleaned, heated up to 200°C and coated with graphite prior each series of tests.
Table 1: B206 Alloy Composition
Cu Si Fe Mn Mg Ti Zn Ni Al Fe/Si
4.60 0.10* 0.06 0.40 0.25 < 0.01 0.00 < 0.01 balance 0.60 * Si was out of specification
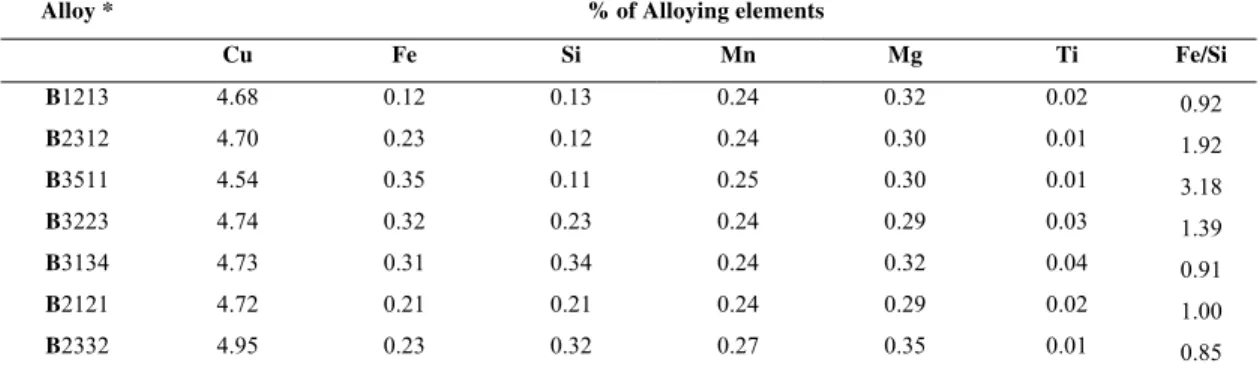
Table 2: Alloys designation and composition (wt%)
Alloy * % of Alloying elements
Cu Fe Si Mn Mg Ti Fe/Si B1213 4.68 0.12 0.13 0.24 0.32 0.02 0.92 B2312 4.70 0.23 0.12 0.24 0.30 0.01 1.92 B3511 4.54 0.35 0.11 0.25 0.30 0.01 3.18 B3223 4.74 0.32 0.23 0.24 0.29 0.03 1.39 B3134 4.73 0.31 0.34 0.24 0.32 0.04 0.91 B2121 4.72 0.21 0.21 0.24 0.29 0.02 1.00 B2332 4.95 0.23 0.32 0.27 0.35 0.01 0.85
*Bxxxx ; The first two digits represent the wt% of Fe and the last two digits represent the wt% of Si
2.2 Melt treatment and casting
The as-received B206 ingots were cut into smaller pieces, cleaned, dried and melted in charges of 52 kg each to prepare the required alloys. The melting process was carried out in a SiC crucible of 55 kg capacity, using an electrical resistance furnace. The inner surfaceof the crucible was coated with a layer of refractory coating to avoid melt crass-contamination. The melting temperature was maintained at 750 ± 5°C. The alloys were grain-refined by adding Al-5%Ti-l%B in rod form. Degassing was performed by injecting dry argon into the melt during 20 minutes by means of a graphite degassing impeller, rotating at 150 rpm, to ensure homogeneous mixing of the additives. After degassing, the melt was kept under argon protective atmosphere to avoid oxidation. Actual casting took place by pouring the degassed melt in the CRC mould preheated at 450ºC. During the experiments, mould temperature was monitored with a thermocouple, which was embedded into the body of the mould. The castings were removed from the mould after complete solidification of the sprue. For each alloy, a sampling for chemical analysis was carried out during the first and the last pouring to obtain the corresponding alloy melt mean composition. Four castings were produced per alloy. The first casting was used to stabilize the mould, and the three others, which presented the same casting characteristics, were considered for hot tearing indexation.
2.3 Hot tears indexation
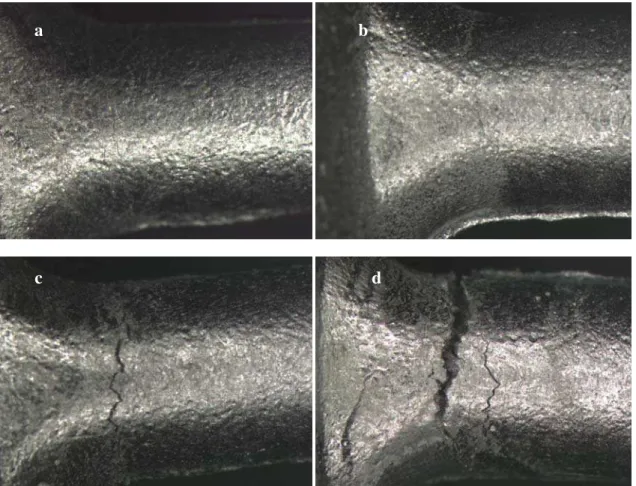
Cracks were inspected with naked eyes and under microscope. They were classified according to the degree of severity into four categories as surface crack, light crack, severe crack, and complete crack. Hot tear severities are described below and corresponding pictures are presented in Figure 2.
a- Surface Crack: a hairline crack located on the surface and that extends over a maximum of half the
circumference of the bar.
A
B
C
D
b- Light Crack: a hairline crack that extends over the entire circumference of the bar. c- Severe Crack: a crack that extends over the entire circumference of the bar and in depth. d- Complete Crack: a complete or almost complete separation of the bar.
Figure 2: Pictures of typical hot tearing with different levels of severity: (a) Surface crack, (b) Light crack, (c) Severe crack and (d) Complete crack
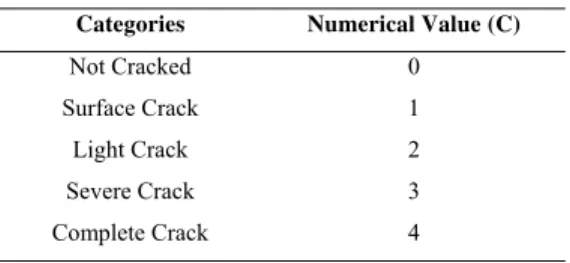
Hot tear sensitivity of alloys was quantified using a new index called Hot Tearing Sensitivity (HTS). This index is proposed to reflect the compliance of the bar after cracking, since the compliance gives an estimation of the total crack surfaces created by tensile stress along the gage length of the specimen. One can assume that the compliance of the cracked specimen is proportional to the level of crack opening obtained at the end of solidification divided by the length of the bar. The sum of all cracks opening is almost equal to the irreversible elongation of the bar. If L is the length of the constrained bar, then the ratio /L represents the irreversible strain of the bar. Consequently, the evolution of tensile stress versus /L should be independent of the length of the bar. In principle, it would be possible to characterize the HTS of one bar by measuring precisely /L and the force applied during solidification. Since on-line measurements of were not possible in the present set-up, and that accurate measurement of crack opening is difficult on the solidified bars, we choose to evaluate qualitatively the damage produced during constrained shrinkage by assigning a numerical value (C) to the level of crack opening or . Table 3 presents the values associated to each category of cracks. Notice that this classification of cracks and their rating was first proposed by Couture and Edwards in their study of hot tearing of copper base alloys [26]. In this work, it was decided to evaluate C/L and to evaluate the HTS parameter according to this equation:
a
d
c
4 D i i i A D i i A C L HTS L
(3)Where Ci is the assigned numerical value for the crack severity in bar i =A, B, C or D. The denominator
normalises the HTS in such a way that if all bars are completely cracked after casting, then the alloy is given a HTS = 1. If no cracks are formed, then HTS = 0. The lengths of bars A to D are those indicated in Figure 1 and were defined as the distance between the center of the sprue and the center of the spherical cavity. Notice that Couture and Edwards rated the hot tearing susceptibility by summing the C values given to each bar of the casting. They did not divide each C value by the length of the bar as this was made in this work. We think that our approach is better since irreversible strain is independent of the length of the bar so, if the bar is longer, the level of crack opening imposed by the constrained shrinkage increases proportionally.
Table 3: Cracks categories and hot tearing numerical values (C)
Categories Numerical Value (C)
Not Cracked 0 Surface Crack 1 Light Crack 2 Severe Crack 3 Complete Crack 4
2.4 Samples preparation and characterization
In order to study the constituents and structure of the alloys for hot tearing characterization, the specimens were taken as close as possible of the hot tear location of bars D. Samples for tear surface analysis were segments of completely broken bars containing hot tears that were removed usually near the junctions of the bars and the sprue. For incompletely broken bars, breaking was completed to expose the tear surface before removal of the segment. During the whole process, the hot tear surfaces were protected from any damage and contamination. Crack surface examinations were conducted using a SEM (Hitachi FEG-SEM SU-70) equipped with EDS and WDS facilities. The acceleration voltage was 20 kV, the filament current 48µA, and the working distance around 15 mm. After SEM examination, the broken pieces were carefully brought back together at the tear interface, mounted in Bakelite resin and polished following usual procedures. The polished samples were then examined to identify and to analyze the morphology and distribution of second phases around the tear surface. The dendrite arm spacing and grain size were measured using an optical microscope (Olympus) and Clemex image analyzer.
3. Results
3.1 Hot tearing sensitivity
The HTS index obtained for the different alloys are given in Table 4 and these values are plotted against the Fe/Si ratio in Figure 3 and against the iron content in Figure 4. It was found that the alloys containing more than 0.01wt% Ti had a fine grain microstructure while the other ones had a coarse grain microstructure. The white symbols in Figures 3 and 4 represent the alloys having a fine grain microstructure and the black symbols represent the alloys having a coarse grain microstructure. The results obtained with this CRC mould show that the susceptibility to hot tearing was influenced by the iron to silicon ratio or by the iron content when the microstructure was composed of coarse grains. It is worth to mention that the experimental results obtained in this investigation were reproducible.
Table 4: Severity of cracks (C) in each bar and HTS index of alloys having different Fe/Si weight ratio
Alloy Code Bar A (L = 50.8 mm) Bar B (L = 88.9 mm) Bar C (L = 127 mm) Bar D (L = 165.1 mm) Fe/Si HTS B206 0 0 0 2 0.60 0.31 B1213 0 0 1 3 0.92 0.66
B2312 0 0 2 4 1.92 1.02 B3511 0 0 3 4 3.18 1.22 B3223 0 0 0 4 1.39 0.62 B3134 0 0 0 4 0.91 0.62 B2121 0 0 0 4 1.00 0.62 B2332 0 0 0 4 0.85 0.62
3.2 Hot tear profile
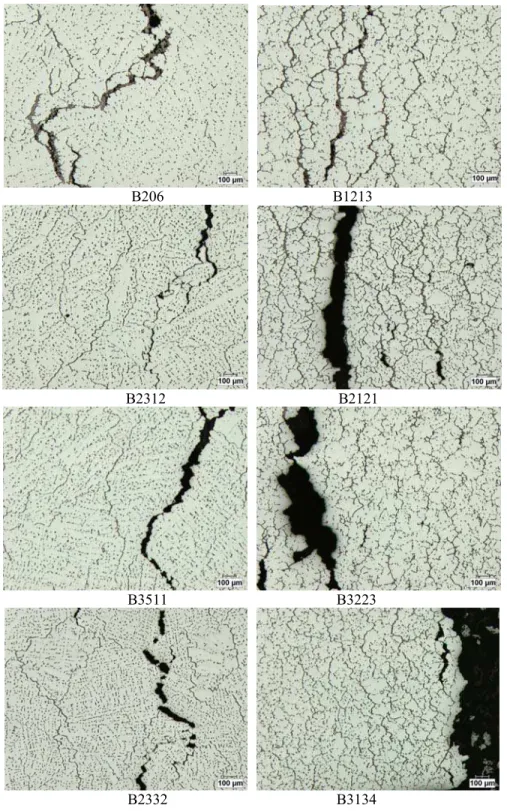
Figure 5 presents the profile of hot tears produced on bar D of the CRC mould. These bars were completely broken, except those being cast with alloys B206 and B1213. Indeed, one can see for these alloys that unbroken ligaments remain across the main crack and bind the two portions of the bar. For all other alloys, no ligaments are visible since cracking was complete. In these cases, the two portions of the bars were brought back together for the polishing, as mentioned in the experimental procedure. The most important aspect revealed by these pictures is the two different grain sizes obtained. The dendrites branches are well defined in the microstructures shown in Figure 5 and the dendrite arm spacing was measured for each. The
Figure 4: HTS as a function of weight% Fe. Black symbols represent alloys having a coarse grain microstructure and white symbols represent alloys having a fine grain microstructure.
0.00 0.05 0.10 0.15 0.20 0.25 0.30 0.00 0.05 0.10 0.15 0.20 0.25 0.30 0.35 0.40 H o t T ear in g Se ns it iv it y Weight Percent Fe B206 B1213 B2312 B2121 B3511 B3223 B3134 B2332
Figure 3: HTS as a function of iron to silicon mass ratio. Black symbols represent alloys having a coarse grain microstructure and white symbols represent alloys having a fine grain microstructure.
0.00 0.05 0.10 0.15 0.20 0.25 0.30 0.0 0.5 1.0 1.5 2.0 2.5 3.0 3.5 H o t T ea rin g S en sit iv it y
Mass ratio Fe/Si
B206 B1213 B2312 B2121 B3511 B3223 B3134 B2332
results are given in Table 5. Finally, it is interesting to notice that the amount of enriched frozen liquid in the crack increases as the amount of iron is reduced.
B206 B1213
B2312 B2121
B3511 B3223
B2332 B3134
Table 5: Measured Dendrite Arm Spacing (DAS) on bar D of castings Alloy DAS (µm) B206 38 B1213 50 B2312 38 B2121 53 B3511 32 B3223 57 B3134 58 B2332 48
3.3 Hot tear surface analyses
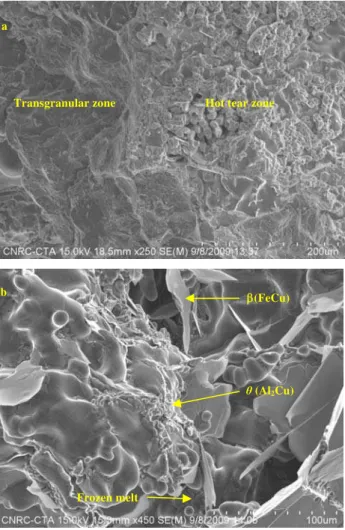
The fracture surface analysis was carried out on completely broken bars of the alloys B2312, B3511, B3223, B3134, B2121, B2332, and on partially broken bar of the alloy B1213. For the alloy B206, the crack was too superficial to undertake a fractographic analysis. Pictures of the crack surface of alloy B1213 are presented in Figure 6. The hot tear zone and the transgranular surface created by breaking the remaining ligaments have a very different aspect as this can be seen on Figure 6-a. The hot tear zone include intermetallics like (FeCu) platelets, rounded particles of θ phases and frozen eutectic liquid distributed over primary aluminum dendrites.
(FeCu)
θ (Al2Cu)
Frozen melt
Transgranular zone Hot tear zone a
b
Figure 6: SEM pictures of partially broken bar of alloy B1213.
(a) Hot teared zone with frozen liquid and transgranular zone created at ambient temperature. (b) Near the surface (teared zone)
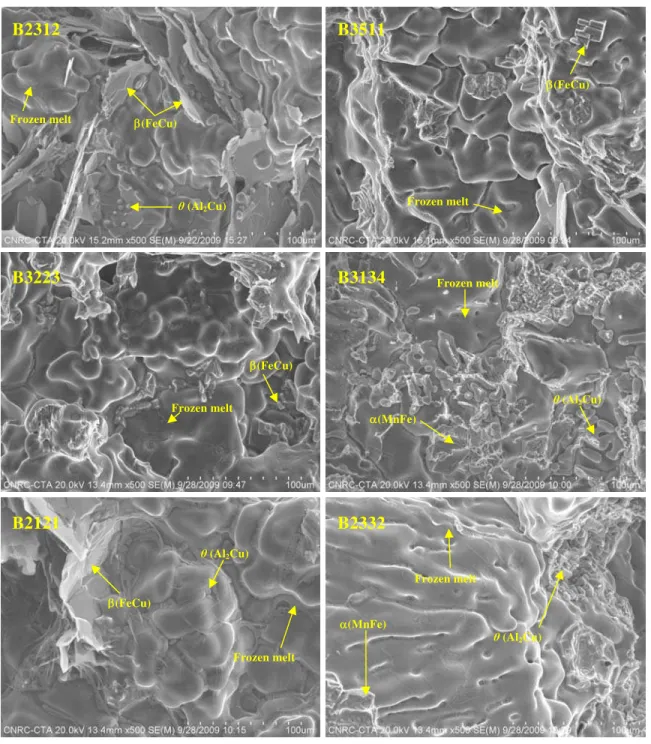
Pictures of completely broken bar of alloys B2312, B3511, B2121, B3223, B3134 and B2332 are presented in Figure 7. Two of the alloys, namely B2332 and B3134, have much more (MnFe) than (FeCu) on the hot tear surface, the latter being present in negligible amounts. All other alloys contain a larger proportion of (FeCu) platelets. The presence of particles emerging from the tear surfaces of alloys B1213, B2312, B2121, B3134 and B2332 suggest that hot tears were still opening at a temperature lower than the onset temperature of the eutectic reaction (< 540ºC). The similarity in shape of the θ particles and their small sizes results from eutectic precipitation and insufficient time to grow due to cracking before complete solidification. At this point, the dendrite coherency point had been reached and dendrite separation was necessary for hot tearing to occur.
(FeCu) θ (Al2Cu) Frozen melt (MnFe) θ (Al2Cu) Frozen melt (MnFe) Frozen melt θ (Al2Cu) (FeCu) Frozen melt (FeCu) θ (Al2Cu) Frozen melt (FeCu) Frozen melt
B2312 B3511
B3223 B3134
B2121 B2332
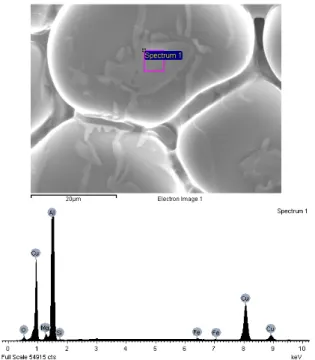
On the other hand, the θ particles are completely absent on the tear surfaces of alloys B3511 and B3223. The tear surfaces of these alloys include essentially (FeCu) platelets and frozen liquid on primary aluminum dendrites and at grains boundaries. The quite small size of the (FeCu) platelets in these alloys suggests that the tear maybe occurred early during the stage of the pre-eutectic precipitation (~590ºC). The composition of the frozen liquid presented in Figure 8 for alloy B3511was determined by energy dispersive spectrometry and is given in Table 6. Since the content in Cu is higher than the expected eutectic composition (around 32wt%), one concludes that the last liquid phase solidified as a divorced eutectic.
Table 6: Composition of the frozen liquid in the area shown in Figure 6. Element Weight% Atomic%
O 2.90 6.34 Mg 1.29 1.86 Al 52.02 67.49 Si 0.21 0.27 Fe 0.44 0.27 Cu 43.14 23.76
4. Discussion
4.1 Impact of alloy composition on solidification path and hot tearing resistance
Since the earliest works on the subject, the hot tearing susceptibility of metals and alloys has always been associated to their solidification range and to the amount of liquid phase present at their eutectic temperature [27-30]. Taking this into consideration, it was decided to study the fraction liquid evolution of the alloys investigated to see how fraction liquid could explain the variation of HTS. The evolution of fraction liquid of the different alloys was estimated with a computational algorithm developed by Larouche[31]. This algorithm calculates the solidification path in multiphase systems by using the mobility of each element in
the primary phase to account for the effect of back diffusion. This scheme was used with the software Thermo-Calc [32]. Thermodynamic variables were computed with the database TTAL6 [33] and the mobility of elements were retrieved from the MOBAL1 database [34]. The average cooling rates were evaluated by dividing the solidification interval with the solidification time, the latter being estimated from dendrite arm spacing (DAS) measurements conducted on alloy B206. The following relationship was used:
n c
DAS A V (4)
Where A and n are empirical parameters and Vc is the cooling rate (K/s). Eskin et al. [35] determined for the
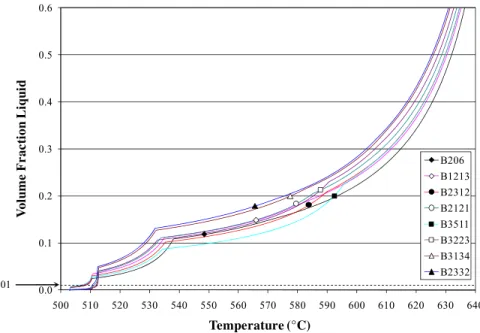
binary alloy Al-4.3%Cu that A and n were respectively 76.1 and 0.40 with DAS given in µm. The composition of this alloy was near the composition of alloy B206 used in this investigation, so the values given above for A and n were used. Based on the DAS measured on alloy B206, a cooling rate of 341 K/min and a characteristic solidification time of 25.1 s were estimated for specimens cast in the CRC mould. These parameters were used for all compositions considering that cooling conditions were the same for all and that the difference of compositions had only marginal effects on thermophysical properties as well as on liquidus and solidus temperatures. The back diffusion model requires also a characteristic length of the cast microstructure as an input parameter and the DAS of each cast alloy was measure for that purpose.. The evolutions of the volume fraction liquid in the last stage of solidification are presented in Figure 9.
Notice that equilibrium conditions were assumed at the liquid-solid interface and that phases Al6Mn and
Al3Fe were not included in the analysis since they were not find in the microstructures. For alloys B2332
and B3134, the (FeCu) phase was also excluded since it was not present in noticeable quantities. This fact was already observed before and discussed in reference [24]. The absence of (FeCu) phase in B2332 and B3134 explains why there is no downward inflexion of the calculated fraction liquid at around 590°C for these two alloys. The quasi absence of inflexion at this temperature for the B206 alloy is due to the small amount of (FeCu) phase formed because of the low iron content in this alloy. The sharp inflexion of fraction liquid occurring at around 532−539°C is caused by the eutectic reaction where the -phase is formed. At this stage, there is less than 13 vol% of liquid in the microstructure and the system is close to the so-called vulnerable range (fraction liquid between 10 and 1 vol%) as suggested by Clyne and Davies
[5]
. The symbols in Figure 9 are data points corresponding to the temperature and volume fraction liquid at which the volume of all secondary phases occupies 2% of the interdendritic volume. It is clear that the temperature at which this situation occurs differs significantly from one alloy to another. Considering the
0.01 0.0 0.1 0.2 0.3 0.4 0.5 0.6 500 510 520 530 540 550 560 570 580 590 600 610 620 630 640 V o lum e F r a c ti o n L iqui d Temperature (°C) B206 B1213 B2312 B2121 B3511 B3223 B3134 B2332
Figure 9: Calculated temperature evolution of volume fraction liquid for each alloy. The symbols represent the temperature and volume fraction liquid at which the volume of all secondary phases occupies 2% of the interdendritic volume.
potential impact that secondary phases may have on the flow of liquid in the dendritic microstructure, it was decided to look for a redefinition of the vulnerable time period and the time period available for accommodation. The hot tearing index (HCS) proposed by Katgerman can be rewritten in terms of temperature as below: cr 0.01 coh cr T T HCS T T (5)
Where T0.01 is the temperature at which the volume fraction liquid is equal to 0.01, Tcoh is the dendrite
coherency temperature and Tcr is the temperature below which afterfeeding is inadequate. For the 8 alloys
investigated, Tcoh varies in a relatively small range if it is defined at a constant volume fraction liquid. For
instance, if Tcoh is defined as the temperature where the volume fraction liquid is equal to 0.6, then one can
see on Figure 9 that Tcoh varies between 631 and 637°C. For T0.01, the values are also limited to a narrow
range since they take values between 506 and 512°C. Notice that thermal analysis performed on similar alloys and presented in reference [36] revealed that dendrite coherency points were obtained at a volume fraction liquid of around 0.6. The dendrite coherency points were determined following the method proposed by Backerud et al. [37]. The key parameter in equation 3 is certainly Tcr. Katgerman based the
definition of this parameter according to Feurer’s criterion, telling that the critical temperature is attained when the velocity of volume shrinkage is equal to the maximum volumetric flow rate per unit volume [4]. This theory was developed for systems for which only the liquid and primary dendritic phases were considered in the solidification path. As mentioned above, when a certain amount of secondary phases grow in the interdendritic space, they must have an immediate effect on the ability of the liquid phase to flow in the dendrites and between the grains. To take this into account, one can define Tcr as the
temperature where a given portion of the interdendritic volume is occupied by secondary phases. Choosing a volume fraction of 0.02, this condition can be written as:
Tcr = Temperature at which 1 0.02 1 l pp pp g g g (4)
where gl and gpp are the volume fraction of respectively the liquid and the primary phase. If we assume that
dendrite coherency occurs when the volume fraction liquid is equal to 0.6, the index HCS calculated with equation (3), using Tcr as defined by equation (4), gives the plots presented in Figures 10 and 11.
Figure 10: Hot tearing index HCS versus the Fe/Si ratio for the 8 alloys investigated.
0.0 0.5 1.0 1.5 2.0 2.5 0.0 0.5 1.0 1.5 2.0 2.5 3.0 3.5 HCS
Mass ratio Fe/Si
B206 B1213 B2312 B2121 B3511 B3223 B3134 B2332
The HCS index presented above are based on the calculation of solidification paths, which depend almost exclusively on the composition of the alloy, back diffusion having only a minor effect on the results at the applied cooling rate. Small variations of the Cu content around the average value of the alloys also have a minor effect on the solidification path as this was verified with the computational scheme. Based on that, one cannot establish a very clear relationship between HCS and the Fe/Si ratio since the trend presented in Figure 10 is not unique. The trend shown by alloys having a coarse grain size (black symbols) is however in excellent agreement with the trend obtained experimentally between HTS and the Fe/Si ratio (see Figures 3 and 10). For the alloys having a fine grain size (white symbols), no trend was observed experimentally. We explain this result by the lack of sensitivity of the CRC mould used to discriminate the hot tearing tendency when the microstructure is fine. Indeed, cracking in refined alloys were less prominent and it would be better to cast longer bars to get more cracks. This is particularly true for the 3 shortest bars, which did not show any crack in 3 of the 4 alloys having a fine microstructure. Regarding the effect of Fe content alone, one can see in Figure 11 that the evolution of HCS with the Fe content is much more significant. All alloys having (FeCu) phase in the solidification path show a near linear increase of HCS with the iron content. The two alloys represented by triangles are the only two having a distinctive behaviour. These are the alloys for which a negligible amount of (FeCu) platelets were found in the microstructure. Taking this as a fact, the solidification path was calculated without the (FeCu) phase, which resulted in significantly different values of Tcr and of HCS consequently. Now, if we compare the ordering of the alloys having a
coarse microstructure (black symbols) in Figure 11 and Figure 4, one can see the excellent agreement between the evolution of HTS and HCS versus the Fe content. For the alloys having a fine microstructure, the lack of sensibility of the CRC mould prevents to obtain such a good agreement. The comparison between alloys B2312 and B2332 is particularly interesting. It was clear from the castings that alloy B2312 had a poorer resistance to hot tearing than alloy B2332. Both alloys had a coarse microstructure, the same iron content but different silicon contents. The bars cast with alloy B2332 had a negligible amount of (FeCu) platelets while with alloy B2312, they had a lot of large (FeCu) platelets as this can be seen on fractographies presented in Figure 7. The quasi absence of (FeCu) phase in alloy B2332 is certainly the root cause of its better hot tearing resistance as this was observed experimentally. The presence of (FeCu) platelets emerging above the fracture surface of alloy B2312 is believed to have impeded the flow of liquid metal toward the growing crack, pushing the system early in the vulnerable range. This explanation is in conformity with the hot tearing criterion proposed by Katgerman, taking as determinant, the amount of secondary phases in the interdendritic channels, which act as efficient obstacles to the free movement of the liquid phase.
The good fit between the theoretical (HCS) and experimental (HTS) index was obtained by setting a value of 2% to the volume occupied by secondary phases in the interdendritic space. In fact, this parameter could have been set to a value between 1.5% and 3.0% while giving a good fit between HCS and HTS. So a value
0.0 0.5 1.0 1.5 2.0 2.5 0.00 0.05 0.10 0.15 0.20 0.25 0.30 0.35 0.40 HC S Weight Percent Fe B206 B1213 B2312 B2121 B3511 B3223 B3134 B2332
Figure 11: Hot tearing index HCS versus the iron content for the 8 alloys investigated.
of 2% was chosen. The values of Tcr with this criterion are dispersed over a large range of temperature as
illustrated in Figure 9 and are higher than the onset temperature of eutectic precipitation. This observation underlines clearly how important is the iron content in the establishment of the vulnerable regime when the microstructure is composed of coarse grains. In binary alloys, it is widely accepted that the starting point of the vulnerable regime corresponds approximately to a volume fraction liquid of 10% [38, 39]. Based on our analysis, this critical fraction liquid is raised up to around 20% when 0.35 wt% Fe is present in the melt. The two highest values of Tcr were obtained for alloys B3511 and B3223 and they were respectively 592
and 588°C. It was mentioned in section 3.3 that these two alloys had many small (FeCu) platelets on their fracture surfaces, suggesting a very early opening of the crack where they were found. It is worth to mention that the Tcr values given above are just below the onset temperature of the (FeCu) precipitation
which, according to the calculated solidification paths, are 595 and 590°C for respectively alloy B3511 and B3223. So it seems reasonable to think that as soon as the interdendritic channels are obstructed by a sufficient amount of secondary phase particles, the system enters into the vulnerable regime, where a pore or a crack starts to form and grow. Considering the aspect ratio of the pre-eutectic intermetallics, it is also reasonable to think that a volume ratio as low as 2% of intermetallics in the interdendritic space is sufficient to impede the flow of liquid. The alloy showing the best resistance to hot tearing is undeniably the B206 alloy. Having a value of Tcr = 548°C, the lowest among all, it is clear that this alloy was able to
accommodate more easily a large portion of the shrinkage deformation by inflow of liquid metal in the vulnerable zone. This is clear in Figure 5 where one can see that the crack was partly filled by enriched liquid before freezing occurred. The same thing is observed in alloy B1213, but to a lower extent. Notice that the later also has a low value of Tcr. One would expect a similar enrichment of liquid in alloy B2332,
but this was not the case. The quasi absence of (FeCu) phase in this alloy maybe has promoted a more equal distribution of the liquid phase among the grains.
4.2 Impact of grain refiners on hot tearing resistance
The level of grain refining was targeted to be under the limit of 0.05 wt% Ti as recommended by Sigworth and Major for the AA206 alloy [40]. The actual Ti contents were below that limit, 4 alloys having a content equal or inferior to 0.01 wt% and the other 4 having a content equal or superior to 0.02 wt%. This gave two kinds of microstructure. The alloys cast with 0.01wt% Ti or less had a coarse grain microstructure while the alloys cast with higher Ti contents had a fine grain microstructure. The impact of grain size on hot tearing resistance was immediate, the alloys with a fine microstructure showing a decreased hot tearing sensitivity in comparison to alloys having a coarse microstructure. Such an influence of the grain size on hot tearing resistance is known since a long time ago. Sigworth and Major specified that a maximum of 0.05wt% Ti must be used for B206 alloys in order to improve their resistance to hot tearing. The present results show that a lower limit of 0.02 wt% Ti should be used to avoid a too coarse microstructure, detrimental to the hot tearing resistance of the alloy. This has been validated on 206 type alloys having higher amounts of Fe and Si than the standard alloy B206. It is likely that a content of 0.02wt% Ti in the standard B206 would produce an alloy having a finer microstructure and showing a better hot tearing resistance than the B206 used in this investigation.
The effect of grain refiners on grain size (below the 0.05 wt% Ti limit) is the same as the one observed by D’Elia and Ravindran [41] on their B206 castings. Indeed, they found a significant decrease of grain size as soon as a minimum amount of 0.02 wt% Ti was added via Al-Ti-B grain refiner. They explained that fine equiaxed grains promotes liquid feeding among the grains since they have less branches and entrap less liquid phase than the large dendritic grains obtained in unrefined alloys. Consequently, the hot tearing resistance was improved with Ti contents higher or equal to 0.02wt%. Our results indicate that 0.01wt% Ti is not a sufficient level to improve hot tearing resistance since the grains obtained were large and dendritic. As mentioned in the introduction, Chadwick found that small additions of iron were beneficial for the hot tearing resistance of Al-4.5%Cu alloy, while we found the opposite. In fact, the detrimental effect of iron on hot tearing observed in the present study was only found on alloys having a coarse dendritic microstructure. The minimum titanium content used by Chadwick was 0.07wt% and the grains obtained were equiaxed and approximately 10 times smaller than the grains we have obtained with 0.01 wt% or less of titanium. D’Elia and Ravindran explain that a fine grain microstructure have a large number of paths
available for liquid metal feeding, which improves the accommodation processes reducing the hot tearing susceptibility of the alloy. With a large number of available paths and less liquid phase entrapped in the dendrites, the plugging effect of the iron intermetallics is likely diminished since the thickness of the intergranular liquid films do not decrease proportionally with the grain size. It is possible under such conditions that the strengthening effect of the iron intermetallics comes into play as suggested by Chadwick. The strengthening mechanisms in semi solid alloys have not been studied intensively since most of the contributions have focused their attention on the accommodation processes. Such investigations will require however to use well designed equipments, enabling a fine rating of hot tearing sensitivity of alloys having the optimized grain size.
5. Conclusion
The hot tearing behaviour of 206 type aluminium alloy was investigated to see the influence of minor additions of iron and silicon. The results obtained with coarse dendritic microstructures show that the susceptibility to hot tearing is highly influenced by the iron content, which promotes the formation of the deleterious (FeCu) phase, unless there is an equal or superior mass content of silicon promoting the formation of the (MnFe) phase at the expense of the (FeCu) phase. Notice that moderately high cooling rates must be applied to avoid the formation of (FeCu) phase since the latter is thermodynamically stable in 206 type alloys. The formation of (FeCu) platelets in these alloys is particularly detrimental since it makes the system to enter early in the vulnerable regime by impeding the flow of liquid in the healing process. The formation (MnFe) phase is less harmful since the latter nucleates at a higher temperature, where there is more liquid to accommodate the solidification shrinkage.
The hot tearing susceptibility of the alloys was evaluated experimentally with a new index called Hot Tearing Sensitivity, which was defined to reflect the compliance of the cracked specimen. This index was compared with the theoretical hot tearing index proposed by Katgerman and an excellent qualitative agreement was obtained, providing that the critical temperature Tcr used in the theoretical index represents
the temperature at which 2% of the interdendritic volume is occupied by secondary phase particles. For alloys containing iron as impurity, this means that the vulnerable regime can start at a temperature above the eutectic point, where the volume fraction liquid can be as high as 0.2 when the iron content is around 0.3wt%. However, this 2% criterion used to determine Tcr is probably not a general condition that will work
in all systems and microstructures.
A lower limit of 0.02 wt% Ti was confirmed to produce an effective grain refining in 206 type aluminium alloys. If the titanium content is equal or below 0.01wt%, a coarse dendritic microstructure is obtained, which shows a poor hot tearing resistance, especially when the iron content is increased.
Acknowledgments
The authors thank University of Quebec at Chicoutimi (UQAC) and the Aluminum Research Center - REGAL for financial assistance, as well as National Research Council Canada - Aluminum Technology Centre for their technical support.
References
1. Burke, P., Weiss, D., Fasoyinu, F., Thomson, J., Sahoo, M., Modern Casting, 98, [2], (2008), pp. 43-46. 2. Larouche, D., Langlais, J., Wu, W., Bouchard, M., Metallurgical and Materials Transactions B, 37B,
(2006), pp. 431-443.
3. Rappaz, M., Drezet, J.-M., Gremaud, M., Metallurgical and Materials Transactions A, 30A, (1999), pp. 449-455.
4. Feurer, U., Quality Control of Engineering Alloys and the Role of Metals Science, Delft University of Technology, Delft, The Netherlands, (1977), pp. 131-145.
5. Clyne, T.W., Davies, G.J., “The Influence of Composition on Solidification Cracking in Binary Alloy Systems”, Brit. Foundryman, 74, (1981), pp. 65-73.
6. Katgerman, L., JOM, 34 (2), (1982), pp. 46-49.
7. M’Hamdi, M., Mo, A., Martin, C.L., Metallurgical and Materials Transactions A, 33A, (2002), pp. 2081-2093.
8. Suyitno, Eskin, D.G., Savran, V.I., Katgerman, L., Metallurgical and Materials Transactions A, 35A, (2004), pp. 3551-3561.
9. Katgerman, L., Eskin, D.G., Hot Cracking Phenomena in Welds II, Böllinghaus, T., Herold, H., Cross, C.E., Lippold, J.C., eds, Springer, (2008), pp. 3-18.
10. Suyitno, Kool, W.H., Katgerman, L., Metallurgical and Materials Transactions A, 36A, (2005), pp. 1537-1546.
11. Mo. A, M'Hamdi, M., Fjær, H.G., Modeling of Casting, Welding and Advanced Solidification Processes X, Stefanescu, D.M., Warren, J., Jolly, M., Krane, M., eds, TMS (The Minerals, Metals & Materials Society), (2003), pp. 199-206.
12. M'Hamdi, M., Fjær, H.G., Mo. A, Mortensen D., Benum, S., Solidification of Aluminum Alloys, Q. Han, Q., Chu, M.G., Granger, D.A., eds, TMS (The Minerals, Metals & Materials Society), (2004), pp. 191-199.
13. Mathier V., Drezet, J.-M., Rappaz, M., Modelling and Simulation in Materials Science and Engineering, 15, (2007), pp. 121-134.
14. Vernède, S., Dantzig, J.A., Rappaz, M., Acta Materialia, 57, (2009), pp. 1554–1569.
15. Eskin, D.G., Suyitno, Katgerman, L., Progress in Materials Science, 49, (2004), pp. 629–711.
16. Novikov, I.I., Goryachelomkost tsvetnykh metallov i splavov (Hot shortness of non-ferrous metals and alloys). Moscow: Nauka; (1966), p. 299.
17. Oya, S; Fujii, T; Ohtaki, M; Baba, S., Journal of Japan Institute of Light Metals, 34, [9], (1984) pp. 511-516.
18. Chadwick, H., Cast Metals, 4, [1], 1991, pp.43-49.
19. Novikov I.I., Grushko, O.E., Materials Science and Technology, 11, (1995), pp. 926-932.
20. Nagaumi, H., Suzhuki, S., Okane, T., Umeda, T., Materials Science Forum, 539-543 (2007), pp. 380-385.
21. Lesoult G., International Journal of Cast Metals Research, 22, [1-4], (2009) , pp. 2-7. 22. Guven, Y.F., J. Hunt, D., Cast Metals, 1, [2], (1988), pp. 104–111.
23. Tseng, C.J., Lee, SL, Wu, T.F., Lin, J.C., Materials Transactions, JIM, 41, [10], (2000), pp. 708-713. 24. Kamguo Kamga, H., Larouche, D., Bournane, M., Rahem, A., “Solidification of Aluminum-Copper
B206 Alloys with Iron and Silicon Additions”, Accepted for publication in Metallurgical and Materials Transactions A, 2010.
25. Rodríguez, A., Chávez, R., Hernández, J., Raymond, Y., Major, J.F., Modern Casting, 100, [1], 2010, pp.42-44.
26. Couture, A., Edwards, J.O., Trans. AFS., 74, (1966), pp. 709-721. 27. Vero, J., The Metal Industry, 48, (1936), pp. 431-442.
28. Singer, A.R.E., Cottrell, S.A., J. Inst. Metals, 73, (1946), pp. 33-54. 29. Lees, D.C.G., J. Inst. Metals, 72, (1946), pp. 343-364.
30. Pumphrey, W.I., Jennings, P.H., J. Inst. Metals, 75, (1948), p. 235-256. 31. Larouche, D., CALPHAD, 31, (2007), pp 490-504.
32. Sundman, B, Jansson, B, Andersson, J-O, CALPHAD, 9, (1985), pp. 153-190.
33. TTAL6, TT Al-based Alloys Database, version 6.0, ThermoTech Ltd, Surrey Technology Center, Guildford, UK.
34. MOBAl1, TCS Al-Alloys Database, version 1.0, Thermo-Calc Software AB.
35. Eskin, D., Du, Q., Ruvalcaba, D. Katgerman, L., Materials Science and Engineering A, 405, (2005), pp. 1-10.
36. Kamguo Kamga, H., PhD thesis, UQAC, Canada, 2010.
37. Backerud, L., Chai, G., Tamminen, J., Foundry Alloys, Solidification Characteristics of Aluminium Alloys, Vol. 2, AFS/Skanaluminium, 1990.
38. Campbell, J., Clyne, T.W., Cast Metals, 3, 1991, pp. 224-226.
39. Forest, B., Bercovici, S., Solidification Technology in the Foundry and Cast House, Proc. Conf. Coventry, England, 15-17 Sept. 1980, (1983), pp. 607-612.
40. Sigworth, G.K., Major, J.F., AFS Transactions, 114, (2006), pp. 117-128. 41. D’Elia, F., Ravindran, C., AFS Transactions, 117, (2009), pp. 139-148.