1 SUPPLEMENTARY DATA FOR
Two-to-three dimensional transition in neutral gold clusters:
the crucial role of van der Waals interactions and temperature
Bryan R. Goldsmith,1,2* Jacob Florian,2 Jin-Xun Liu,2 Philipp Gruene,1 Jonathan T. Lyon,1,3 David M.
Rayner,4 André Fielicke,1* Matthias Scheffler,1 and Luca M. Ghiringhelli1*
1Fritz-Haber-Institut der Max-Planck-Gesellschaft, Faradayweg 4-6, D-14195 Berlin, Germany 2Department of Chemical Engineering, University of Michigan, Ann Arbor, MI 48109‑2136, USA 3Department of Chemistry and Biochemistry, Kennesaw State University, 370 Paulding Avenue NW, MD#1203,
Kennesaw, GA 30144, USA
4National Research Council, 100 Sussex Drive, Ottawa, Ontario, Canada K1A OR6
Corresponding authors: bgoldsm@umich.edu, fielicke@fhi-berlin.mpg.de, ghiringhelli@fhi-berlin.mpg.de
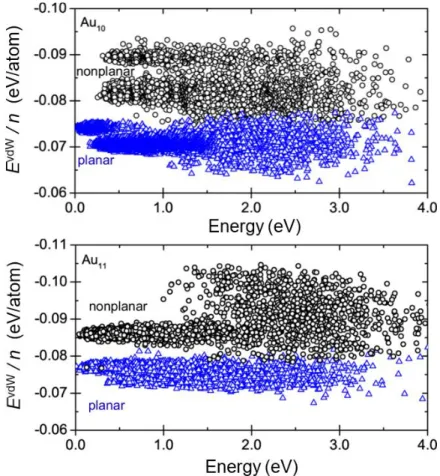
FIG. S1. Many-body dispersion energy per atom (EvdW/n) vs. gold cluster total energy obtained from replica-exchange ab initio molecular dynamics for Au10 (top) and Au11 (bottom). Planar and nonplanar cluster isomers are distinguished based on their radius of gyration (nonplanar clusters have a smaller radius of gyration than planar structures) and designated as blue triangles and black circles, respectively. The MBD energy was computed using PBE+MBD as described in the main text.
FIG. S2. Bond coordination histograms of the most stable planar and nonplanar Au8 isomers. The bond coordination histogram serves as a unique structural fingerprint because it represents each gold isomer as having a certain number of atoms with some bond coordination number. The coordination similarity metric is obtained by constructing a bond coordination histogram for each cluster configuration and computing the cosine distance between each bond coordination histogram (represented as a vector) with respect to the ground state reference. The cosine distance is chosen instead of the Euclidean distance because it is less sensitive to noise (i.e., small perturbations in structure). The gold cluster equilibrium bond distance was set to 2.72 Å for defining the coordination histogram. Color legend: The colors of the gold cluster atoms correspond to their coordination number.
3
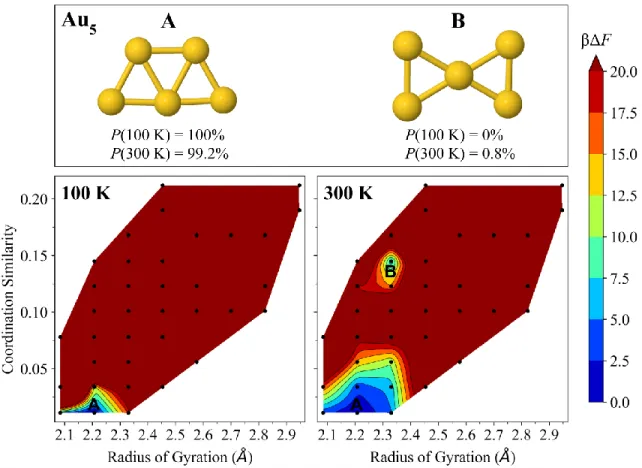
FIG. S3. Free-energy surfaces of Au5 at 100 K (left) and 300 K (right). The dominant isomer 5-A (trapezoid, C2𝑣) and competing isomer 5-B (bow-tie, D2h) have their Boltzmann probabilities Ρ(T) specified at each temperature, as well as their locations marked on the free-energy surfaces. The color bar denotes dimensionless free-energy values (βΔF), where β is 1/kBT. Dark red
regions have βΔF ≥ 20. The black points indicate sampled cluster geometries having the binned (coordination similarity, radius of gyration) value.
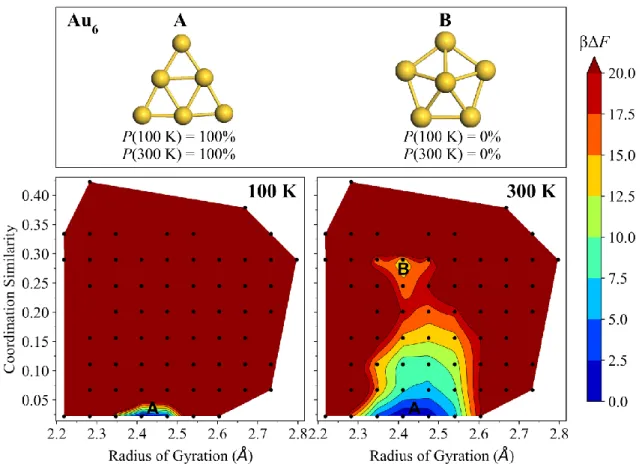
FIG. S4. Free-energy surfaces of Au6 at 100 K (left) and 300 K (right). The dominant isomer 6-A (triangle, D3h) and second most stable isomer 6-B (capped pentagon, C5v) have their Boltzmann probabilities Ρ(T) specified at each temperature, as well as their locations marked on the free-energy surfaces. The color bar denotes dimensionless free-energy values (βΔF), where β is 1/kBT. Dark red regions have βΔF ≥ 20. The black points indicate sampled cluster geometries having the binned (coordination
5
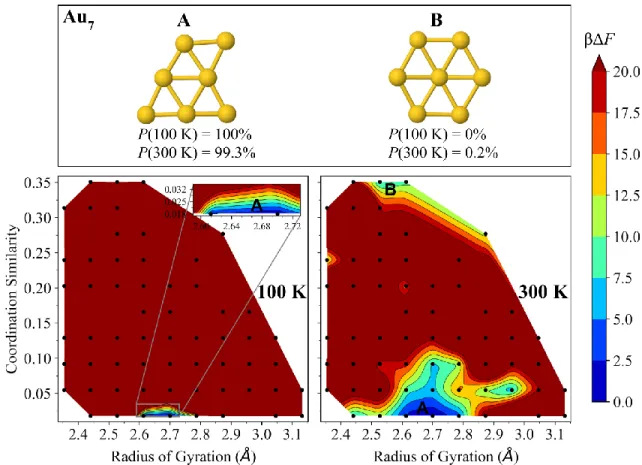
FIG. S5. Free-energy surfaces of Au7 at 100 K (left) and 300 K (right). The dominant isomer 7-A (edge-capped triangle, C𝑠) and competing isomer 7-B (hexagon, D6h) have their Boltzmann probabilities Ρ(T) specified at each temperature, as well as their locations marked on the free-energy surfaces.
FIG. S6. Free-energy surfaces of Au8 at 100 K (left) and 300 K (right). The dominant isomer 8-A (4-fold edge-capped square, D4ℎ) and competing isomer 8-B (triangular pyramid, C3v) have their Boltzmann probabilities Ρ(T) specified at each temperature, as well as their locations marked on the free-energy surfaces.
7
FIG. S7. Metastable Au10 structures corresponding to 10-G+ on the Au10 free-energy surface (FIG. 6 in the main text and FIG. S8 of the SI).
FIG. S8. Free-energy surfaces of Au10 at 500 K (left) and 750 K (right). The dominant isomers 10-D (elongated hexagon, D2h),
10-E (tri-capped hexagon, C2h), 10-F (capped trapezoid, Cs), and 10-G+ have their Boltzmann probabilities Ρ(T) specified at
each temperature, as well as their locations marked on the free-energy surfaces. 10-G+ refers to multiple nonplanar isomers close to each other on the free-energy surface (FIG. S7 of the SI). The color bar represents dimensionless free-energy values (βΔF), where β is 1/kBT. Dark red regions have βΔF ≥ 20. The black points indicate sampled cluster geometries having the
9
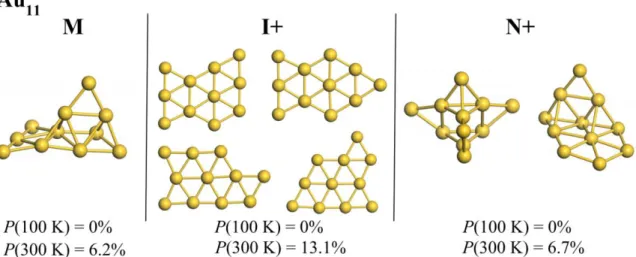
FIG. S9. Metastable Au11 structures corresponding to 11-I+, 11-M, 11-N+ on the Au11 free-energy surface (FIG. 7 in the main text).
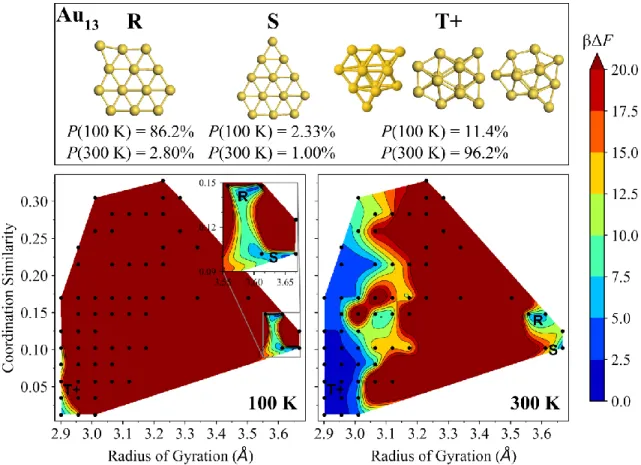
FIG. S10. Free-energy surfaces of Au13 at 100 K (left) and 300 K (right). The dominant isomers 13-R, 13-S, and 13-T+ have their Boltzmann probabilities Ρ(T) specified at each temperature, as well as their locations marked on the free-energy surfaces. The color bar denotes dimensionless free-energy values (βΔF), where β is 1/kBT. Au13 structures (13-T+) are not shown for clarity, but match those of E. C. Beret, L. M. Ghiringhelli, and M. Scheffler, Farad. Discuss. 152, 153 (2011).
11
FIG. S11. Comparison of experimental FIR-MPD and theoretical harmonic IR spectra (at 0 kelvin) for Au9, Au10, and Au11. For each size, the two upper panels show the experimental spectra for the complexes with a single and two Kr atoms and below the theoretical IR spectra are shown. A rigid shift of 8 cm-1 is used for Au
9 and Au10, whereas a rigid shift of 12 cm-1 is used for Au11. Gaussian broadening with a 5 cm-1 FWHM is used. Structures surrounded by a black-dashed box are assigned to experimental FIR-MPD spectra based on Pendry R-factor analysis and the free-energy calculations.
FIG. S12. Comparison of experimental FIR-MPD and theoretical harmonic IR spectra (at 0 kelvin) for Au12 and Au13. For each size, the top panels show the experimental spectra for the complexes with one or two Kr atoms and below the theoretical IR spectra are shown. A rigid shift of 3 cm-1 and 8 cm-1 is used for Au
12 and Au13 simulated spectra, respectively. Gaussian broadening with a 5 cm-1 FWHM is used. Structures surrounded by a black-dashed box are assigned to experimental FIR-MPD spectra based on Pendry R-factor analysis and the free-energy calculations.
13
Table S1. Energy difference (eV) between the lowest energy planar (2D) and nonplanar (3D) isomers for Au5–Au13 using various density functional approximations and beyond. The values in this table correspond to FIG. 2 in the main text. The planar and nonplanar gold clusters used to obtain the energy differences correspond to those shown in FIG. 1 of the main text. The most stable planar and nonplanar 2D and 3D isomers at 0 K did not change for the considered DFAs.
Cluster size PBE PBE+TS PBE+MBD HSE06 HSE06+TS HSE06+MBD RPA@PBE
Au5 −0.964 −0.981 −0.929 −0.973 −0.992 −0.946 −0.901 Au6 −0.980 −0.949 −0.938 −0.937 −0.912 −0.903 −0.957 Au7 −0.296 −0.287 −0.267 −0.246 −0.237 −0.220 −0.199 Au8 −0.526 −0.464 −0.416 −0.522 −0.458 −0.427 −0.445 Au9 −0.265 −0.187 −0.218 −0.234 −0.168 −0.189 −0.154 Au10 −0.249 −0.136 −0.179 −0.221 −0.135 −0.154 −0.118 Au11 −0.096 0.015 0.001 0.006 0.090 0.098 0.126 Au12 −0.525 −0.348 −0.231 −0.394 −0.251 −0.135 −0.108 Au13 −0.451 −0.156 −0.034 −0.278 −0.025 0.092 0.089 MAE 0.187 0.093 0.071 0.130 0.057 0.030 -- STDev 0.166 0.086 0.041 0.110 0.045 0.014 --
*Mean absolute error (MAE) and standard deviation (STDev) with respect to RPA@PBE. **Negative values indicate that a planar structure is preferred over the nonplanar structure.