Publisher’s version / Version de l'éditeur:
Vous avez des questions? Nous pouvons vous aider. Pour communiquer directement avec un auteur, consultez la première page de la revue dans laquelle son article a été publié afin de trouver ses coordonnées. Si vous n’arrivez pas à les repérer, communiquez avec nous à [email protected].
Questions? Contact the NRC Publications Archive team at
[email protected]. If you wish to email the authors directly, please see the first page of the publication for their contact information.
https://publications-cnrc.canada.ca/fra/droits
L’accès à ce site Web et l’utilisation de son contenu sont assujettis aux conditions présentées dans le site LISEZ CES CONDITIONS ATTENTIVEMENT AVANT D’UTILISER CE SITE WEB.
Research Report (National Research Council of Canada. Institute for Research in
Construction), 2004-09-20
READ THESE TERMS AND CONDITIONS CAREFULLY BEFORE USING THIS WEBSITE.
https://nrc-publications.canada.ca/eng/copyright
NRC Publications Archive Record / Notice des Archives des publications du CNRC :
https://nrc-publications.canada.ca/eng/view/object/?id=a36e1dff-6de3-4d17-b640-53e8fa28c654 https://publications-cnrc.canada.ca/fra/voir/objet/?id=a36e1dff-6de3-4d17-b640-53e8fa28c654
NRC Publications Archive
Archives des publications du CNRC
For the publisher’s version, please access the DOI link below./ Pour consulter la version de l’éditeur, utilisez le lien DOI ci-dessous.
https://doi.org/10.4224/20377999
Access and use of this website and the material on it are subject to the Terms and Conditions set forth at
Residential Fire Scenario Analysis in Ontario 1995-2003
Residential Fire Scenario Analysis in
Ontario 1995-2003
Research Report No. 173
Date: September 20, 2004
Authors: Abderrazzaq Bounagui
Noureddine Bénichou
Ederne Victor
Published by
Institute for Research in Construction National Research Council Canada Ottawa, Canada
Abstract
This report identifies some very important features of fatal fires in Ontario. It locates, for example, the victims’ position in the houses and tentatively explains why the victims were unable to save themselves. It provides sufficient details to indicate research that can be undertaken to help make homes a safer place to live.
Based on the Ontario data for the period 1995-2003, residential fires occurred most frequently in the kitchen and cooking areas. However, fatal fires are more frequent in living rooms (45.1% of fatalities) and are in general caused by a smoker’s materials such as cigarettes, cigars, matches, lighters, etc. used in conjunction with smoking (37.4% of fire deaths). When a deadly fire breaks out, most of the time, upholstered furniture is the first material to be ignited (26% of fire deaths). The most probable levels for fatal fires to occur in Ontario houses are on the ground floor (59 % of deaths), the second stories (17.3% of deaths), the basements (14.8% of deaths), and the third floors (3.9 % of deaths). Fire kills because, in part, the victims are either too young or too old to react quickly and effectively to a fire emergency.
Table of contents Abstract ... i Table of contents... ii List of figures...iii 1 INTRODUCTION... 1 2 AREAS OF ORIGIN ... 1 3 SOURCES OF IGNITION... 2
4 MATERIAL FIRST IGNITED ... 2
5 LEVEL OF ORIGIN AND TIME OF OCCURENCE ... 3
6 CONDITION OF CASUALTY ... 4
7 CONCLUSION ... 6
8 ACKNOWLEDGEMENT... 7
REFERENCES... 8
List of figures
Figure 1: Residential fire deaths by Area of Origin in Ontario... 1
Figure 2: Distribution of fire deaths by Sources of Ignition in Ontario ... 2
Figure 3: Distribution of fire deaths by Materials First Ignited ... 3
Figure 4: Fire deaths by level of Fire Origin ... 3
Figure 5: Fire deaths by the Time of Occurrence... 4
Figure 6: Average Fire Deaths in Ontario by Victims’ Age... 5
Figure 7: Average Residential fire Deaths by Condition of Casualty in Ontario... 5
Residential Fire Scenario Analysis in Ontario 1995-2003
1 INTRODUCTION
This work was undertaken to develop a comprehensive fatal fire scenario analysis for residential houses in Canada over the period 1986 to 2003. It turns out that the information required to carry out such an analysis is not available. For the period 1986-2003, an average of 33.8% of fires in Canada occurred in Ontario [1]. This report focuses only on Ontario for which data suitable to fire scenario analysis has been provided for the period 1995-2003 [2 to 13]. It details, among other things, the areas of origin of most fatal residential fires, the source of ignition, the materials first ignited, the building level of origin, as well as the physical conditions of the fire fatalities at the time of the fire.
2 AREAS OF ORIGIN
Over the period 1995-2003, 6,739 fires and 717 deaths have been recorded in residential houses in Ontario. Most of these fires (28.6%) occurred in the kitchens & cooking areas, then followed by the living areas (12.6%), and the sleeping areas (11.3%). These three areas listed above are also the most fatal places for fire. The living areas constitute the most deadly places in Ontario homes. They account to occur for 45.1% of fire fatalities; they are followed by the sleeping areas (20.0%), and by the kitchen & cooking areas (16.9%). Figure 1 shows the average fire deaths by areas of origin. Living Rooms S leeping A reas Cooking A reas O th er areas 45.1 20.0 16.9 18.0
Figure 1: Residential fire deaths by Area of Origin in Ontario
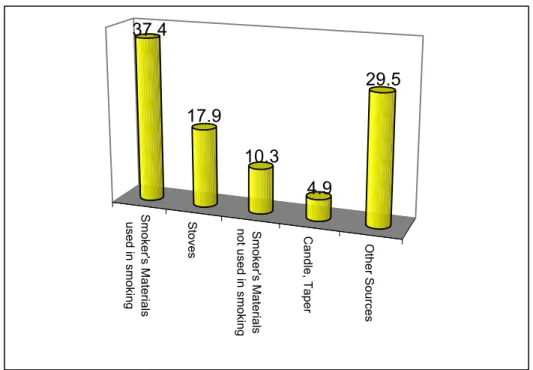
3 SOURCES OF IGNITION
Four items constitute the most popular sources of ignition in Ontario. They are responsible on for only 47.3% of the fires but they cause more than 70% of fire deaths. These items are the smoker’s materials used in conjunction with smoking-cigarettes, cigars, pipes, matches, lighters, etc. (37.4%), Top burner areas of stoves involving fire in pans (17.9%), smoker’s materials not used in conjunction with smoking (10.3%), and candles & tapers (4.9%). See Figure 2 for the average distribution of deaths by sources of ignition over the period.
S m oker's Materials used in smoking S toves S m oker's Mat e rials not
used in smoking Candle,
Taper Oth e r So u rce s
37.4
17.9
10.3
4.9
29.5
Figure 2: Distribution of fire deaths by Sources of Ignition in Ontario
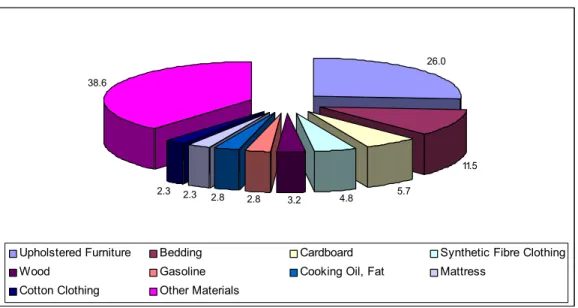
4 MATERIAL FIRST IGNITED
Nine objects first ignited caused over 60% of the residential deaths in Ontario. However, these same materials appear in only 36.8% of the fires. The most fatal first ignited object is upholstered furniture with 26% of deaths and 4.4% of fires. The second most fatal material is bedding items. They account for 11.5% of deaths and 2.4% of fires in Ontario. Figure 3 gives the average distribution of fire deaths by the first object ignited.
26.0 11.5 5.7 4.8 3.2 2.8 2.8 2.3 2.3 38.6
Upholstered Furniture Bedding Cardboard Synthetic Fibre Clothing
Wood Gasoline Cooking Oil, Fat Mattress
Cotton Clothing Other Materials
Figure 3: Distribution of fire deaths by Materials First Ignited
5 LEVEL OF ORIGIN AND TIME OF OCCURENCE
Almost all fires (88.4%) and the related deaths (96.1%) occurred between the basements and the third floors in Ontario residential homes. The ground floors are ranked first with 59.9% of the deaths and 53.9% of fires. The second floors are the second most fatal level of origin (17.3%) and are responsible for 14.6% of the fires. The basements come third in terms of deaths (14.8%), and second as to fires (16.0%). The third stories are the other significant level of origin. They account for 4.1% of the deaths and 3.9% of the fires. Only 3.9% of the deaths and 11.6% of the fires took place on the other levels. See Figure 4 for details.
The most deadly fires occurred in the early hours of the morning (between midnight and 5 am). They represent 18.0% of fires but cause 39.1% of fire deaths. With 24.1% of deaths and 18.0% of fires, the time between 6 am and 11 am is the second most deadly portion of the day. See Figure 5 for the average fire deaths by the time of day.
59.9 17.3
14.8
4.1 3.9
Ground floor 2nd Storey Basement 3rd Floor Other Level
Figure 4: Fire deaths by level of Fire Origin
39.1 24.1 15.7 21.1 Midnight to 5 am 6 am through 11 am 12 am through 17 pm 18 pm through 23 pm
Figure 5: Fire deaths by the Time of Occurrence
6 CONDITION OF CASUALTY
Fire kills many people in Ontario families. 42.9% of the deaths are women and 57.1% are men. Age appears to be a factor in these deaths as the very young and older people have less ability to react effectively to fire incidents. In fact, 24.5% of fire deaths are persons 70 years of age or older while 10.5% of them are persons under 10 years of age. Age is certainly not the only reason why fire causes so many fatalities since these 2 age groups total only 35% of fire deaths and almost 50% of the victims are between 20 and 59 years old. See Figure 6 for the age distribution of fire deaths.
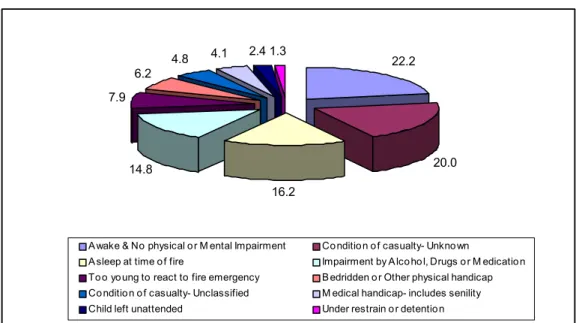
The physical condition of the victims at the time of fire seems to be another influential factor. Indeed, most of these people were unable to save themselves because of their mobility capacity. 53% of the victims suffered from some kind of physical condition. For instance, 16.2% of them were asleep at the time of fires, 14.8% were impaired by alcohol, drugs or medication, 7.9% were too young to react, 6.2% were the bedridden, etc. Even though 22.2% of the deaths were normal people and awake at the time of the fire, the physical conditions of the victims better explain why fire is so deadly in Ontario. See Figure 7 for a graphical representation of conditions of casualties in Ontario.
under 10 10 t o 19 2 0 to 2 9 30 t o 39 40 t o 49 50 t o 59 6 0 to 6 9 70+ 10.5 5.2 7.9 14.5 13.8 12.4 11.2 24.5
Figure 6: Average Fire Deaths in Ontario by Victims’ Age
22.2 20.0 16.2 14.8 7.9 6.2 4.8 4.1 2.4 1.3
A wake & No physical o r M ental Impairment Co nditio n o f casualty- Unkno wn
A sleep at time o f fire Impairment by A lco ho l, Drugs o r M edicatio n To o yo ung to react to fire emergency B edridden o r Other physical handicap Co nditio n o f casualty- Unclassified M edical handicap- includes senility Child left unattended Under restrain o r detentio n
Figure 7: Average Residential fire Deaths by Condition of Casualty in Ontario
7 CONCLUSION
Based on the Ontario data for the period 1995-2003, residential fires usually occurred in the kitchen and cooking areas. However, fatal fires are more frequent in living rooms and are caused in general by smoker’s materials such as cigarettes, cigars, matches, lighters, etc. used in conjunction with smoking. When deadly fire breaks out, upholstered furniture is the first material to be ignited most of the time. The most probable levels for deadly fires to occur in Ontario houses are the ground floors, the second stories, the basements, and the third floors. An insignificant number of deadly fires took place in other levels of the houses. Fire kills because partly the victims are either too young or too old to react quickly and effectively to a fire emergency. However, their physical conditions at the time of the fire are a more plausible explanation for their death.
8 ACKNOWLEDGEMENT
The authors would like to thank Alison Wilson of the Ontario Fire Marshal’s Office for providing the fire statistics.
REFERENCES
1. A. Bounagui, N. Bénichou, V. Ederne, Analysis of Fire Statistics in Canada 1986-2000, Institute for Research in Construction, Research Report# 172, 2004 (it is in press).
2. Wilson, Alison, 1995 to 2003 fire statistic report Ontario Residential fire fatality by decade, Ontario Fire Marshal’s Office, private communication to the authors.
3. Wilson, Alison, 1995 to 2003 fire statistic report Ontario Residential Structure fires by hour of day, Ontario Fire Marshal’s Office, private communication to the authors.
4. Wilson, Alison, 1995 to 2003 fire statistic report Ontario Residential Structure fires by ignition source, Ontario Fire Marshal’s Office, private communication to the authors.
5. Wilson, Alison, 1995 to 2003 fire statistic report Ontario Residential Structure fires by level of origin, Ontario Fire Marshal’s Office, private communication to the authors.
6. Wilson, Alison, 1995 to 2003 fire statistic report Ontario Residential Structure fires by month, Ontario Fire Marshal’s Office, private communication to the authors.
7. Wilson, Alison, 1995 to 2003 fire statistic report Ontario Residential Structure fires by object first ignited, Ontario Fire Marshal’s Office, private communication to the authors.
8. Wilson, Alison, 1995 to 2003 fire statistic report Ontario Residential Structure fires by possible cause, Ontario Fire Marshal’s Office, private communication to the authors.
9. Wilson, Alison, 1995 to 2003 fire statistic report Ontario Residential Structure fires by property type, Ontario Fire Marshal’s Office, private communication to the authors.
10. Wilson, Alison, 1995 to 2003 fire statistic report Ontario Residential civilian injuries age – decade, Ontario Fire Marshal’s Office, private communication to the authors.
11. Wilson, Alison, 1995 to 2003 fire statistic report Ontario Residential civilian injuries condition of victim, Ontario Fire Marshal’s Office, private communication to the authors.
12. Wilson, Alison, 1995 to 2003 fire statistic report Ontario Residential fire fatalities by condition, Ontario Fire Marshal’s Office, private communication to the authors.
13. Wilson, Alison, 1995 to 2003 fire statistic report Ontario Residential fire fatalities by gender, Ontario Fire Marshal’s Office, private communication to the authors.
14. Wilson, Alison, 1995 to 2003 fire statistic report Ontario Residential Structure fires by area of origin