Automation of Drosophila Gene Expression Pattern Image Annotation: Development of Web-based Image Annotation Tool and Application of Machine
Learning Methods
by MASs
Anna Maria E. Ayuso
S.B., Electrical Engineering and Computer Science
Massachusetts Institute of Technology, 2007
A
Submitted to the Department of Electrical Engineering and Computer Sciencein Partial Fulfillment of the Requirements for the Degree of
Master of Engineering in Electrical Engineering and Computer Science at the
Massachusetts Institute of Technology June 2011
©2011 Massachusetts Institute of Technology. All rights reserved.
Author:
Certified by:
Accepted by:
,U
Department of Electrical Engineering and Computer Science May 20, 2011
Kellis, Ph.D Associate Professor of Computer Science Thesis Supervisor May 20, 2011
Dr. Christopher J. Terman Chairman, Masters of EngineeringThesis Committee
ACHUSETTS INSTITUTE
)F TECHNOLOGY
UN
2 1 2011
IBRARIES
RCHIVESAutomation of Drosophila Gene Expression Pattern Image Annotation:
Development of Web-based Image Annotation Tool and Application of Machine
Learning Methods
by
Anna Maria E. Ayuso
Submitted to the Department of Electrical Engineering and Computer Science on May 20, 2011 in Partial Fulfillment of the Requirements for the Degree of
Master of Engineering in Electrical Engineering and Computer Science
ABSTRACT
Large-scale in situ hybridization screens are providing an abundance of spatio-temporal patterns of gene expression data that is valuable for understanding the mechanisms of gene regulation. Drosophila gene expression pattern images have been generated by the Berkeley Drosophila Genome Project (BDGP) for over 7,000 genes in over 90,000 digital images. These images are currently hand curated by field experts with developmental and anatomical terms based on the stained regions. These annotations enable the integration of spatial expression patterns with other genomic data sets that link regulators with their downstream targets. However, the manual curation has become a bottleneck in the process of analyzing the rapidly generated data therefore it is necessary to explore computational methods for the curation of gene expression pattern images. This thesis addresses improving the manual annotation process with a web-based image annotation tool and also enabling automation of the process using machine learning methods. First, a tool called LabelLife was developed to provide a systematic and flexible way of annotating images, groups of images, and shapes within images using terms from a controlled vocabulary. Second, machine learning methods for automatically predicting vocabulary terms for a given image based on image feature data were explored and implemented. The results of the applied machine learning methods are promising in terms of predictive ability, which has the potential to simplify and expedite the curation process hence increasing the rate that biologically
significant data can be evaluated and new insights can be gained.
Thesis Supervisor: Manolis Kellis
Acknowledgements
Acknowledgements
First and foremost, I profusely thank my thesis advisor Professor Manolis Kellis. It was around a year ago that I came out of left field from a job in the printing industry with no formal Biology background and Manolis agreed to take a chance on me and allow me the opportunity to work on such an exciting project. I am forever grateful. The Kellis lab has been a very fun and exciting place to work - full of many diverse people and interests. The melding of Computer Science and Biology is such a fascinating and quickly growing field and Manolis has been an enthusiastic and staunch advocate for its growth. There is no doubt many more revolutionary findings will come as a result of his enthusiasm, hard work, and incredible smarts. Manolis, thank you so much for the insights, enthusiasm, and guidance. I have been very privileged to work in your lab. Also, thank you for providing the financial support to make this project possible.
To Chris Bristow and Charlie Frogner, thank you both immensely for the guidance, support, and patience throughout this project. Chris, you were always there to help whenever I had any questions and I appreciate the energy you put into helping me understand background Biology concepts, past research in the field, Machine Learning methods, and so on. Charlie, you've also always been there for help and support. Your Machine Learning code was beautifully written and so helpful with this project and your exceptional project management skills really helped keep progress going and build out a LabelLife development team. I've learned so much from both of you over the past year. You both are very impressive people and I'm so appreciative that I had the honor to work with you. Thank you again.
To the Berkeley Drosophila Genome Project (BDGP), this project wouldn't have been possible without data generated from your project.
To members of the MIT Computational Biology Laboratory, I feel honored to have been able to work in the same lab as all of you. You all are insanely smart people with many accomplishments under your belts. Thank you so much for all of the feedback on this project at the group lab meetings. All of it was so helpful in driving the direction of this project.
To the contributors of LabelLife and this project's motivation, Stanislav Nikolov, Olivier Chatot, Bradley Wu, and Jennifer Wang, it's been a pleasure working with all of you. Thanks for all of your effort and insights into further improving LabelLife. I've been so impressed with how quickly you all have been able to jump in and make immediate impact. It's been great working with all of you.
To the LabelMe team, specifically Antonio Torralba and Bryan Russell, thank you for writing an inspiring tool. I was privileged to have the opportunity to work with you both back in 2007 on LabelMe on an enjoyable Senior project. It's been incredibly fun the second time around working with the successful concept of a website that you all made and making it relevant for a Biological problem. Thanks for allowing us to extend your brain child for new and exciting purposes.
Acknowledgements
career path. You met with me before I returned to school to offer guidance and support. I wasn't enrolled in school or an official advisee of yours, but you took time out of your busy schedule to help me and I am so grateful. I fondly remember the quick ChIP-sequencing lesson you gave me in your office before I went off to find a research group. Thank you again for everything.
To Ed Keisling, thank you for being my first real mentor. I count my lucky stars that I was able to start out my career at a place like Pegasystems with a boss like you. You were always encouraging and supportive, and you didn't seem to mind that I really didn't know what I was doing as a college sophomore. Thank you for taking the chance on me and encouraging my professional growth. I really look up to you and I'm so grateful for the opportunity I had to work with you and the stellar teams that you've run.
To my previous colleagues at Vistaprint Inc, thank you for developing me as a Software Engineer. I took the grueling Software Development classes at MIT, but nothing compared to immersion in the software systems at Vistaprint. (There's no better way to learn how to write robust code than to get calls at 3am from the production plants about software going horribly wrong.) It was truly an honor to work with such smart and creative people on fun problems. You all taught me so much about many different things and I can't thank you enough. You all not only helped me grow professionally, but also as an individual. It was sad to leave, but the encouragement and support was amazing and I not only miss you as colleagues, but as friends. I couldn't have asked for a better place to work right out of college. I'd like to thank you each as individuals, but that would take pages and pages. It suffices to say that you've all had a profound and lasting affect on me and I hold you all near and dear to my heart. Thank you again for an amazing experience and many learning opportunities.
To my former MIT field hockey and lacrosse coach, Cheryl Silva, thank you so much for everything. You helped develop me as an athlete and a person. I feel so privileged to have had a coach like you. Thank you for four great years of varsity athletics and thank you for allowing me the opportunity to help serve as an assistant coach this past year. Your words of wisdom "be part of something bigger than yourself' have stuck with me not only in athletics but in my career and everyday life. Thank you for everything. I look up to you in so many ways.
To my beloved cats, Pooh and Moo Moo. You both have turned me into a crazy cat lady. Thanks for offering your stress relief services and funny cat antics. I've also really enjoyed our long, late night conversations. (Kidding!) Thanks for holding on for me Pooh even though the odds have been against you with your brain tumors. You are the miracle cat (that is on a lot of miracle drugs). I couldn't have asked for better pets.
To Karin, who has been a second Mom to me. Thank you for the emotional support this past year. I relate to you on so many different levels and I appreciate how you've been there for me through the ups and downs of life. Just like you staked claim on Lorine, I told Brad that I staked claim on you. Thanks for everything.
To my boyfriend, life partner, little spoon, and man friend, Brad. I'm not so sure I would have had the guts to leave my cushy, engaging job in industry to pursue a personal interest if it weren't for your support and encouragement. It was the best decision ever and I'm so appreciative to you for
Acknowledgements
helping me get here. I feel very lucky to have you in my life. You've stood by my side in good and bad and I can't thank you enough. I love you very much. I can't wait for the next exciting chapter of life with you.
To my mother, Kaye. Thank you for everything Mom. You've always been there for me and I can't thank you enough. You're a great example of how to keep on fighting through adversity and I look up to you. Thank you for all of the sacrifices you made for me to get me where I am in life. I love you very much.
To my dearest little sister, Kaity. Even though you are my little sister, I truly look up to you in so many ways. You are an amazing (and sassy) woman and I am so lucky to have you for a sister and best friend. The way you carry yourself really inspires me. You are definitely the rock in our family. This has been a tremendous few years full of curve balls and you have been there for me every step of the way. Thank you so much for your emotional support and encouragement. You always know how to brighten my day and make me laugh. I really wouldn't be where I am without you. I love you so much Luscious.
Finally, to my courageous little brother, Matt, to you this thesis is dedicated. Matt, you are truly a very inspiring guy. Despite your physical and mental handicap, you go about life with such poise and optimism. Our family has truly been blessed that you are who you are and we've all learned so much from you. Over the years, you've taught me so much- compassion for others, resilience, facing adversity, and so on. You have inspired me to want to help others like you because you are such an amazing person. Your condition is why I've always been fascinated by genetics and it's because of you that I am where I am today. Thank you for teaching me so many life lessons little brother. You are a blessing. "Matt, I love you, call me."
Table of Contents
Table of Contents
Table of Figures...10
Table of Tables...12
List of A cronym s/Definitions ... 13
1 Introduction... 14
1 Introduction ... 14
1.1 M otivation and Objective...14
1.2 Organization...16
2 Background and Previous W ork... 18
2.1 Drosophila m elanogaster ... 18
2.2 The Berkeley Drosophila Genom e Project... 19
2.3 Automated Morphological Term Prediction For Gene Expression Image Pattern Data...21
2.4 LabelM e...30
2.5 Thesis Contribution ... 31
3 LabelLife: A W eb-based Im age A nnotation Tool... 32
3.1 Overview ... 32
3.2 Software Requirem ents...33
3.3 D esign and Im plem entation... 37
3.3.1 D ata M odel...39
3.3.2 System A rchitecture...41
3.3.3 U ser Interface...46
3.4 U se Cases...50
3.5 Ongoing W ork...52
3.5.1 Integrating predictions into U ... 52
3.5.2 UI Aesthetic Im provem ent... 52
3.5.3 Data Download and Analysis Tools... 53
3.5.4 M echanical Turk...53
3.5.5 Search Functionality...54
3.5.6 Video...55
3.6 Other U ses For LabelLife... 55
3.7 Sum m ary...57
4 Machine Learning Methods For Morphological Term Prediction...58
4.1 Overview ... 58
4.2 Feature Extraction...59
4.3 Machine Learning Methods To Predict Morphological Terms For Gene Expression Pattern Im ages...61
4.3.1 Regularized Least Squares Regression (R S)... 61
4.3.2 Support Vector M achine (SV M )... 63
4.3.3 M ethods of Evaluating Results... 64
4.4 D ata U sed For Prediction Problem ... 66
4.4.1 D . m elanogaster Em bryo D evelopm ent Stage 4 To 6... 66
4.4.2 D . m elanogaster Em bryo D evelopm ent Stage 7 To 8... 68
4.5 Experiments: Application of Machine Learning Methods To Predict Morphological Terms For Gene Expression Pattern Im ages ... 69
Table of Contents
4.5.1 D . m elanogaster Embryo Developm ent Stage 4 To 6... 71
4.5.2 D . m elanogaster Em bryo Developm ent Stage 7 To 8... 72
4.6 Results...72
4.6.1 D . m elanogaster Embryo Developm ent Stage 4 To 6... 73
4.6.2 D . m elanogaster Embryo Developm ent Stage 7 To 8... 75
4.7 Discussion...77
4.7.1 Results...77
4.7.2 Future W ork...78
5 Conclusion...80
6 Appendix...82
6.1 Controlled Vocabulary Terms... 82
6.2 BDGP Data Breakdown...85
Table of Figures
Table of Figures
Figure 1: Example data from the BDGP database for the twi gene in Drosophila [14]...14
Figure 2: A Drosophila embryo stain pattern image generated from in situ hybridization...14
Figure 3: Adult Drosophila melanogaster [17]...18
Figure 4: A D.melanogaster embryo expressing Gene CG1 3333 at different development stages...19
Figure 5: Development of midline glia through time [18]...20
Figure 6: Common pipeline applied to the problem of predicting morphological terms for gene expression pattern im ages...21
Figure 7: Misclassified "Yolk Nuclei" gene expression pattern images...22
Figure 8: The way that the relationship of gene expression pattern image to controlled vocabulary term mapping is maintained in the BDGP process. Not all vocabulary terms apply to all images... 23
Figure 9: LabelMe online annotation tool...31
Figure 10: LabelLife web-based annotation tool... 33
Figure 11: Screenshot of LabelLife demonstrating the three different levels that controlled vocabulary terms can be applied to: ImageSets, Images, and ImagePolygons ... 35
Figure 12: Screenshot of LabelLife demonstrating the concept of ImageSets...35
Figure 13: Screenshot of LabelLife demonstrating the concept of Metadata... 36
Figure 14: Screenshot of LabelLife demonstrating the concept of Controlled Vocabulary. ... 37
Figure 15: Screenshot of LabelLife labeling stage. One to many controlled vocabulary terms are required to com plete the polygon. ... 37
Figure 16: Screenshot of LabelMe labeling stage. A free-form text label is required to complete the poly gon . ... 37
Figure 17: LabelLife data m odel...40
Figure 18: Screenshot of LabelLife demonstrating where the data model objects apply in the user interface. ... 4 1 Figure 19: LabelLife Software Architecture ... 43
Figure 20: File system storage layout... 46
Figure 21: LabelLife user interface... 48
Table of Figures
Figure 23: LabelLife UtI Component: Image Metadata pane ... 49
Figure 24: LabelLife UI Component: Main Image pane ... 49
Figure 25: LabelLife UI Component: ImageSet pane ... 50
Figure 26: LabelLife UI Component: VocabularyTerm pane ... 50
Figure 27: Screenshot of LabelLife expanded ImageSet view. This is useful for viewing large Im ageS ets. ... 5 1 Figure 28: Screenshot of LabelLife Image/Image Set Labeling View. The terms selected will be applied to the ImageSet as a whole. It can be seen that "dorsal ectoderm anlage in statu nascendi" and "ventral ectoderm anlage in statu nascendi" are already applied to this ImageSet...52
Figure 29: Screenshot of LabelLife ImagePolygon Labeling View. The terms selected will be applied to the highlighted polygon in the Image. ... 52
Figure 30: LabelLife Redesign. Image courtesy of Bradley Wu, an MIT undergraduate working on UI im provem ent...53
Figure 31: A potential use for LabelLife could be labeling soft tissues in MRI brain scans...56
Figure 32: A potential use for LabelLife could be labeling store fronts in GoogleMaps ... 57
Figure 33: Feature Representation of gene expression pattern image. The embryo is converted to a binarized image indicating the presence/absence of a feature...60
Figure 34: Example of an embryo gene expression pattern image run through image processing....61
Figure 35: Illustration of area under the curve. ... 65
Figure 36: Zscore for all Stage 4 to 6 terms found in the data set sorted in descending order of frequency. Red color indicates positive feature detection and blue color indicates negative feature detection across all relevant embryo images for a term...68
Figure 37: Effect of cleaning labels with LabelLife. The first row corresponds to the Zscore profile of the terms before cleaning. The second row corresponds to the Zscore profile of the same terms after cleaning. It can be seen that cleaning the data through LabelLife produces more striking features for classification . ... 72
Table of Tables
Table of Tables
Table 1: Stage 4 To 6 Morphological Term Breakdown...67
Table 2: Stage 7 To 8 Morphological Term Breakdown...69
Table 3: Change in number of positive labels before and after curating data in LabelLife...71
Table 4: AUC Per Gene, Stage 4-6, Pixel feature data, RLS classification w/Linear Kernel...73
Table 5: AUC Per Image, Stage 4-6, Pixel feature data, RLS classification w/Linear Kernel...74
Table 6: AUC Per Image, Stage 4-6, Pixel feature data, RLS classification w/Gaussian Kernel...75
Table 7: AUC Per Image, Stage 4-6, Pixel feature data before and after cleaning in LabelLife, RLS classification w/Linear K ernel...75
Table 8: AUC Per Image, Stage 4-6, Pixel feature data before and after cleaning in LabelLife, RLS classification w /G aussian K ernel...75
Table 9: AUC Per Image, Stage 7-8, Pixel feature data, RLS classification w/Linear Kernel...76
Table 10: AUC Per Gene, Stage 7-8, Pixel feature data, RLS classification w/Linear Kernel...76
Table 11: AUC Per Image, Stage 7-8, Pixel feature data, RLS classification w/Gaussian Kernel...77
List of Acronyms/Definitions
List of Acronyms/Definitions
AUC Area Under the Curve
BDGP Berkeley Drosophila Genome Project
FPR False Positive Rate
HTML Hypertext Markup Language
ISH In situ hybridization
LOOCV Leave One Out Cross Validation
ML Machine Learning
RLS Regularized Least Squares
ROC Receiver Operating Characteristic
SQL Structured Query Language
SVM Support Vector Machine
TPR True Positive Rate
UI User Interface
1 Introduction
1
Introduction
1.1 Motivation and Objective
Precise control of spatial and temporal patterns of gene expression is required for tissue and organ development. Genes expressed in similar patterns are often co-regulated and grouping genes based on shared expression patterns has been invaluable in determining gene regulatory mechanisms. Large-scale biological methods for evaluating gene expression are providing an abundance of valuable information to researchers. One technique for profiling spatial patterns of gene expression is RNA in
situ hybridization (ISH) in which a labeled complementary nucleotide probe is hybridized to a fixed
tissue sample and visualized using microscopy (Figure 1). This technique generates valuable spatial information and temporal staging can be inferred by the tissue
morphology. Large-scale ISH screens have been carried out in a range of model organisms allowing for the profiling of thousands of genes. These screens generate tens of thousands of images making
computational methods a necessity to quickly process and understand Figure 1 A Drosophila embryostain pattern image generated
from in situ hybridization
the results.
The Berkeley Drosophila Genome Project (BDGP) is an effort to provide gene expression data for all Drosophila melanogaster (fruit fly) genes across embryonic development to researchers. Currently the group has examined 7,153 genes that are documented with 97,882 digital images and the data is continuously growing [14]. Information is summarized using manual annotations completed by field experts that link images to controlled vocabularies of anatomical and developmental ontology terms (Figure 2) and this allows for the integration of spatial patterns with additional genomic datasets.
1 Introduction
Figure 2: Example data from the BDGP database for the twi gene in Drosophila [14].
However manual curation is labor intensive and prone to errors. Several research groups have used this data and applied computational methods in an effort to predict anatomical and developmental terms based on the image data [1-13]. There are common challenges that each group has run into. One major challenge that affects the performance of term prediction algorithms is the fact that annotators currently apply multiple terms to images or sets of images instead of image features [2,4]. Term prediction algorithms have to compensate for loss of information in what feature in an image an annotator intended a term to apply to since terms are assigned in groups to groups of images. While some groups have had success in using image processing and machine learning methods to predict terms, even greater success is possible by enhancing the available data with a linkage between terms and their location within images. An existing web-based image annotation tool called LabelMe provides a foundation for accomplishing such goals.
LabelMe is a tool developed by the MIT Computer Science and Artificial Intelligence Laboratory (CSAIL) that is used by the computer vision community for annotating objects in real
1 Introduction
world photographs of various scenes [15,16]. The data can then be used in object recognition algorithms that take into account shape and location information. This application is directly relevant to the problem of assigning terms to stained gene expression patterns. The same concept of outlining stained regions with polygons and linking those polygons with terms can be applied to enhance the results of term prediction algorithms. However, the current system is not designed to manage large sets of biological images and there are domain specific concepts that need to be integrated. For example, in biological experiments, it is critical to track details of what reagents were used and when the experiment was carried out as there are often substantial batch effects that can confound the results. Furthermore, controlled vocabulary terms are essential to standardize the results and enable comparison across genes.
This thesis combines the previously mentioned concepts to address the meta-problem of analyzing a rapidly growing gene expression pattern data set to infer insights into gene regulation. The first objective of this thesis is the development of a web-based image annotation tool called LabelLife to provide a systematic and flexible software solution for annotating images, groups of images, and shapes within images using terms from a controlled vocabulary. The second objective of this thesis is the application of machine learning methods for automatically predicting vocabulary terms for a given image based on image feature data.
1.2 Organization
This thesis is organized into several sections. Chapter 2 provides background information on relevant concepts that are referred to in this thesis. This section also surveys existing literature on the problem of automatically predicting terms for gene expression pattern images and examines LabelMe, from which the web-based annotation tool written for this thesis draws much inspiration. Chapter 3
1 Introduction
introduces the first contribution of this thesis, LabelLife. The design and motivation behind the new web-based annotation tool and its relevance to the problem of annotation of gene expression pattern images is described in detail. Chapter 4 describes the machine learning methods used to predict controlled vocabulary terms for gene expression pattern image data. Background information on the methods is provided and the details of the experiments are laid out. Finally, results are presented and analyzed. Chapter 5 wraps up the two main contributions of this thesis with a discussion and conclusion.
2 Background and Previous Work
2 Background and Previous Work
This section provides an overview on concepts touched upon by the work of this thesis. The following subsections provide more detail on Drosophila melanogaster, the Berkeley Drosophila Genome Project, previous work in automated annotation term prediction, and LabelMe, a web-based image annotation tool.
2.1 Drosophila melanogaster
The Drosophila melanogaster (Figure 3), a species of the fruit fly genus, is one of the most widely studied organisms in genetics. The focus on this species started in 1909 when Thomas Hunt Morgan of Columbia University began using the fruit fly to study the laws of Mendelian Inheritance [22]. The fruit fly was chosen for it's fast reproduction rate and small size. Many insights were gained from Morgan's experiments about genetics by crossing flies of known phenotypes. It was not until 2000 that the whole genome of the Drosophila melanogaster was sequenced [28]. The 100 or so years in between have brought many discoveries as to the underlying biological mechanisms involved in genetics. Even though we know so much more today about the role that genetics plays in our lives, fruit flies are still widely studied because of the similarity of their DNA to humans [24] and also the speed at which
Figure 3: Adult Drosophila experiments can be carried out. melanogaster [17]
Another aspect of fruit flies that is widely studied today is embryogenesis. Embryogenesis is the process of formation and development of an embryo. Tracking the development of the fly as an embryo allows for insights into the process of gene regulation. Modem science has conquered the
2 Background and Previous Work
hurdle of determining what DNA is present in a genome. Now, researchers are trying to better understand the complex signaling system that drives expression of this DNA. Applying in situ
hybridization to known genes in fruit flies has allowed for the visualization of localized gene expression. Repeating this process at different developmental time points on a gene-by-gene basis yields spatio-temporal information that helps paint a more complete picture of gene expression as time progresses. Figure 4 illustrates this concept for a D. melanogaster embryo expressing the CG13333 gene across five development stages. The localization of the expression changes as embryogenesis progresses. One can also observe the detail introduced as the embryo develops.
Gene: CG13333
Stage 1-3 4-6 9-10 11-12 13-16
Figure 4: A D.melanogaster embryo expressing Gene CG13333 at different development stages.
2.2 The Berkeley Drosophila Genome Project
The Berkeley Drosophila Genome Project (BDGP) is an effort to provide a thorough and high quality collection of Drosophila melanogaster genomic data. One output of this effort is an abundance
in situ hybridization gene expression pattern data for all Drosophila melanogaster (fruit fly) genes
across embryonic development.
To generate this data, labeled RNA probes for each gene are hybridized to embryo tissue through in situ hybridization. In situ hybridization is the process of hybridizing a complementary
2 Background and Previous Work
nucleotide probe to a specific DNA or RNA sequence of interest in a tissue and visualizing the result with microscopy. The resultant stained embryo undergoes a quality control process. If the process goes smoothly, image acquisition is carried out to capture the result. Multiple high-resolution microscopic digital photographs are taken to capture several focal planes of the 3D embryo. The pictures are taken to capture the lateral, dorsal, and ventral views of the embryo with the anterior end aligned to the left and the posterior end aligned to the right. This process is repeated for all combinations of genes and development stages [13]. Embryogenesis is divided into set of development stages characterized by expected morphological markers. The BDGP subdivided these stages into 6 stage ranges (1-3, 4-6, 7-8, 9-10, 11-12, 13-16) that account for stage transitions with the largest noticeable affect on gene expression. It can be noted from the data that more intricate, complex stain patterns appear towards the later stages.
Once the images are settled upon for a gene/stage range combination, a human annotator manually assigns terms from a controlled vocabulary to indicate anatomical and developmental intermediaries present in the stain
anlage cmlage a primordiun diferentiated pattern of the embryo. The l statu nascendi organ
controlled
vocabulary
was
Tracing back single-minded
designed to account for the fact stage stage stage stage
4-6 9-1 13-16
that embryonic structures might not be completely developed at a certain stage range with terms that
mesectomesectoderm le nidline glia
indicate a development path. The a an lage primordiwn terms "anlage in statu nascendi," Figure 5: Development of midline glia through time [18]
"anlage," "primordium," and "organ" are appended to the fully developed term name to indicate 20
2 Background and Previous Work
development stage. Figure 5 demonstrates the development of the midline glia through time. One can observe the terms that indicate developmental intermediaries in the early stages. There is a hierarchal structure to the terms that form a directed acyclic graph. See Appendix 6.1 for the currently used terms. These terms are assigned as a group to the whole group of images by the expert curator.
Currently there are only a handful of expert human annotators working on the set. The project has processed over 7,000 of the known fly genes. The BDGP had two large spikes in the release of annotation data in 2007 and 2010. Since these spikes, the group aims to consistently deliver data for around 90 genes per month. The BDGP has implemented database and software changes to facilitate this flow of data to the public [14].
The BDGP makes all of its data publicly available through their website and they provide a web-based interface for searching existing image data and annotations. The website can be found at
http://www.fruitfly.org/index.html.
2.3 Automated Morphological Term Prediction For Gene Expression Image
Pattern Data
Various research groups have made attempts at automatically predicting annotation terms from gene expression pattern data generated by BDGP using computational methods. There is a common data analysis pipeline that is
Labels applied to this problem as
illustrated in Figure 6. First, Image Feature Machine
Pmcessing Extraction Learning Model image processing is performed on
Figure 6: Common pipeline applied to the problem of predicting
the raw gene expression pattern morphological terms for gene expression pattern images 21
2 Background and Previous Work
images to register embryos and threshold for stain intensity. Second, a method of feature extraction is used to generate data input for machine learning methods. Third, a machine learning method is performed on the input data with various parameters set to generate a predictive model. Fourth, unclassified images are run through the model and predictive ability is assessed using various metrics.
There are several common difficulties and considerations in carrying out this task that have been collectively noted by researchers who have worked on this problem before [1-13].
Groups of terms are assigned to groups of images
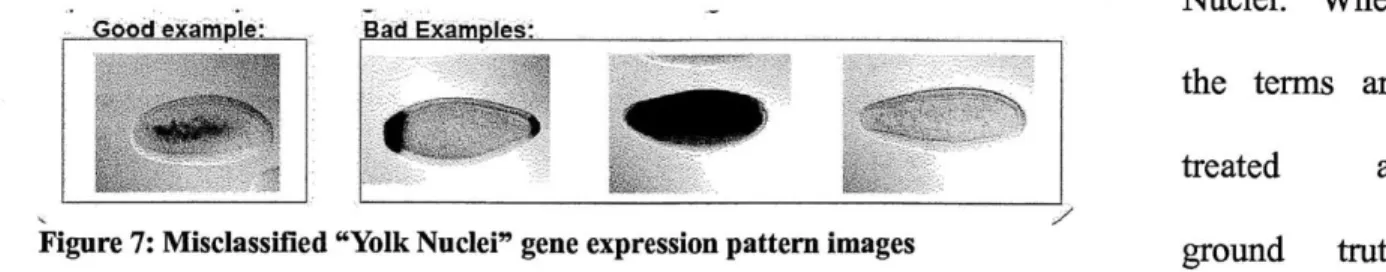
This is the top most cited issue that has made automatic prediction of terms a difficult problem. Expert curators go through the images manually and combine their knowledge with what they see in the expression pattern images, microarray expression data, and published research to accurately assign one to many vocabulary terms to a set of images representing one development stage for a gene. One of those terms might have been meant for a pattern that shows up visibly well in one image out of that group but not the rest. The way the data is maintained, this information is lost and the term is associated to the whole set of images. Figure 7 illustrates this example for the Yolk Nuclei morphological term. The "good example" on the left shows how a Yolk Nuclei manifests in a gene expression pattern image. The "bad examples" on the right show other images which incorrectly receive the label of having a Yolk Nuclei. When
_Good examoIe:. Bad Examples:.
the terms are
treated as
Figure 7: Misclassified "Yolk Nuclei" gene expression pattern images ground truth labels in machine learning methods, one has to be careful to determine which terms are actually
2 Background and Previous Work
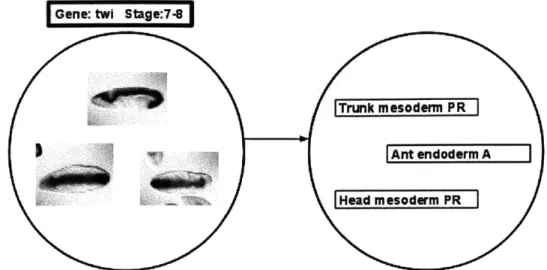
relevant. Figure 8 further illustrates this data relationship.
Gene: twi St:7
Tfrunk miesoder
16k"Head mesodermP
Figure 8: The way that the relationship of gene expression pattern image to controlled vocabulary term mapping is maintained in the BDGP process. Not all vocabulary terms apply to all images.
- Multiple images per embryo/gene
There are multiple images generated per gene/development stage. This is due to that fact that embryos are 3D objects and multiple pictures are necessary to capture enough focal planes to paint a complete picture. Lateral, dorsal, and ventral views are taken with the anterior end aligned to the left. An issue that arises from this aspect of the data is that some embryonic structures might be visible from one view but not another. Machine learning methods need to be able to account for these different views somehow and compare apples to apples.
- Multiple developmental stages
Similar to the problem of having multiple images per gene/development stage combination, there are multiple development stages. When looking at predicting terms for one gene, there will be several developmental stages to take into account. These need to be treated carefully because the terms in one stage generally do not show up in other stages. The controlled
2 Background and Previous Work
vocabulary was carefully crafted to account for developmental intermediaries of embryonic structures. Also, as the embryo develops, it becomes more defined and later stage embryos look vastly different than early stage embryos.
- Embryos develop non-deterministically
This is lesser of a problem but still worth mentioning. Drosophila embryogenesis is broken down into discrete development stage ranges where certain morphological markers are expected. While most embryos roughly adhere to this expected process, embryogenesis is a non-deterministic process and there is a chance that certain structures might appear sooner or
later than expected given the stage range. - Image data has high dimensionality
When carrying out machine learning to predict terms, it is necessary to generate feature data as an input to the algorithm. Using the raw image data itself yields feature data that has high
dimensionality where the number of dimensions equals the number of pixels. Certain machine learning methods do not perform well with feature data that has this quality and so care must be taken to choose the right method for the input feature data. Attempts can be made to reduce the dimensionality of the data through a transformed representation, but care must be taken to ensure that classification still yields biologically significant results.
- Term data is sparse
Given all of the genes available in the database, controlled vocabulary terms are assigned at low frequencies as compared to the whole data set. This yields sparse term associations and data skew. Whether a term is assigned or not is treated as the label in machine learning methods. Having ground truth data that is sparse could yield less-than-ideal results if this fact is not taken
2 Background and Previous Work
into account. Often adding weights to the term classes to offset the skew in data is the most common way of remedying the problem.
Various groups have been working on developing automated pipelines for classifying gene expression pattern images since the early 2000s. There are a number of different feature representations as well as a number of different machine learning methods that could be applied to this problem. The groups that have investigated this topic have investigated a particular combination or a few combinations to evaluate predictive ability.
Choosing the best feature representation was a focus of the early research related to this problem. The focus of the problem evolved into predicting labels for gene expression pattern images after image search based on well-defined features was understood. Kumar et al. (2002) [7] began this effort in 2002. This group built a basic expression search tool called BEST to retrieve the best matching gene expression pattern images given an input gene expression pattern image. The group executed their software against 982 gene expression pattern images that were extracted from existing literature, since the BDGP was still in its infancy and these images were not readily available in 2002. The images were standardized by converting to a common dimension and maximizing the enclosed embryo to the boundaries. Stain patterns were extracted using an adaptive thresholding algorithm and the resulting images were stored as binary data where 1 indicated the presence of a feature and 0 indicated the absence of a feature. A distance metric was used to compare input gene expression patterns against ones stored in the database. The goal was to minimize the number of bit differences divided by the number of bits indicating features in one of the images. The result of a search displayed a list of images from the database and the percentage match achieved. This was the early work that inspired other groups to work towards automation and it laid out necessary preprocessing steps to
2 Background and Previous Work
achieve this goal. This work also provided researchers a way to visually search new expression patterns quickly.
Gurunathan et al (2004) [6] continued research on the best feature representation of gene expression pattern image data by comparing the Binary Feature Vector (BVF) and Invariant Moment Vector (IMV) feature representations. BVFs represent features as l's and O's where a 1 indicates that a feature is present. This is how images were represented in the BEST tool. IMV was tested as a viable substitute because this method was proven to work well in compensating for variations in scale, translation, and rotation. This group used 262 gene expression pattern images extracted from research papers. All of the embryos were between stages 1-8 and laterally aligned. The results indicated that while the IMV feature representation produced faster retrieval speeds, BVF still provided the most biologically meaningful matches.
The quest for the best feature representation was continued 5 years later in 2009 by Frise et al (2009) [9]. This group created a new feature representation of the Drosophila embryo in the form of an elliptical mesh grid. The group focused on stage range 4-6. They used this new representation to cluster images with similar expression patterns. The clusters that were learned were determined to be biologically relevant based on previous research.
Along the evolution of using the BDGP data for predicting morphological terms for gene expression pattern images, several groups used the data to learn different things, such as gene coexpression and development stage. In 2006, Ye et al [5] attempted to go beyond searching on pattern similarity and set up a system to classify which development stage range a gene expression pattern image belonged to. The group used Gabor filters and Histogram Equalization to extract features from pixel neighborhoods in the images. These features were then run through an implementation of Linear Discriminant Analysis (LDA) to extract the most relevant features and thus
2 Background and Previous Work
reduce the dimensionality of the data. Finally, these most relevant features were classified using both the Nearest Neighbor (NN) clustering algorithm and Support Vector Machines (SVM). The group used
2705 expression pattern images from the early stages. The classification was run varying the training
sample size from 30 to 540. The results indicated that Nearest Neighbors and SVM were comparable in classifying developmental stage range for features generated from LDA. This group achieved accuracies that ranged from 76.55% to 88.91%.
Samsonova et al (2007) [8] focused on the problem of understanding gene coexpression by
integrating non-homogeneous data sets. This group used both microarray and gene expression pattern image data in an attempt at predicting the spatial localization of gene expression. The group developed the concept of a functional unit and manually assigned genes that were associated with a functional unit of development. The problem then became predicting which genes should be associated with a functional unit. The group developed 15 functional groups and each group would have on average a few dozen genes associated. Using SVMs for classification, this group achieved accuracies as high as
80% for some functional units. This method required extensive biological insight into the data in order
to transform the data to a new representation. Another group that investigated coexpression was Costa
et al (2007) [12]. Costa et al investigated the problem of automatically predicting clusters of similarly
expressed genes using semi-supervised machine learning methods. The raw gene expression pattern image data was used to generate pairwise constraints used in a Gaussian mixture model clustering scheme. The clusters found using the automated methods proposed by this group were determined to yield biologically meaningful clusters of related genes.
The following groups dedicated their research efforts to the problem that is laid out in this thesis. Zhou and Peng (2007) [4] were one of the early groups dedicated to the problem of automatically predicting morphological terms for gene expression pattern image. They developed a
2 Background and Previous Work
software system to carry out this recognition and classification task. First, the system would recognize which stage range the image belonged to and second, it would assign the appropriate morphological terms to that image based upon the stain pattern. Image features were extracted with a multi-resolution 2D discrete transform, followed by min-redundancy max-relevancy feature selection. Classification was carried up by implementing multiple parallel binary classification problems corresponding to each morphological term. Linear Discriminant Analysis (LDA) was used to implement the binary annotation classifier. To test the system, the group constructed two sets of features for each stage range, one containing two mutually exclusively assigned terms, and one containing two mutually inclusively assigned terms. This training setup was used to predict development stage range. The group then trained the parallel, binary classifiers on a subset of frequently occurring terms and generating probabilistic confidence scores. This approach demonstrated promising prediction results.
Peng et al (2007) [3] also contributed an automated pipeline for the problem of predicting morphological terms for gene expression pattern images. The group investigated the combination of three different feature representations; Gaussian Mixture Models (GMM), Principal Component Analysis (PCA), and wavelet functions. The goal of using all three representations was to adequately capture both local and global feature properties. The group also investigated three different classification methods; Linear Discriminant Analysis (LDA), Support Vector Machine (SVM), and Quadratic Discriminant Analysis (QDA). The results indicated that LDA consistently performed well across a small training class versus a large one. This was the most impressive result since a relatively good predictive model was achievable by using minimal data. SVM and QDA both performed well on a large training class, but not very well on a small training class. This result indicated overfitting of data.
2 Background and Previous Work
Shuiwang et al (2008) [1] also created a pipeline for the automated annotation of gene
expression patterns using controlled vocabularies. The group extracted invariant features from individual images and constructed pyramid match kernels between sets of images to measure similarity in features. The specific features used were SIFT, shape context, PCA-SIFT, spin image, steerable filters, differential invariants, complex filters, moment invariants, and cross correlation. The kernels were combined using hypergraph spectral learning to learn which features were the most important and the output of this step was used in the classification problem. Testing data on this framework involved evaluating micro Fl, macro Fl, precision and recall against combinations of 1000, 1500, and 2000 sets versus 10, 20, 30, 40, 50, and 60 controlled vocabulary terms at a time. Multiple kernel combination methods were evaluated. As the number of terms being learned increased, the evaluation metrics decreased. In terms of macro/micro F1 scores, kernels integrated by either star or clique expansions achieved the highest performance up to around .60. In terms of precision and recall, SVM and Uniform achieved the highest performance up to around .67.
Shuiwang at al (2009) [2] used a bag-of-words approach for the problem of automating annotation of gene expression pattern images. This methodology was used to exploit the relationship between terms. To generate this representation, a visual codebook for each view - lateral, dorsal, and ventral - was generated. Each image was compared to this code book and the present features are quantized. For images in a set, the codebook-determined features were considered the bag-of-words. The classification stage made use of a binary classification scheme with a low-dimensional shared subspace to capture relationships between controlled vocabulary terms. For evaluation, this classification approach is compared against SVM and Pyramid Match Kernels (PMK) for classifying
10, 20, and 30 terms at a time. The AUC achieved by the shared-subspace multi-label formulation
surpassed the other methods at .81 on stage range 4-6. This method also outperformed the other stage
2 Background and Previous Work
ranges. This work offered the most promising success rate in automatically predicting controlled vocabulary terms for gene expression pattern images.
2.4 LabelMe
LabelMe is a web-based image annotation tool developed in the MIT Computer Science and Artificial Intelligence Laboratory (CSAIL), specifically in the Computer Vision group. The tool provides an easy-to-use interface for hand-labeling objects in scenes. Figure 9 shows a screenshot of the website. The website is most commonly used to label real world scenes, but the tool could be applied to labeling any image.
Zoom Erase Help Make 3D U load -im e
The user simply points and clicks in their browser to generate polygon points around the object of interest. When the user completes the polygon, a prompt asks for a free form label to describe the polygon. This tool is widely accepted and used by the
computer vision community with Figure 9: LabelMe online annotation tool.
over 700,000 objects [15] labeled and counting in the main instance running at labelme.csail.mit.edu. Full support for the tool has been built out in several ways. First, there is a Matlab toolbox to process and analyze the data. Second, the source code is made freely available with detailed installation instructions. Third, instructions are provided on how to integrate with Amazon's Mechanical Turk to outsource the labeling process to the public. Fourth, LabelMe video has been
2 Background and Previous Work
recently introduced to also support annotating video clips.
Data generated from LabelMe has been used in computer vision algorithms by the MIT Computer Vision group to understand scenes. Analysis has been performed to understand where in a scene an object class typically lies with a certain probability. The possibilities for analysis are endless and this tool can be used in many different ways. It is well known across the Computer Science community at the MIT and several research groups have used separate instances of LabelMe to carry out various research goals. LabelLife, the web-based image annotation tool developed as part of this thesis takes much inspiration from the vision of LabelMe.
2.5 Thesis Contribution
The overall goal of this thesis was to contribute to the problem improving annotation of gene expression pattern images for D. melanogaster embryos through tools and automated machine learning methods. The first contribution was the development of a web-based image annotation tool called LabelLife which builds on the inspiration of LabelMe to provide an intuitive and easy-to-use system for annotating gene expression pattern images. The second contribution was the application of machine learning methods to automatically predict morphological terms associated to gene expression pattern images. The first contribution, LabelLife, is discussed in detail in the next section.
3 LabelLife: A Web-based Image Annotation Tool
3 LabelLife: A Web-based Image Annotation Tool
3.1 Overview
The first contribution of this thesis was the development of a web-based image annotation tool called LabelLife. Figure 10 shows a screenshot of the tool. This tool was built to address the current way that information is maintained for gene expression pattern term assignment and provide an efficient and easy-to-use interface for introducing new data linkages. As mentioned previously, the BDGP has annotated
thousands of fruit fly
genes with controlled
vocabulary terms that
indicate anatomical and d.
developmental
intermediaries. These l
j"I gPC tygon
genes are labeled as
groups of images Figure 10: LabelLife web-based annotation tool corresponding to the
gene and development stage range. One to many terms can be applied to this group of images. Granularity of detail is lost with this labeling scheme since a term that might only apply to a single image is forced to apply to the set of images. LabelLife was designed to allow for more precision in labeling and also improve the process by making it fast and efficient.
3 LabelLife: A Web-based Image Annotation Tool
3.2 Software Requirements
There were several requirements that the LabelLife tool needed to satisfy: - Easy-to-use and intuitive interface
There was already a tool for bulk annotating gene expression pattern images with controlled vocabulary terms that the BDGP uses. In order to create a tool that people would readily adopt, it was necessary to create something very easy-to-use and intuitive. The tool needed to be easy for a new user to install or access and obvious how to proceed with a task. All of the information needed to be displayed in a simple and uncluttered manner.
- Open to the public
LabelLife was meant to be embraced by the academic and research communities. In order to facilitate such adoption, it was necessary that the tool and data were both very open to all interested parties. The code needed to be open source and freely available. There also needed to be supporting tools for downloading and analyzing the data.
- Ability to apply labels to shapes within images, images themselves, and group of images
One major limitation of the current method of annotating gene expression pattern data is that detail is lost in what image or region within an image a term is meant to apply to. The tool needed to allow that detail to be captured somehow. The user needed to be able to outline a shape within an image. It was also important to capture relationships of labels at the image and image set levels as well. Figure 11 demonstrates the ability to apply controlled vocabulary labels to image polygons, images, and image sets in LabelLife.
3 LabelLife: A Web-based Image Annotation Tool
Figure 11: Screenshot of LabelLife demonstrating the three different levels that controlled vocabulary terms can be applied to: ImageSets, Images, and
ImagePolygons - Image Sets
For the problem of annotation gene expression pattern images, it was necessary to view images in sets grouped by gene and development stage. This is how they are currently labeled with terms so being able to visualize that data relationship was important. (Figure 12)
Image
Set allows
managing groups of
lImages
3 LabelLife: A Web-based Image Annotation Tool
Metadata
There is a large amount of accompanying data that is important for manual curators to have easy access to when annotating gene expression pattern images. For example, it is important to know what focal plane of the embryo is being viewed - lateral, dorsal, or ventral. It might also be important to know when the experiment was done that generated the images or where on a specific chromosome the gene in question lies. There are many various pieces of information
linked to the images that needed to be incorporated into the display. (Figure 13)
Select Trm ..led V foralabels
su ecs itern.s) .... d
Sear rtiael-f gdand caen
Metadata presents
mage user with domain
specific information about labeling task
Figure 13: Screenshot of LabelLife demonstrating the concept of Metadata.
-Controlled Vocabularies for labels
When applying a label to a polygon, image, or set of images, the user needed to be restricted to a predefined set of vocabulary terms to ensure consistent labeling. Figure 14 demonstrates how users are restricted to a controlled vocabulary in LabelLife.
3 LabelLife: A Web-based Image Annotation Tool
Coutrolled
Vocabularyli-mits
user to selectinis
one. to: many
Predefined -terms,
Figure 14: Screenshot of LabelLife demonstrating the concept of Controlled Vocabulary.
- One-to-many mapping of polygons to labels
The system needed to support the ability to apply multiple labels to a polygon, image, or set of images. Figure 15 demonstrates LabelMe's scheme for labeling polygons. A free-form text label is requested upon completion of the polygon. Only one label is accepted and for ambiguous objects, the variability in responses will most likely be high. For example, a picture of a dog might have labels such as "dog," "canine," "Lassie," "golden doodle," etc. Figure 16
Figure 15: Screenshot of LabelMe labeling Figure 16: Screenshot of LabelLife labeling stage. stage. A free-form text label is required to One to many controlled vocabulary terms are complete the polygon. required to complete the polygon.
3 LabelLife: A Web-based Image Annotation Tool
demonstrates LabelLife's scheme for labeling polygons. A label selection box prompts the user for one to many controlled vocabulary terms that were preloaded into the system. Given the task of labeling very specific embryonic structures, this structure in the system is important to reduce variability in labeling responses and increase annotation accuracy.
- Integration of predictions into UI
Once a database of polygon, image, and image set to label mappings were built, it would then be possible to generate label predictions based on the past data. The tool needed to incorporate
these predictions in to the UI to offer suggestions to the user.
- Generic Tool For Many Uses
The new tool needed to be generic for many uses. The problem of assigning a vocabulary term to an image, set of images, or polygon within an image is not specific to the task of annotating gene expression pattern images. The implementation of the tool needed to be generic so that other groups could adopt it for other purposes.
3.3 Design and Implementation
LabelLife was designed to take into account all of the requirements outlined above. Since LabelLife takes so much inspiration from LabelMe, LabelMe was strongly considered for the task of labeling gene expression pattern images with controlled vocabulary terms. There were many desirable qualities that LabelMe had to accomplish this task. First, it is a very easy to use and intuitive tool to use. It is web-based and supported across multiple browsers. Users do not have to go through a
complicated installation and configuration process. The interface is visual and guides the user through 37
3 LabelLife: A Web-based Image Annotation Tool
the process without wordy instructions. To outline shapes in images, the user only has to point and click and the interface guides the user to complete the polygon to proceed to the labeling step. Second, LabelMe is open to the public. The source code is freely and publicly available through the web site. The developers of LabelMe provide detailed instructions on how to get an instance running on both Windows and Linux. The database is also available for download as long as the user has an account and actively contributes to its growth. There is also a well developed Matlab toolkit for analyzing the data. Third, LabelMe provides the ability to label polygons in images for annotation. These qualities all made LabelMe a viable option for the task at hand, but there were several qualifies lacking that necessitated the development of a new system.
LabelLife combined several attributes that worked well with LabelMe with several new features that were necessary for labeling gene expression pattern images. The design for LabelLife incorporated the requirements above that were not supported by LabelMe. First, LabelLife needed to support the labeling of not only polygons, but also images and image sets. The display also needed to handle this newly introduced relationship. Second, LabelLife needed to support a one-to-many mapping of polygons, images, and image sets to labels. Third, LabelLife needed to support controlled vocabularies. LabelMe currently allows free form text entry for assigning labels to polygons. The system was originally designed with this intent in mind to allow for learning from the user about what was an appropriate name for an object [26]. The development team at LabelLife has since integrated WordNet, an electronic dictionary, that generates semantic trees of labels for the analysis phase of LabelMe. [16]. For the purpose of labeling very specific anatomical terms in a developing fly embryo, the design decision was made to restrict users to a limited set of complex vocabulary terms. Fourth, LabelLife had to incorporate important domain specific metadata into the user interface to assist the labeler. Finally, LabelLife had to support presenting predictions to users about what labels are likely to
3 LabelLife: A Web-based Image Annotation Tool
be found in a particular image or stained region of an image.
To accomplish these specific design goals, much thought went into the design of the system. The system is laid out in detail in the following sections.
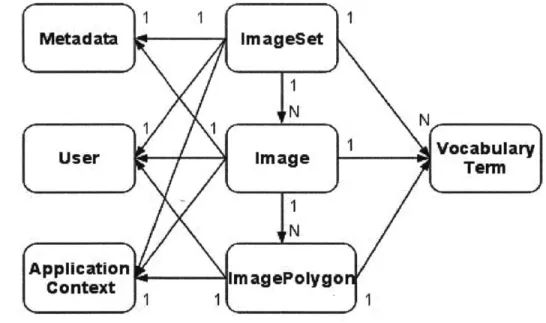
3.3.1 Data Model
Figure 17 depicts LabelLife's data model. The following describes each module of the data model. Figure 18 illustrates a screenshot of LabelLife with the objects defined in the object model tagged on the display to communicate what parts of the UI these objects have an effect on.
3 LabelLife: A Web-based Image Annotation Tool
Figure 18: Screenshot of LabelLife demonstrating where the data model objects apply in the user interface.
- Image
Image objects are contained by ImageSets. Images contain ImagePolygons. Images also have associated Metadata and VocabularyGroup objects as well as User ownership information. - ImageSet
ImageSets are containers for Images. They have associated Metadata and VocabularyGroup objects. Also, the User who created and modified the ImageSet is stored.
* ImagePolygon
ImagePolygons represent polygons that can be hand drawn by pointing and clicking on the website. Image objects contain one-to-many ImagePolygons. ImagePolygons themselves maintain a list of points, a User that created and modified them, and a VocabularyGroup of assigned controlled vocabulary terms.
- ApplicationContext
3 LabelLife: A Web-based Image Annotation Tool
application. This object keeps track of allowed controlled vocabularies that can be used for applying terms to objects in the data set.
User
The User object stores all necessary information about a user of the application. User information is stored to keep track of who creates and modifies objects. Also, all operations that can be performed require user identification.
- VocabularyTerm
A VocabularyTerm represents a controlled vocabulary term that can be applied to an object. The VocabularyGroup object ensures that one to many VocabularyTerms can be applied to an
object.
- VocabularyGroup
A VocabularyGroup is a container for VocabularyTerms. VocabularyGroups can represent
available controlled vocabulary terms for labeling. VocabularyGroups can also represent the actual terms that are assigned to Images, ImageSets, and ImagePolygons.
- Metadata
Metadata is a container of key/value mappings that provide relevant information for specific
objects. In the context of the problem of labeling gene expression pattern images, examples of
Metadata could be the Gene, orientation, staining intensity, and Chromosome location.
3.3.2 System Architecture
Figure 19 depicts LabelLife's system architecture. The system will be described in detail in the following sections.
![Figure 2: Example data from the BDGP database for the twi gene in Drosophila [14].](https://thumb-eu.123doks.com/thumbv2/123doknet/14135232.469584/15.918.152.758.132.462/figure-example-data-bdgp-database-twi-gene-drosophila.webp)