Publisher’s version / Version de l'éditeur:
Vous avez des questions? Nous pouvons vous aider. Pour communiquer directement avec un auteur, consultez la première page de la revue dans laquelle son article a été publié afin de trouver ses coordonnées. Si vous n’arrivez pas à les repérer, communiquez avec nous à PublicationsArchive-ArchivesPublications@nrc-cnrc.gc.ca. Questions? Contact the NRC Publications Archive team at
PublicationsArchive-ArchivesPublications@nrc-cnrc.gc.ca. If you wish to email the authors directly, please see the first page of the publication for their contact information.
https://publications-cnrc.canada.ca/fra/droits
L’accès à ce site Web et l’utilisation de son contenu sont assujettis aux conditions présentées dans le site LISEZ CES CONDITIONS ATTENTIVEMENT AVANT D’UTILISER CE SITE WEB.
18th International Conference on Port and Ocean Engineering under Arctic Conditions [Proceedings], 2005
READ THESE TERMS AND CONDITIONS CAREFULLY BEFORE USING THIS WEBSITE. https://nrc-publications.canada.ca/eng/copyright
NRC Publications Archive Record / Notice des Archives des publications du CNRC :
https://nrc-publications.canada.ca/eng/view/object/?id=a333d96d-489b-493c-b9c2-669cd5eaba03 https://publications-cnrc.canada.ca/fra/voir/objet/?id=a333d96d-489b-493c-b9c2-669cd5eaba03
Archives des publications du CNRC
This publication could be one of several versions: author’s original, accepted manuscript or the publisher’s version. / La version de cette publication peut être l’une des suivantes : la version prépublication de l’auteur, la version acceptée du manuscrit ou la version de l’éditeur.
Access and use of this website and the material on it are subject to the Terms and Conditions set forth at Preliminary modeling of ice failure on cones due to edge shear
PRELIMINARY MODELING OF ICE FAILURE ON CONES DUE TO EDGE SHEAR
Michael Lau
Institute for Ocean Technology, National Research Council of Canada, St. John’s, Newfoundland, Canada
ABSTRACT
Recent model tests at the Institute for Ocean Technology (IOT) showed that the influence of shear stresses on determining failure modes during ice-cone interactions becomes more important with increase of ice velocity and is finally predominant for large cone angles and thick ice with the ice edge failing predominately in shear mode. The same shear failure mode has been observed as the dominant failure mode of freshwater ice during the ice/cone interaction experiments conducted in C-CORE’s centrifuge. This paper identifies the salient features associated with the shear failure process. A simple conceptual model was proposed for future model developments. This model incorporated the concepts of non-simultaneous ice/cone contact and failure process, rotation of the ice edge and the size of the failure zone. Predictions from the model compare well with measurements from the model tests.
INTRODUCTION
Observations from early experiments show that bending failure is dominant under interaction conditions such as low inclination angle (10o to 60o), low ice-cone friction coefficient, small ice thickness, and low ice velocities. However, failure modes other than bending can be dominant under certain conditions. With increasing inclination and surface roughness of the cone, ice speed or ice thickness, the failure mode changes gradually from bending to shear or crushing (Lau et al., 1999a; Wessels, 1984; Sodhi, 1987; and Haynes et al., 1983). The influence of shear stresses on determining failure modes becomes more important with increasing ice thickness and is finally predominant for thick ice fields (Lau et al., 1999a; Maattanen, 1986). Observation of actual fracture patterns in thin ice reveals that pure bending occurs when circumferential cracks form at distances slightly higher than the characteristic
length. With increase in ice thickness and speed, the average length of broken pieces decreases to approximately the ice thickness, which may indicate a large influence of shear deformation to ice failure (Lau et al., 1999a). Recent model test data (Lau et al, 2000) obtained in the Institute of Ocean Technology’s (IOT, formerly the Institute for Marine Dynamics) ice tank showed that with further increase of ice velocity, the size of broken ice fragments decreases abruptly to approximately a tenth of the ice thickness with the ice edge failing in shear. The same shear failure mode has been observed as the dominant failure mode of freshwater ice during the ice/cone interaction experiments conducted in C-CORE’s centrifuge (Barrette et al, 1999a and 2000; and Lau et al, 2002).
This paper documents a preliminary analysis of the shear failure mechanism as observed in the recent model tests conducted at C-CORE (Lau et al, 2002) and IOT (Lau et al, 2000). The evidence of shear failure is cited and the salient features associated with the shear failure process are identified in the following section. In the section entitled Model Development a simple conceptual model is formulated to encompass the salient features of the interaction and failure processes. This model may form the framework for future model developments and calibration. It incorporates the concepts of non-simultaneous ice/cone contact and failure processes, rotation of the ice edge and the size of the failure zone. The validity of the model is also verified.
EXPERIMENTAL EVIDENCE OF SHEAR FAILURE
The following interaction process associated with edge shear failure was identified:
IOT’s Test Series
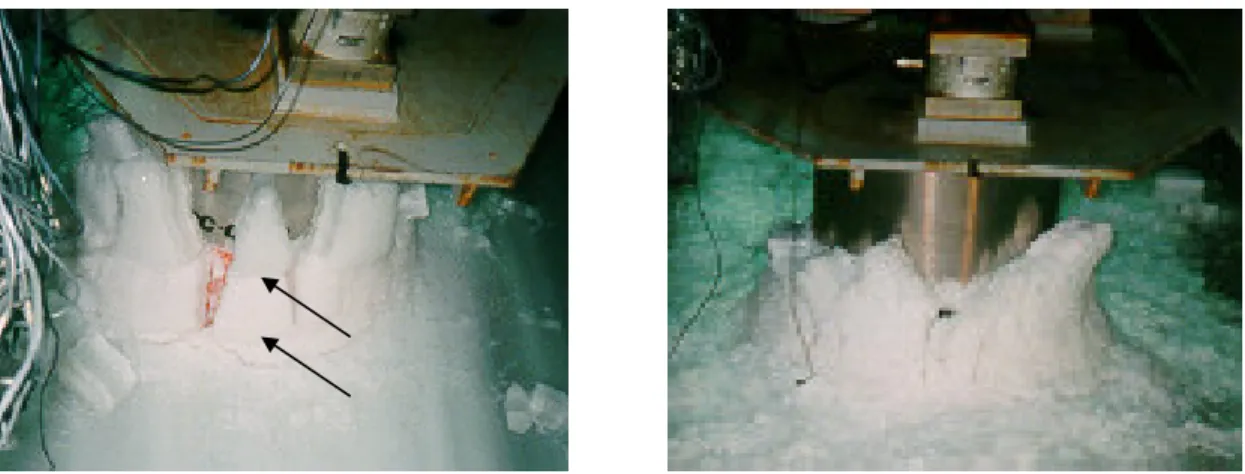
A detailed description of the test series was reported by Lau et al (2000, 2002). For ice thickness equal to 110 mm, the failure mode changed abruptly to shear at velocity greater than a transitional value of about 0.15 m/s for a 60o cone. (See Figure 1.) Shearing of the ice edge along the grain boundaries of the columnar model ice occurred before any circumferential (flexural) crack could form away from the edge, resulting in small cusp-shaped ice chips having length and width typically less than 15 and 10 mm, respectively (Figure 1: right plate). Immediately before the change of failure mode, the observed distance between circumferential cracks was about 130 mm. (See Figure 1: left plate with arrows showing the circumferential cracks.)
The ice edge rotates significantly before the on-set of ultimate ice failure. Preliminary analysis of the video records suggested a rotation angle of approximately 30o to the horizontal. This large rotation angle may be due to the presence of partial or fully formed radial and circumferential cracks. The contact surface after failure was very rugged, resulting in non-simultaneous contact and ice failure along the cone/ice interface. The channel formed by the model’s passage appeared very regular and was approximately as wide as the cone’s waterline diameter. The ice chips cleared around the cone with only a small amount of ride-up. (See Figure 1: right plate.)
Figure 1. Photographs showing 110 mm thick ice interacting with a 60o cone at velocity 0.1m/s in the left picture (below the transitional speed) and at 0.25m/s in the right picture (above the transitional speed).
C-CORE’s Centrifuge Series
A detailed description of the C-CORE’s centrifuge series with 45o cones was reported by Lau et al (2002), and a detailed analysis of the interaction process was given by Pfister et al (2002). The same shear failure mechanism was identified in
C-CORE’s centrifuge tests with
freshwater ice. It is believed that the steeper cone angle (60o) coupled with high velocity favored the occurrence of edge shear in IOT’s tests, whereas the low ratio of shear strength σs to
flexural strength σf1 contributed to a
large extent to the shear failure observed in C-CORE’s tests. It should
be noted that the slightly downward curvature of the ice surface (Lau et al, 2002) typical of centripetal ice growth might also favor edge shear because such arching increases the moment capacity of the ice sheet.
During spin-down, the rubble pile, ride-up, and intact ice were frozen together to give a record of the interaction process that occurred at the end of each test. For each test, a piece of ice near the model was carefully cut out and stored for future analysis.
1 For IMD’s series, σ
s/sf was averaged at 1.33. For freshwater ice, σs/sf is estimated from 0.23 to 0.57
with commonly quoted values of 1.76 MPa for σs (Timco and O’Brien, 1994) and 0.4 to 1 MPa for σs
(Michel, 1978).
Figure 2: A typical cross-section of a sample collected in Test ICESTR34: 12-mm thick freshwater ice (side of cone).
Figure 2 is a photo of the typical cross-section of the samples collected. From this the following observations can be made:
• The crack pattern that was observed at the intact ice tip shows a few partially formed cracks. These cracks originated mid-level in the ice sheet where shear stresses are expected to be large, i.e., shear stresses are at a maximum at the neutral axis with a beam loading orientation. Cracking due to diagonal tension was also evident at the lower portion of the ice sheet. These are primary cracks with a width of a few grain diameters. (The diameter of the columnar grains was barely visible from the intact ice.)
• The size of ice fragments riding up the cone surface suggested that further failure of ice produced ice fragments with size in the order of 2 to 3 grain diameters.
MODEL DEVELOPMENT
The existing theories of ice forces on cones assume that the ice fails in a flexural mode. A preliminary comparison with a number of leading ice force predictors revealed a substantial over-estimation. This may be due to the fact that shear failure may occur before the moment capacity of the ice is fully developed. In order to arrive at a better prediction, the major features of the interaction and failure processes associated with the particular shear failure were identified and a conceptual model was developed accordingly. As experimental data associated with this type of failure were scanty and many aspects of the interaction were not fully understood, gross assumptions had to be made, particularly concerning ice strength, contact geometry and the non-simultaneous nature of the interaction. This model may form the framework for further model developments and fine-tunings. The following three characteristics of the failure process are considered:
• Size of the failure zone; • Geometry of the contact; and
• Non-simultaneous ice/cone contact and the failure process.
Size of Failure Zone
The failure was localized at the ice edge located around the front half of the cone’s waterline. The failure is along vertical columnar grain boundaries. If shear failure were to occur simultaneously along the cone’s waterline, the area of the failure plane may be estimated by the following equation:
(1)
Where D is the cone’s waterline diameter and t is the ice thickness.
A==== ππππDt
Non-Simultaneous Failure
To-date, our understanding of the nature of this non-simultaneous shear failure is limited, however research into non-simultaneous failure of ice with wide indenters may shed some light into the process, as both phenomena are qualitatively similar.
Shearing of the ice edge results in small cusp-shaped ice chips. These cuspings produce a rugged ice edge with many small contact points distributed along the ice edge that serve as stress concentrators for subsequent cusp formation as depicted in
Figure 3. A large number of small zones of failure contribute statistically to a global average force. In the absence of data to quantify the effect of this incomplete contact on ice load, a contact coefficient k is employed to characterize this effect in the same manner as other indentation equations for ice crushing, i.e., Korzhavin Equation (American Petroleum Institute, 1988). A value of 0.3 for k may be assumed based on suggestions from Michel (1978) for cases of brittle ice crushing.
Rotation of Ice Edge
Edge rotation due to flexural ice deformation affected the boundary loading condition of the intact ice. (See Figure 4.) With increasing edge rotation, the magnitude of the force component required for ice shearing (Fs) along the columnar grain boundary
increases.
Radial cracking of the intact ice sheet divided it into wedges. For simplicity, the tip rotation angle β (Figure 4) of such wedges is estimated using the theory of elastic beams on elastic foundation with each wedge idealized as a constant width semi-infinite floating beam tip with a transverse load2 (Hetenyi, 1946):
(2)
(3)
(4)
2
It is felt that this level of analysis is sufficient for the present purpose. A more sophisticated treatment of the problem would include 3-D loading and deformation behavior.
β ββ β ==== P EI lc 2 2 I ==== bt 3 12 l Et n g c w = == = 3 4 3 ρρρρ
Figure 3: Stress concentrators and subsequent cusp formation
Where P is the transverse load; E, the elastic modulus; I, the area moment of inertia; lc, the characteristic length of the beam; b, the beam width; t, the ice thickness; n, the
acceleration scale factor3; ρw, the density of water, and g is the gravitational constant.
Combining Equations 2 to 4 gives:
(5)
The vertical breaking load per unit beam width P/b can be estimated from experiments or analytical models, i.e., Lau et al (1999b).
Shear Breaking Load Formula
Figure 4 shows a 2-D geometry of the ice-cone interaction at the tip of a wedge beam. Fh and Fv are the horizontal and vertical ice
breaking forces acting on the cone at ice failure and Fs is the reaction force required
to shear the beam along the columnar grain boundaries. Fs is related to Fh and Fv
through β: (6)
Fh is related to Fv through a resolution
factor ε2D:
(7)
(8)
The equation to compute shear failure load according to the this model is given as the following:
(9)
Combining Equations 5, 6, 8 and 9 gives:
3
The acceleration scale factor is a scaling factor used in the centrifuge modeling. The scaling principle was given in Lau et al (2002). For conventional tank experiments, this factor is equal to one and the centrifugal acceleration is equal to ng in a typical centrifuge test.
ββββ ρρρρ = == = P b Et n wg 12 3 β Fv Fh Fs Fs ==== Fvcosββββ ++++Fhsinββββ Fh ====Fvεεεε2D Fs ==== kσσσσsA
Figure 4: Geometry of interaction at tip of wedge beam εεεε αααα µµµµ αααα α αα α µµµµ αααα 2 D ==== + ++ + − −− − sin cos cos sin
(10)
Fv is the vertical load needed to break the ice edge. This equation may replace the
flexural breaking equation in most existing ice force models as these models calculate Fv and relate it to Fh via a resolution factor ε (Lau et al, 1999b).
MODEL VERIFICATION
Comparison of Model Predictions to IOT’s Data
In IOT’s test series (Lau et al, 2000), shear model of failure dominated tests with a 60o cone in 110-mm ice at ice velocities greater or equal to 0.15 m/s. Data from these tests were used for comparison with model predictions. Shear strength and moduli of ice were measured in IOT’s tests. A value of 0.3 was assumed for the contact factor with the reason cited in the previous section. The values of β were estimated between 2.6o to 3.5o from the measured E-modulus. These values are too small in comparison with observation from video recordings. This discrepancy may be partially
attributed to the partially formed multiple radial and circumferential cracks. A value of 30o was estimated from visual data to compute the model predictions. Figure 5 shows the comparison of the model predictions to the measurements. The experimental data were in agreement with the model predictions, especially with Fv.
The predictions for Fh were up to 60% greater than measurements. This apparent
discrepancy was due to the 2-D treatment of the problem used in this analysis. A more sophisticated treatment of the problem, would reduced the predictions for Fh by
as much as 60% using a 3-D resolution factor (Lau et al, 1999b), i.e., ε3D = (2/π) ε2D.
In this comparison, the value of β was a rough estimate and the force computation did not take into account the influence of ice velocity. Better estimation of β at ice failure and the inclusion of velocity effect in the problem treatment may improve the comparison.
((((
))))
F k t D v s D = == = + ++ + σ σσ σ ππππ ββββ εεεε ββββ 1 2 2 cos sin 0 1000 2000 3000 4000 5000 6000 0 2000 4000 6000 Measurement (N) P re d ic ti o n ( N ) 1:1 Fit Line Fh FvFigure 5: Comparison of model predictions with force measurements for IOT’s tests dominated by shear failure: 60o cone, 110 mm ice and ice velocity > or = 0.15m/s.
Comparison of Model Predictions to C-CORE’s Centrifuge Data
Predictions from the ice force model were compared with the freshwater data obtained from centrifuge tests (Lau et al, 2002). In the absence of experimental measurements, the contact factor was again assumed to be 0.3, the shear strength σs was assumed to
be 850 kPa and β was estimated between 8.5o to 16.5o from the E-modulus estimated from Barrette et al (1999b). It should be noted that these estimates ranged from 350MPa to 760 MPa (with an E/σ ratio ranging from 130 to 270), which gives a large range of values for β.
Arriving at an appropriate value of shear strength for freshwater ice requires some explanation. Frederking et al (1988) reported an average shear strength of 600 kPa for freshwater ice at –10oC that increased to 1100 kPa if special measures were taken to reduce stress concentration at the load application points. The value chosen for this comparison was the averaged shear strength obtained from the two methods, assuming the effect of stress concentration at the loading points during tests was approximately in between these two cases. This value
is within the range of values obtained from other studies for ice temperature around –5oC and with the shear plane parallel to the growth direction (Kozitskii, 1978; and Michel, 1978). Figure 6 shows a good agreement between model predictions and force measurements. It should be cautioned that the validity of the selected k and σs from which the model predictions
were computed are yet to be verified. Nevertheless, the selected values were reasonable, and the good agreement was encouraging.
CONCLUSIONS
Shear failure may become the dominant ice failure mode under conditions where there may be a thick ice sheet, a high angle of cone inclination or high velocities. In this case, ice fragments into cusp-sized pieces that decrease in size with increasing velocity to the point where they can be as small as one tenth of the ice sheet thickness. This creates an irregular contact surface between the cone and ice sheet that is difficult to approximate. The model developed to attempt to determine the behavior of ice under these conditions was proven to be reasonably accurate through experimentation, however improved accuracy may be achieved through further research.
Figure 6: Comparison of model predictions with force measurements from C-CORE’s centrifuge tests with freshwater ice
0 100 200 300 400 500 600 700 800 900 1000 0 200 400 600 800 1000 Measurement (N) P re d ic ti o n ( N) 1:1 Fit Line Fh Fv
ACKNOWLEDGEMENTS
The experiments described in this paper were partially funded by a NRC/NSERC Research Partnership grant. The experiments were supervised by Dr. R. Phillips (C-CORE) and Dr. S.J. Jones (IOT). Brian Hill, Chris Meadus, and Austin Bugden of IOT provided technical assistance to IOT’s test series. Don Cameron and Tony King provided technical assistance to C-CORE’s test series. Susan Pfister (MUN) assisted in thin section analysis of ice samples. I gratefully acknowledge their support.
REFERENCES
American Petroleum Institute, (1988). Recommended practice for planning, designing, and constructing fixed offshore structures in ice environments. API
Recommended Practice 2N (RP 2N), First Edition, the American Petroleum Institute, Washington, D.C., U.S.A.
Barrette, P.D., Phillips, R., McKenna, R.F., and Jones, S.J., (1999a). Interaction between level ice and a conical structure: centrifuge simulations. Proceedings of the
18th International Conference on Offshore Mechanics and Arctic Engineering (OMAE ‘99), St. John’s, Newfoundland, Canada, P&A-1148.
Barrette, P.D., Phillips, R., Clark, J.I., Crocker, G., and Jones, S.J., (1999b). Flexural behavior of model sea ice in a centrifuge. Cold Region Sciences and Technology, Vol. 13, p.122.
Barrette, P.D., Lau, M., Phillips, R., McKenna, R.F., and Jones, S.J., (2000). Interaction between level ice and conical structures: centrifuge simulations phase II.
Proceedings of the 19th International Conference on Offshore Mechanics and Arctic Engineering (OMAE ’00), New Orleans, Louisiana, U.S.A.,, P&A-1004.
Frederking R., Svec, O.J., and Timco, G.W., (1988). On measuring the shear strength of ice. International Association for Hydraulic Research (IAHR) Ice Symposium, Sapporo, pp. 76-88.
Haynes, F.D., Sodhi, D.S., Kato, K., and Hirayama, K., (1983). Ice forces on model bridge piers. CRREL Report 83-19, U.S. Army CRREL, Hanover, New Hampshire, U.S.A.
Hetenyi, M., (1946). Beams On Elastic Foundations. University of Michigan Studies,
Scientific Series, Vol. XVI, the University of Michigan Press, Ann Arbour, Michigan, U.S.A.
Kozitskii, I.E., (1978). The shear strength of ice. Soviet Meteorology and Hydrology, No. 3, March, pp. 86-87.
Lau, M., Molgaard, J., Williams, F.M., and Swamidas, A.S.J., (1999a). An analysis of ice breaking pattern and ice piece size around sloping structures. Proc. 18th Intl. Conf. on Offshore Mechanics and Arctic Engineering (OMAE ‘99), ASME, New York, U.S.A, P&A-1151.
Lau, M., Molgaard, J., Williams, F.M., and Swamidas, A.S.J., (1999b). Development and verification of a 3-d model for ice forces on conical structures. Proceedings of
the 18th International Conference on Offshore Mechanics and Arctic Engineering (OMAE ‘99), St. John’s, Newfoundland, Canada, P&A-1150.
Lau, M, Phillips, R., McKenna, R., and Jones, S.J., (2002). Modelling ice-structure interactions in a geotechnical centrifuge. 1st International Conference on Physical Modelling in Geotechnics (ICPMG’02), St. John’s, Newfoundland, Canada, pp. 325-330.
Lau, M, Phillips, R., McKenna, R.F., and Jones, S.J., (2000). Influence of velocity on ice-cone interaction. IUTAM Ice Symposium on Scaling Laws in Ice Mechanics and
Ice Dynamics, Fairbanks, Alaska, U.S.A, pp. 127-134.
Maattanen, M. (1986). Ice sheet failure against an inclined wall. Proceedings of the
8th International Association for Hydraulic Research (IAHR) Ice Symposium, Iowa City, U.S.A, Vol. I, pp. 149-158.
Michel, B., (1978). Ice Mechanics, Les Presses de l'Université Laval, Quebec, Canada.
Pfister, S., Williams, F.M., and Phillips, R., (2002). Interaction of level ice with upward breaking conical structures at two scales. Proceedings of the 16th
International Symposium on Ice, Dunedin, New Zealand, pp. 416-425.
Sodhi, D.S., (1987). Dynamic analysis of failure modes on ice sheets encountering sloping structures. Proc. 6th Intl. Conf. on Offshore Mechanics and Arctic Engineering (OMAE 87), ASME, New York, Vol. IV, pp. 281-284.
Wessels, E., (1984). Model test investigation of ice forces on fixed and floating conical structures. Proc. 7th International Association for Hydraulic Research (IAHR) Symposium on Ice, Hamburg, Germany, Vol. III, pp. 203-220.