INTRODUCING VISUAL STUDIO 2010
DAVID CHAPPELL
MAY 2010
CONTENTS
Tools and Modern Software Development ... 3
Understanding Visual Studio 2010 ... 3
The Components of Visual Studio 2010 ... 4
A Closer Look at Team Foundation Server... 5
Work Item Tracking ... 7
Version Control ... 8
Build Management: Team Foundation Build ... 9
Reporting and Dashboards... 9
Using Visual Studio 2010 ... 12
Managing Requirements ... 12
Architecting a Solution ... 13
Designing Code: UML Modeling ... 14
Controlling Code: Layer Diagrams ... 14
Understanding Code: Sequence Diagrams and More ... 15
Writing Code ... 16
Supporting Software Development ... 17
Supporting Database Development ... 18
Supporting Developer Testing and Debugging ... 19
Working with Project Information ... 20
Testing Code ... 20
Gathering Test Results and Diagnostic Data ... 21
A Tool for Testers: Microsoft Test Manager 2010 ... 23
Managing Test Lab VMs: Visual Studio Lab Management 2010 ... 24
Putting the Pieces Together: A Testing Scenario ... 25
Supporting Manual Testing ... 27
Supporting Automated Testing ... 28
Managing and Tracking a Project ... 30
Maintaining Code ... 32
Adopting Visual Studio 2010 ... 34
Deciding What to Buy ... 34
Migration: Getting There From Here ... 36
Conclusion ... 36
TOOLS AND MODERN SOFTWARE DEVELOPMENT
For most people, the days of the lone developer are long gone. The great majority of software today is created by teams. Given this reality, modern software development tools are used primarily by people working together.
One approach to designing these tools is to create a separate tool for each part of the development process. Everyone on the team might then agree to use a particular tool for versioning source code, another for tracking bugs, and a third for managing tests. This approach can certainly work—it’s much better than having no tools at all. But what happens when a developer needs to determine which test found a particular bug in code that addresses a specific requirement? Or what if a project manager wants to get a view of the project’s overall code quality over time, looking at bug counts, test progress, code churn, and more? Answering these kinds of questions requires integration across the team’s tool set. Even though each tool might be great at what it does, development with a set of disconnected tools has limits. An alternative approach is to create an integrated set of development tools explicitly designed to work together. While a particular member of this tool set might not have every feature found in a standalone version of that tool, the connections between the tools let the team work more effectively. Answering questions that span tools gets easier, as does handing off work between different team members. Since the goal is to optimize the development process as a whole, this integrated approach can make the process of creating software significantly more effective.
Achieving this is the goal of Visual Studio 2010. This latest release of Microsoft’s flagship development environment aims at providing a unified set of tools for a variety of development needs. The intent is to be useful in a range of situations, from a large development team spread across three continents to a solo developer working on her own. It’s meant to be a modern foundation for what’s become known as
Application Lifecycle Management (ALM).
Visual Studio 2010 is the successor to both Visual Studio 2008 and Visual Studio Team System 2008. (Microsoft chose to drop the “Team System” label with this release.) The product is large, and so it’s available in several different configurations, each with a specific set of functionality. How those configurations look and what’s in each one is described at the end of this paper. The goal now is to describe Visual Studio 2010 as a whole, painting the big picture of what this technology family is and how it can be used.
UNDERSTANDING VISUAL STUDIO 2010
Modern software development is anything but simple. Accordingly, the tools that support today’s development teams have many moving parts, and Visual Studio 2010 is no exception. One way to get a handle on this product family is to start with a broad look at the components and how they fit together. Once we’ve done this, we can look more closely at the piece that ties everything else together: Team Foundation Server.
THE COMPONENTS OF VISUAL STUDIO 2010
Visual Studio 2010 has several distinct parts. These parts can connect with one other, with other
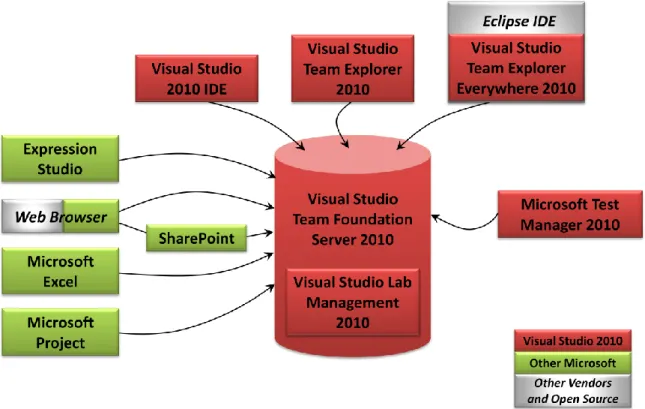
Microsoft technologies, and with non-Microsoft technologies. Figure 1 shows the main Visual Studio 2010 components and some of the other technologies that are most often used with them.
Figure 1: The components of Visual Studio 2010 rely on Team Foundation Server to connect with each other and with technologies from Microsoft, other vendors, and the open source world. The main components of Visual Studio 2010 (shown in red) are the following:
Visual Studio Team Foundation Server (TFS) 2010: As Figure 1 suggests, TFS is at the center of the
Visual Studio story today. Every other part of the product connects to TFS, which acts as a central hub for information throughout the development process. It provides a place to store and manage requirements and other information, version control for source code, build management, bug tracking, test case management, reports based on this information, and more. TFS also provides an application programming interface (API) that lets other software access its services.
The Visual Studio 2010 IDE: Millions of developers use this integrated development environment
(IDE) today, either on its own or with earlier versions of TFS. The tool allows creating, compiling, and running code, along with support for testing and other development functions.
Visual Studio Team Explorer 2010: This tool focuses on letting its users access information in TFS,
such as reports and build status. It can run on its own, as Figure 1 shows, or inside the Visual Studio IDE.
Visual Studio Team Explorer Everywhere 2010: While some development teams work solely in a
Visual Studio world, many don’t. Plenty of organizations build applications using both .NET and Java, for example. To help developers using Eclipse-based IDEs work effectively with Visual Studio 2010, the product includes an Eclipse plug-in that allows connecting with TFS.
Microsoft Test Manager (MTM) 2010: Testing is a critical part of software development. While
the Visual Studio IDE includes a range of testing support, it’s focused on testing done by people with development skills. MTM focuses more on manual testing, providing a tool for generalist testers rather than developers.
Visual Studio Lab Management 2010: This component allows creating and managing virtual
machines (VMs) for a test lab. While it’s certainly possible to do testing on real physical machines, using VMs can be simpler, faster, and cheaper. Lab Management is accessed through Microsoft Test Manager 2010, and as Figure 1 shows, it’s implemented as part of TFS.
Other Microsoft technologies (shown in green in Figure 1) are also commonly used with Visual Studio 2010. They include the following:
Expression Studio: This product suite includes tools such as Expression Blend to help designers create user interfaces (UIs) for Silverlight and Windows Presentation Foundation (WPF) applications. These interface definitions can be stored in TFS, then used by the Visual Studio IDE. Internet Explorer (or another Web browser): Using an aspect of TFS called Team Web Access, people can access TFS through a Web browser. This allows making TFS information accessible to a broad range of participants in the development process, including customers.
SharePoint: Visual Studio 2010 lets a team create a SharePoint-based team project portal for accessing information such as documentation, team calendars, and dashboards with TFS information. As with Team Web Access, this lets people access information about the development process without requiring them to install any component of Visual Studio 2010 itself.
Microsoft Excel: Many project managers (and even some developers) use Excel to keep track of progress. To help them do this, Visual Studio 2010 lets Excel directly access TFS. The product also provides a range of Excel workbooks and reports for project managers and others to use in the development process.
Microsoft Project: Along with (or instead of) Excel, many project managers use Project. This tool can also access TFS, allowing things such as creating Gantt charts based on requirements stored in TFS.
A CLOSER LOOK AT TEAM FOUNDATION SERVER
TFS sits at the center of Visual Studio 2010, which makes it the place to start in understanding this product family. In a fundamental sense, TFS is a database. In fact, TFS is built on SQL Server, and it can be
clustered for high availability. Yet while TFS does store lots of information, it also provides a variety of useful functions using that data. Figure 2 shows a summary of what TFS contains.
Figure 2: Team Foundation Server provides work item tracking, version control, test case management, lab management, build management, and the ability to create reports and dashboards. As the figure shows, TFS has several parts:
Work item tracking: The development process uses many different kinds of information:
requirements, tasks to be done, bugs, test cases, and more. TFS holds all of this information in
work items. Each work item is actually a record in the TFS database, and like database records,
work items can be related to one another in various ways. They can also be customized, letting organizations create work items that fit their development process.
Version control: A fundamental challenge in software development is keeping track of changes.
TFS version control manages updates to source code and other information used in the development process.
Test case management: Testing is a hugely important part of the development process. The goal
of this TFS component is to help developers and testers create, use, and manage their test cases and test results. The section on testing later in this paper takes a look at what this aspect of TFS provides.
Lab management: As was shown in Figure 1, Visual Studio Lab Management 2010 is
implemented as part of TFS. This component is also described in more detail in the section on testing later in this paper. (Lab Management was called out separately in Figure 1 because it’s purchased independently from the rest of TFS, as described later.)
Build management: Creating a runnable application from source code and the other artifacts a
development team creates can be remarkably complicated. And once an application has been built from these various parts, it’s useful to run tests to verify the quality of the build. TFS build management provides an automated mechanism for doing these things and more.
Reports and dashboards: Whether a team is small or large, the development process creates a
mountain of information. The reports and SharePoint dashboards that TFS provides help the people involved in that process understand and make sense out of this mass of data.
Figure 2 also shows one more component: process templates. To understand their role, think about how teams work today. Many different development processes are in use, each with its defenders and detractors. Some approaches, such as waterfall processes, place people in quite distinct roles: architect, developer, tester, project manager, and more. Others, such as Scrum and other agile processes, define multidisciplinary teams with each team member performing a range of functions. Visual Studio 2010 isn’t expressly designed to support Scrum or waterfall development or any other particular process. Instead, this tool family is meant to be useful with whatever development process a team is using.
Yet the set of work items, reports, and dashboards that a team would find useful varies across different processes. TFS addresses this reality with process templates. Each process template defines things such as specific work item types, reports, dashboards, and Excel workbooks. Organizations are free to create process templates that match their own processes, and others are available from third parties. To make life simpler, however, Visual Studio 2010 itself includes two process templates. They are:
MSF for Agile Software Development, defining work items, reports, and more for an agile development process.
MSF for CMMI Process Improvement, defining work items, reports, and more intended to be used in projects that need to record more information about the development process.
And don’t be confused: Even though both template names begin with “MSF”, neither one requires adopting the Microsoft Solutions Framework. Along with these two, Microsoft also makes available a downloadable process template for Scrum, today’s most popular agile process.
Having a broad sense of TFS is important. But understanding what TFS actually does requires more. The next sections take a closer look at some of its components.
Work Item Tracking
Creating software requires keeping track of lots of information. What requirements must the software meet? What tasks are remaining for the project, what’s the status of each one, and what are their relative priorities? What test cases have been created, and what bugs have those tests found? And perhaps most important, how are all of these individual pieces of information related to each other?
In Visual Studio 2010, all of this and more is done with work items. The exact set of work items available for a particular project depends on which process template is used. Both the MSF for Agile Software Development template and the MSF for CMMI Process Improvement template contain work items for requirements (called “user stories” in the Agile template), tasks, test cases, and bugs, for example, but
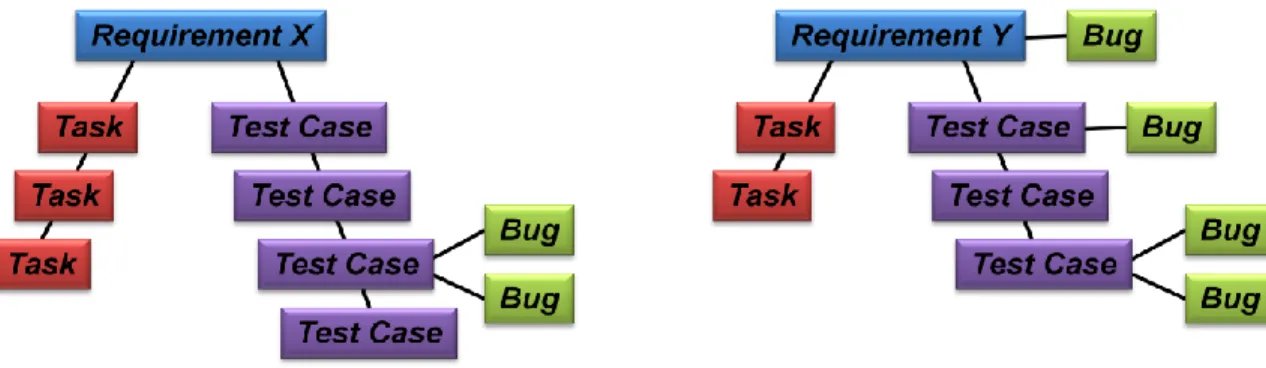
each also adds a few more. For instance, the CMMI template adds work items for risks, reviews, and change requests, all things that make sense for the development style this template supports. Whatever work items are used, TFS allows linking them together in useful ways. For example, a requirement work item can be linked to the task work items that spell out what must be done to implement that requirement. It might also be linked to one or more test case work items that verify the correctness of the requirement’s implementation. Each test case work item, in turn, can be linked to one or more bug work item that this test has uncovered. Figure 3 illustrates this idea.
Figure 3: Work items can be linked together, letting team members and other project stakeholders trace the connections among them.
To see why this is important, think about what happens when information about the development process is not grouped together in a single place. Without this, answering important questions such as how well-tested the software is gets hard. There’s no simple way to work out what tests have been run against each requirement and what bugs are outstanding for each of those tests. With a unified approach, answering these questions is straightforward: Each requirement is connected directly to its test cases, their bugs, and more, as Figure 3 shows. Providing this kind of traceability is a fundamental reason why unifying software development tools makes sense.
Work items can be created, examined, and modified using various tools. A project manager might choose Excel, while a developer accesses work items from within the Visual Studio IDE. If the team decides to allow it, even customers can access work items from a Web browser. This allows the people who are paying for a project to check progress, file bugs, and otherwise participate in the development process.
Version Control
When multiple developers are working on the same code base, storing that code in a version control system makes life significantly easier. Each developer can now check out the code she needs, work on it, then check it back in. Conflicts with changes made by other developers are handled by the version control system. This functionality is referred to by various names, including source code control and software configuration management. Whatever it’s called, it’s an essential part of software development today. Visual Studio 2010 provides this with TFS version control, a shared repository for source code and other artifacts used in the development process. For example, both a developer writing source code with the Visual Studio IDE and a designer using Expression Blend to create a XAML user interface file can store their work in TFS version control. TFS also supports versioning of database schema, something that helps keep code and the data it uses in sync with each other.
TFS version control allows branching and merging, letting different groups work on the same code, then later combine their changes. And to make life easier for geographically distributed teams, developers in a remote location with a slow network link can use a local TFS proxy server. This proxy server provides a local cache for version-controlled information that gets regularly synced with the master copy in a central TFS server.
Like most things in TFS, the information in version control can be accessed via reports and dashboards. For example, a project manager can use these to see what has been checked in to version control by each developer. This is more efficient for the project manager, and it also helps reduce the time developers need to spend writing progress reports.
Build Management: Team Foundation Build
Throughout the life of a development project, a team will use the source code, database schemas, and other information in TFS version control to build executable versions of the application. TFS supports this using a technology called Team Foundation Build. Even though it’s considered part of TFS, Team
Foundation Build is typically installed on a separate machine from the other TFS components. Compiling software, a key part of many build processes, is a resource-intensive task, and so moving it off of the main TFS machine avoids slowing down everything else that this server does.
Build processes can be quite complex, with many steps. Once a build is complete, for example, Team Foundation Build can run build verification tests (BVTs) to check the build’s quality. It can also deploy the newly built software to specific machines, automatically making the code available to testers. To help define these processes, Team Foundation Build allows specifying the steps in a build as a workflow implemented using Windows Workflow Foundation. The product includes a wizard for visually laying out the steps in a build process, a tool that’s meant to make it easier to create and modify complex builds. And as usual with TFS, data about build processes and their results can be accessed via reports and dashboards.
Team Foundation Build supports several approaches: manual builds on demand, scheduled builds (such as nightly builds), and building whenever a change is checked into TFS version control. While frequent builds are useful—running a build for each checked-in code change is the cornerstone of continuous
integration—what happens if a change breaks the build? If Team Foundation Build can’t complete the build, no other developer or tester on this project can get a working executable until the error is corrected. This can be a significant problem, since one developer making a single mistake can stop all progress. To avoid this, Visual Studio 2010 can require gated check-in for some or all of a team’s developers. With this option, changes submitted to version control undergo their own separate build (including BVTs) to make sure they’re okay before the changes are committed. This significantly reduces the chance that errors in these newly checked-in changes will break the main build.
Reporting and Dashboards
The three aspects of TFS described so far—work item tracking, version control, and build management— create lots of data. The fourth aspect, reporting and dashboards, focuses on making this data available in useful ways. Reports can be created using either Excel or SQL Server Reporting Services, and they can present current or historical views of a development project. Dashboards, created using SharePoint,
provide a direct way to monitor a project’s status in various areas. For both, having all of the project’s information available in one place allows a broad view, correlating data from different areas.
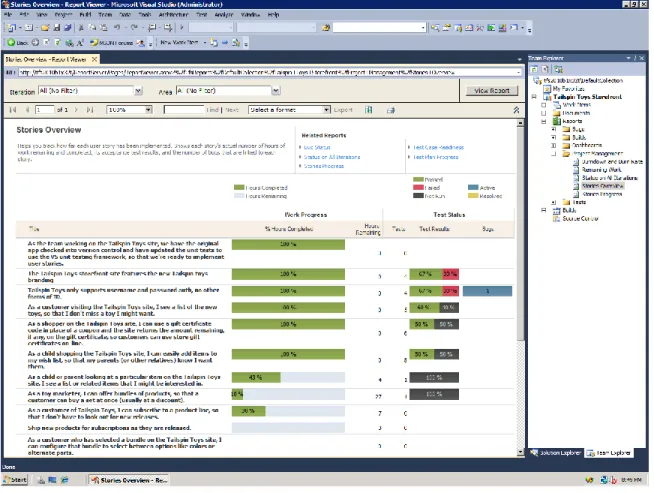
As with work items, exactly which reports and dashboards are available depends on the process template a team uses. For example, the Agile template provides more than 30 reports, including Stories Overview, Builds Status, Test Plan Progress, Bugs by Priority, and Bug Trends, all of which can help team members see where the project stands. Figure 4 shows an example of the Stories Overview report viewed in the Visual Studio 2010 IDE.
Figure 4: The Stories Overview report summarizes an agile team’s progress in addressing the project’s user stories.
On the left in this report is a list of the project’s user stories (i.e., its requirements). For each one, the report shows the work remaining to complete it, a summary of test results, and the number of outstanding bugs. Notice how this report makes use of a range of information stored in TFS, including work items containing requirements, the bugs associated with each one, test results, and more. The pane on the right lists other available reports. It’s possible to customize these reports or create entirely new reports using Excel or the Report Designer in SQL Server Reporting Services.
Reports can provide historical context, which makes them quite useful in understanding a project’s status. If 90% of the project’s tests passed today, is that good? It’s impossible to know unless you can also see what percentage of tests passed two weeks ago or two months ago. Because TFS maintains historical data about a development project, then makes it accessible via reports, the people in charge of a project can
have a broader, more accurate view of its progress. And because TFS collects much of this data
automatically, keeping track of code check-ins, builds, and more, project managers need no longer harass team members for status reports, then cut and paste the results.
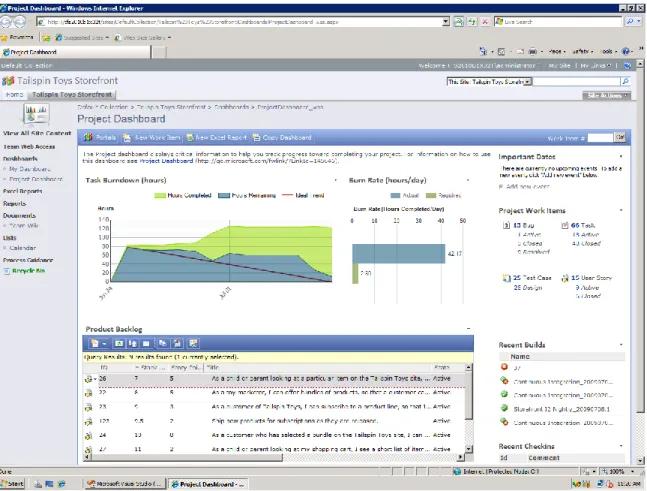
Dashboards are created with SharePoint, and so they’re accessed through the team project portal. As usual with SharePoint, a dashboard can be customized, letting team members display information from outside the TFS world such as important upcoming events. Both the Agile and CMMI process templates provide predefined dashboards, including Bugs, Build, Quality, Test, and Project. The templates also include an option called My Dashboard, which gives each team member a customized view showing just his tasks, his bugs, and other information that’s relevant solely to him. Figure 5 shows an example of the Project dashboard for an agile development project.
Figure 5: The Project dashboard displays the task burndown, product backlog, recent check-ins and builds, and other information about the current iteration of a development project. This dashboard lets its user see several important metrics for the current iteration of an agile project, including a burndown chart showing the team’s progress, the product backlog, the status of relevant work items, and recent code check-ins and builds. Most of the information in this dashboard is drawn from TFS. Much of it, including the status of project work items and recent check-ins/builds, is created
automatically. Because all of these aspects of the development process are handled in a unified server, creating accurate, timely status displays is straightforward. This is one of the primary benefits of a unified tool set like Visual Studio 2010.
USING VISUAL STUDIO 2010
Team Foundation Server and the other components of Visual Studio 2010 provide a great deal of functionality. To understand what these tools offer, it’s useful to walk through each of the activities in a typical development process: managing requirements; architecting a solution; developing code; testing code; and managing and tracking the project. It’s also important to think about maintenance, which often consumes more money than a project’s original development. This section looks at each of these areas, highlighting some of the most important aspects of this product family.
MANAGING REQUIREMENTS
Requirements are the backbone of a software development project. They drive the design and development, they determine what tests are done, and they’re fundamental to deciding when the software is ready to ship. Given this central role, managing requirements effectively is important. In Visual Studio 2010, requirements are stored as work items in TFS. The product doesn’t specify how requirements should be gathered, however. One common solution is to record requirements using Microsoft Word or another tool. Third party products, such as TeamSpec from TeamSolutions, provide add-ins that allow requirements gathered in Word to be automatically synchronized with requirement work items in TFS. Another option is to use SketchFlow, a tool included with Microsoft’s Expression Blend, to create quick sketches of user interfaces. Because these interface prototypes let people see what an application will look like, they can help in understanding a project’s requirements.
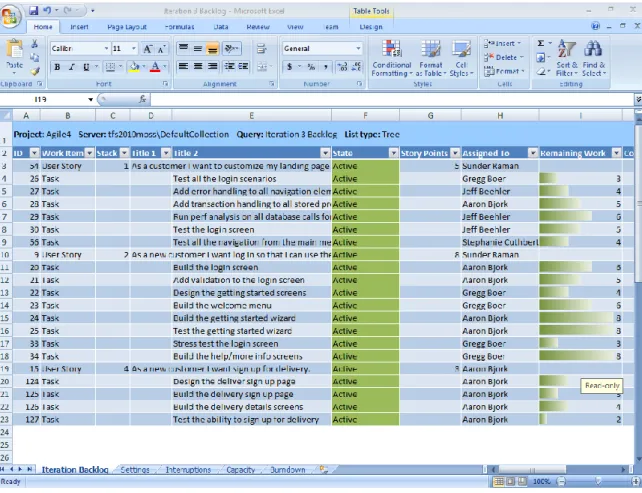
However they’re gathered, requirements stored in TFS can be used in several different ways. A primary goal of Visual Studio 2010 is to provide requirements traceability, connecting requirements with other aspects of development throughout a project’s life. As mentioned earlier, requirements can be connected with other work items such as tasks and test cases to make this possible. These connections let team members do things like determine which requirements don’t yet have test cases, figure out who’s responsible for the tasks necessary to meet a given requirement, or decide what tests to work on today. To work with requirements and the work items they’re connected to, the people on a development team have a number of options. A developer might choose to use the Visual Studio IDE to see which bugs are associated with a specific requirement. A tester can use Microsoft Test Manager to display the tests for that requirement. A business analyst might prefer to see requirements via Excel, letting her list the tasks associated with each one, as Figure 6 shows.
Figure 6: A business analyst might use Excel to work with requirements (user stories) and associated tasks stored in TFS.
This example shows an Excel spreadsheet containing several requirements (user stories), their associated tasks, owners, and other information. The analyst can modify these or create new ones directly in Excel, then store her changes back to TFS. The point is that different people want to work with requirements through different tools, and so Visual Studio 2010 allows them to be accessed in several different ways. The overarching goal is to allow requirements traceability throughout the development lifecycle. By associating requirements with tasks, testing, and other parts of the process, and by making this
information accessible through a variety of tools, Visual Studio 2010 aims at making it easier for teams to build the right software.
ARCHITECTING A SOLUTION
Before writing any code, the people responsible for building a new application usually start by thinking about its structure. What parts should the application have? What should each one do? And how should those parts fit together? Once code actually exists, they ask more questions. What does this class look like? What other classes is it related to? What’s the sequence of calls from this method?
All of these questions lend themselves to visual answers. In every case, creating diagrams that show what’s going on can be the clearest path to understanding. Accordingly, Visual Studio 2010 contains tools for creating and working with diagrams that address all of these questions.
These tools and the questions they address are sometimes lumped under the heading of “architecture”. It’s equally useful to see them as ways to visualize solutions, leading to better understanding and stronger designs. Whatever view one takes, visual tools can be useful. This section takes a look at what Visual Studio 2010 provides in this area.
Designing Code: UML Modeling
One common way to think and talk about an application’s behavior is by using the Unified Modeling Language (UML). To allow this, Visual Studio 2010 provides tools for application modeling with this popular language. These tools support five of the most common UML diagrams: Class, Sequence, Use Case, Activity, and Component.
Once they’re created, UML elements can be linked to work items in TFS. For example, an application architect might create a use case diagram, then link that use case with a work item containing the specific requirement this use case applies to. As usual, the requirement work item can then be linked with test cases, tasks, and other TFS work items. This can make it easier for the architect and other members of the development team to navigate more intelligently through the sea of information about this application and the process used to create it.
Controlling Code: Layer Diagrams
Grouping related responsibilities into clearly defined parts of the code makes sense. One obvious example of this is the division between user interface, business logic, and data in a multi-tier application. But these sharply defined boundaries aren’t useful solely for design; enforcing them also makes code more
maintainable. Knowing that a change in, say, the user interface tier won’t affect the data tier eliminates one more risk in making that change.
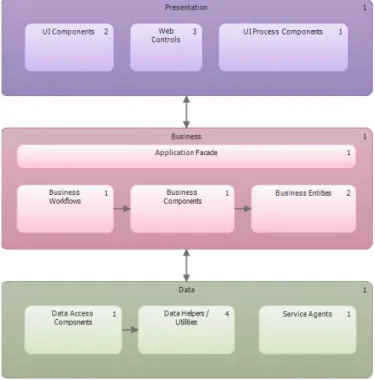
To help define and enforce these boundaries, Visual Studio 2010 provides layer diagrams. An architect or developer can create a layer diagram, then associate different parts of the application with each layer by dragging and dropping a project or class file into it. Figure 7 shows a simple example.
Figure 7: A layer diagram allows grouping code into layers, then enforcing rules about how the code in those layers interacts.
This diagram defines three layers: Presentation, Business, and Data. Each layer contains specific chunks of code, such as namespaces, classes, and methods. Dependencies across layer boundaries are constrained, as the figure suggests. And just to be clear: The Presentation/Business/Data split shown here is a good example, but the creator of a layer diagram is free to define any layering structure he likes. The tool isn’t limited to this simple three-tier model.
These diagrams aren’t just pretty pictures. A layer diagram can be used to validate the rules it contains, making sure that code conforms to the diagram’s constraints. It’s even possible to make this validation automatic, such as by using gated check-in to prevent checking in code that violates the layer constraints. The goal is to help maintain the application’s original design, making maintenance easier and cheaper by preventing the architectural drift that can occur over time.
Understanding Code: Sequence Diagrams and More
Along with the tools just described, Visual Studio 2010 contains a few more options for working with code visually. For example, a developer can generate a UML Sequence diagram for any C# or Visual Basic (VB) method directly from source code in the Visual Studio IDE. This diagram shows what methods are called, what methods each of those methods calls, and so on, to a depth specified by the developer. These diagrams can be helpful for understanding what the code is doing and for finding ways to optimize that code.
Visual Studio 2010 also contains a Class Designer that can create a UML Class diagram directly from code, and vice-versa. Changes to the class diagram are reflected in the code, while changes to the code are reflected back to the diagram. The goal is to help developers more easily work with and understand an application’s class structure.
Finally, Visual Studio 2010 contains the Architecture Explorer. As its name suggests, this tool lets a developer explore an existing .NET code base visually. While it’s useful in various scenarios—imagine getting a new team member up to speed, for example—it’s probably most useful during maintenance, and so it’s described later in this paper.
Creating useful tools for architecture, visualization, and design isn’t easy—different people want different things. (In fact, the graphical designers for modeling applications, systems, and deployment that were in Visual Studio Team System 2008 Architecture Edition have been removed in Visual Studio 2010.) The tools described here are meant to be practically useful, helping everybody on a development team create and understand their code more easily.
WRITING CODE
Once requirements have been gathered and at least some design has been done, it’s time to start writing code. Visual Studio was originally created more than a decade ago to support this part of the
development process, and it’s still a critical aspect of what the tool family provides.
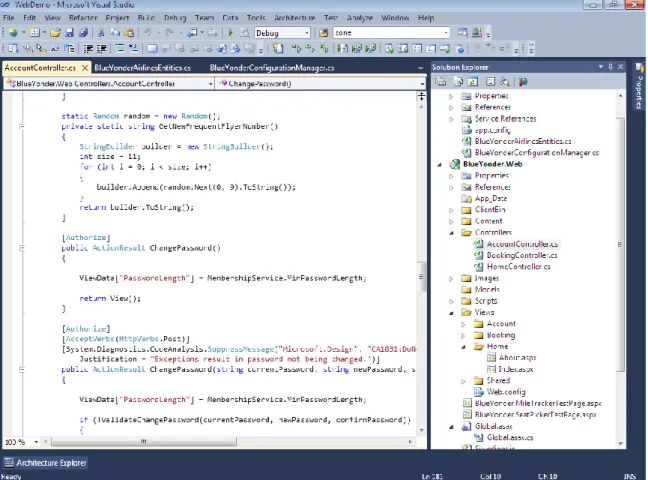
Like every IDE, Visual Studio 2010 provides a graphical interface for developers. Figure 8 shows a simple example.
As the figure suggests, the tool provides what a modern developer expects from an IDE, including a straightforward mechanism for managing code and configuration files, along with the ability to show different parts of the code in different colors. The Visual Studio 2010 IDE also supports using multiple monitors, with different parts of the interface shown on different screens.
This same user interface can be used to write code in any of the languages provided with Visual Studio 2010, including:
C# and Visual Basic, languages with different syntaxes but very similar functionality. Both produce managed code, i.e., code based on the .NET Framework’s Common Language Runtime (CLR).
F#, a Microsoft-created language supporting functional and object-oriented programming. It also produces managed code.
C++, which can produce both managed and unmanaged (i.e., native) code. Many projects in many organizations use C++, and Visual Studio 2010 contains various enhancements aimed expressly at C++ developers.
JScript.NET, Microsoft’s extended version of ECMA-262 (commonly known as JavaScript). This language produces managed code, but Visual Studio 2010 also supports creating standard JavaScript that runs in any Web browser.
Developers can also add other languages to the Visual Studio IDE. Microsoft provides IronPython and IronRuby, for example, CLR-based versions of Python and Ruby. Other vendors offer languages as well, such as COBOL from Micro Focus.
Whatever language a developer chooses, he creates a project to contain his work. Visual Studio 2010 provides a range of built-in project types, including projects for creating a WPF application, a Windows Service, a Class Library, various kinds of ASP.NET applications, test projects, modeling projects, and many more. One or more projects of different types can be combined to create a solution. For example, a solution might contain a project for an ASP.NET application containing code, a modeling project with UML diagrams describing that application, and a test project with tests for that application.
Supporting Software Development
Visual Studio 2010 allows developers to create applications for various versions of the .NET Framework, an ability that Microsoft calls multi-targeting. It also provides toolkits (with their own project types and more) for building software on various Windows-based platforms. They include the following:
Microsoft Visual Studio 2010 SharePoint Developer Tools for customizing SharePoint sites or creating wholly new applications built on SharePoint.
Office Developer Tools for creating applications that use or extend Excel, Word, PowerPoint, InfoPath, Outlook, Project, or Visio.
Windows Azure Tools for Visual Studio, helping developers create cloud-based applications for the Windows Azure platform.
Developers can also download other software that runs inside the Visual Studio 2010 IDE, such as
development tools for Windows Phone 7. Along with these toolkits, Visual Studio 2010 includes a number of specialized designers for working with various technologies, regardless of the application type that’s being created. Here are a few examples:
The WPF and Silverlight Designer, a graphical tool for creating and working with XAML user interfaces.
The Workflow Designer for creating applications that use Windows Workflow Foundation. The XML Schema Designer, a graphical tool for working with XML schemas defined in XSD. The Object Relational (O/R) Designer, a graphical tool for creating a LINQ to SQL object model mapping for SQL Server data.
The HTML Designer, a graphical tool for creating and working with HTML documents. Visual Studio 2010 supports other aspects of modern software development as well. For example, as multi-core machines become ubiquitous, writing code that exploits this processing power becomes essential. To help developers do this, the Visual Studio 2010 IDE provides parallel computing libraries and debugging options for creating parallel applications.
Writing code, the most basic aspect of software development, can be hard. Writing good code is even harder, and so Visual Studio 2010 provides a number of additional features to help developers improve their code. Among them are these:
Support for refactoring, which allows improving the structure, readability, and quality of code without changing what that code does.
Static code analysis, which examines code for compliance with the Microsoft .NET Framework
Design Guidelines or other custom-defined rules. For example, this analysis can help warn developers when they’ve left security holes that allow SQL injection attacks and other threats.
Dynamic code analysis, including performance profiling and code coverage. Performance profiling
lets a developer see how a running application (including parallel applications) divides its time across its methods, track the application’s memory usage, and more. Code coverage shows what parts of an application’s code were executed by a specific test, allowing the developer to see what’s not being tested.
Code metrics, a set of measurements calculated by Visual Studio 2010. They include simple things
like the number of lines of code, along with more complex metrics such as cyclomatic complexity and a maintainability index. Since complex code is both harder to maintain and more likely to contain errors, having an objective measure of complexity is useful.
Supporting Database Development
Software development is more than just writing application code. Working with a database is also an important part of most projects. As always, tools can make this work easier.
The Visual Studio 2010 IDE allows creating database projects for working with SQL Server, much like the projects used for Windows applications. The tool also includes project types for creating applications that use the SQL CLR. And to help developers create databases and the code that uses them, the Visual Studio IDE includes visual designers for tables, queries, views, and other aspects of database development. Like any other projects, these database projects can use the source code control and build management functions provided by TFS. For instance, a database project can help manage changes to a database’s schema by putting it under version control. Visual Studio 2010 also provides support for tracking dependencies between database objects, refactoring database objects, database deployment, and other aspects of database change management.
Supporting Developer Testing and Debugging
Along with writing code, every developer does testing and debugging. It’s common today, for example, for a developer to create unit tests for the code she writes. Each unit test runs against a specific component, such as a method, verifying one or more assumptions about the behavior of that component. Unit tests are commonly automated, which lets a group of unit tests be run easily whenever changes are made. (In fact, the build verification tests run by Team Foundation Build are most often unit tests.) To support this, Visual Studio 2010 provides a unit testing framework. It’s also possible to use other unit testing
frameworks with Visual Studio 2010, such as NUnit, although much of the integration with the rest of this product family is lost.
As just described, many applications also rely on logic embedded in a database, such as triggers and stored procedures. Like code running outside the database, this logic can benefit from unit tests. To help do this, Visual Studio 2010 provides support for creating database unit tests. The product also includes data generators to help create realistic test data for a database or to sanitize existing data by removing sensitive or private information.
Visual Studio 2010 provides other support for testing by developers as well. For example, it’s increasingly common to write tests before all the code those tests will exercise has been written. Doing this typically requires generating stubs, something that Visual Studio 2010 can do automatically with an option called
Generate from Usage. A developer can ask the tool to generate a stub for a class, method, field, or other
identifier, making it easier to use a test-first development style.
An essential part of creating good code is having effective tools for debugging. The Visual Studio 2010 IDE includes a debugger, of course, but the product also provides a technology called IntelliTrace. Using this option, it’s possible to create a trace of an application either during testing (as described later) or by running the application directly from the Visual Studio IDE. This trace provides a series of very detailed snapshots of the running application that the developer can load into the debugger, then use to replay its execution. It’s even possible to move back and forth in the running application, getting a detailed look at exactly what’s happening throughout. The goal is to provide a clear view into the code as it runs, making it easier to identify what’s wrong.
A developer can also get other information about his code while it’s being tested. For example, he can determine which tests need to be run to verify changes he’s made, something known as test impact
analysis. Rather than running a complete test suite after every change, this knowledge lets the developer
Working with Project Information
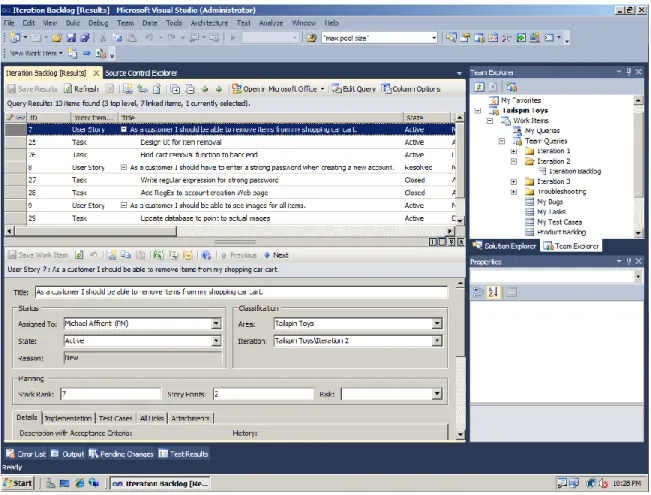
The information TFS holds about a project—requirements, tasks, bugs, and everything else—needs to be accessible by every member of the development team, regardless of the tools they use. To let developers work with this information in a natural way, Team Explorer can run inside the Visual Studio 2010 IDE. Figure 9 shows an example of how this looks.
Figure 9: Using Team Explorer from inside the Visual Studio 2010 IDE lets developers work with requirements, tasks, bugs, and other TFS information.
In this example, current requirements (user stories) are shown at the top, along with the tasks associated with each one. User story 7 has been selected, and so its details are shown below: who it’s assigned to, the state it’s in, and other information. The pane in the upper right shows other TFS data that the developer can access under headings such as “My Bugs”, “My Tasks”, and “My Test Cases”. The goal is to provide a useful window into the diverse information available in TFS about this development project.
TESTING CODE
Testing is an essential part of the development process. There’s lots to do and plenty of information to keep track of. Some tests, such as unit tests, are typically created by developers. Yet much of testing is done by dedicated testers. Testing is a discipline in its own right, and testers play a critical role in most development teams.
Some testers are essentially developers who focus on testing. In many cases, the tests these developers create are automated, making it easy to run them over and over as code changes. Yet while automated testing is important, it’s not always the right solution. Writing test code costs money, so a test that’s run infrequently might not be worth automating. (In fact, seeing a positive return on the investment in creating an automated test suite might take years.) And what if the application is changing frequently? Constantly rewriting automated tests to match volatile code might not be worthwhile.
Given these realities, manual testing—exercising an application through its user interface—will always remain an important part of the story. Besides, really testing the user experience is hard to do with automated tests. Manual testing is often more effective at finding the bugs that bother users the most. Providing solid support for both automated and manual testing is a primary goal of Visual Studio 2010. In both cases, effective test tools can make the job easier and more efficient. In Visual Studio 2010, these tools include the following:
Ways to gather the results of running tests, including diagnostic data to help determine the cause of failures.
A tool for creating and managing test plans.
Software for creating, configuring, and deploying virtual machines for use in a test environment. Support for manual testing, including things such as the ability to record and automatically play back a manual test.
Support for automated testing, including load tests.
All of this technology can be used together, or pieces can be used on their own. Whatever approach an organization chooses, the place to begin understanding this world is with the basics: how test results and diagnostic data are gathered.
Gathering Test Results and Diagnostic Data
The most fundamental aspect of testing is running a test, then getting the results. This can seem
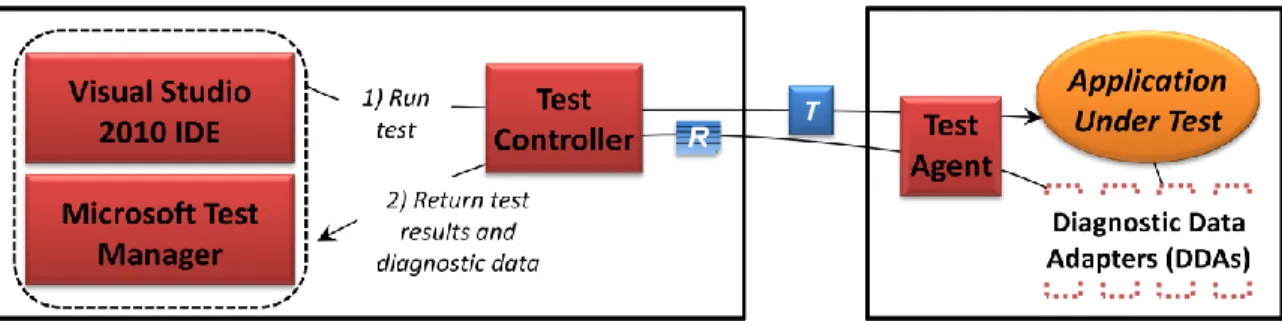
mundane, but it’s not. Determining when a test has failed might be straightforward, but what information should the tester provide to the developer to help fix the bug this test has discovered? Just indicating that the test failed isn’t enough—the developer might not even believe the tester, especially if the developer can’t reproduce the bug on his own machine. What’s needed is a way for the tester to supply enough information for the developer to understand the bug, then figure out and fix the underlying problem. To do this, the test environment needs to provide mechanisms for gathering a range of information about the application under test. Visual Studio 2010 does this with diagnostic data adapters (DDAs). Figure 10 shows how they fit into the test environment.
Figure 10: When running a test from the Visual Studio IDE or Microsoft Test Manager, a tester can rely on one or more diagnostic data adapters to collect data about that test.
As the figure shows, a test might be run either from the Visual Studio 2010 IDE or from Microsoft Test Manager (step 1). Here, the test is sent to a test controller which then sends it to a test agent running on the same machine as the application under test. As Figure 10 shows, this application is monitored by one or more DDAs while it’s being tested. The diagnostic data those DDAs produce and the test results are returned to the tester (step 2).
Each DDA collects a specific kind of information, and the tester can select which DDAs are used for a particular test. Some examples of DDAs provided with Visual Studio 2010 are the following:
Action Recording: Produces a recording containing all of the steps executed in a manual test. This log can be played back to re-run the test or used in other ways.
ASP.NET Profiler: Provides profiling data for ASP.NET applications, such as a count of how much time was spent in each method.
Event Log: Collects information written to event logs during the test. It can be configured to collect only specific event logs and event types.
IntelliTrace: Creates a detailed trace of the application’s execution. As described earlier, a developer can use this trace to replay the execution of a test in the Visual Studio 2010 IDE’s debugger, providing a window into exactly what was happening when a bug appeared.
Test Impact: Keeps track of which methods in the application were invoked by a test case. This DDA provides the raw material for the test impact analysis described earlier
Code Coverage: Provides statistics about what percentage of the code was covered by one or more tests. As its name suggests, it provides the base information used by the code coverage option described earlier.
System Information: Provides a description of the machine on which the test is run, including its CPU, memory, installed patches, and more.
Video Recorder: Records a video of a computer’s desktop on which a test is being run.
Different DDAs make sense for testing different parts of an application. For example, the Video Recording DDA makes sense when testing an application’s user interface, while the ASP.NET Profiler (obviously) is useful while testing ASP.NET code on a server. Other DDAs, such as IntelliTrace, Code Coverage, and Test Impact, make sense for testing business logic in general, and System Information should probably be
turned on for every test. If the options supplied with Visual Studio 2010 aren’t sufficient, it’s also possible to create custom DDAs. In fact, a variety of DDAs are available from third parties, including options for non-Windows environments.
Whatever DDAs are used, the goal is the same: providing enough data about a bug so that a developer can resolve the issue. Rather than having testers find bugs in the test environment, then have developers be unable to reproduce those bugs, the detailed information collected by test agents and DDAs can be filed with the bug report in TFS. Providing this fine-grained data significantly increases the likelihood of a developer recreating and fixing a bug the first time it’s found by a tester.
A Tool for Testers: Microsoft Test Manager 2010
Running tests from the Visual Studio IDE is fine for development-oriented testers. For many testers, however, a developer tool isn’t the best option. To support these people, Visual Studio 2010 includes Microsoft Test Manager (MTM). This tool is designed explicitly for testers, especially those who don’t need to edit code. One obvious indication of this is the MTM user interface: It’s not based on the Visual Studio IDE. Instead, the tool provides its own interface focused explicitly on the tasks it supports. Figure 11 shows an example.
Figure 11: Microsoft Test Manager 2010 is designed expressly for testing—it's not a development tool. MTM supports two distinct activities. One is acting as the client for Visual Studio Lab Management 2010, described in the next section. The other, unsurprisingly, is managing and running tests. Toward this end, MTM lets a tester define and work with test plans. A test plan consists of one or more test suites, each of which contains some number of automated and/or manual test cases. A test plan can also specify the
exact configuration that should be used for the tests it contains, such as specific versions of Windows and SQL Server. All of this information is stored in TFS using the Test Case Management functions mentioned earlier.
Test suites can be used in various ways. For example, each of an application’s requirements (or user stories) might have its own test suite aimed at testing just code that addresses that requirement. In Figure 11, for instance, the highlighted requirement is associated with the test suite shown on the right.
MTM also lets a tester examine the output created by running tests. These results are associated with a specific test plan, allowing the output from all the test cases in that plan to be grouped together. And once again, this information is stored in TFS, making it available to the development team and other interested parties.
Managing Test Lab VMs: Visual Studio Lab Management 2010
Testing software requires machines on which to run that software. Those machines must replicate as closely as possible the eventual production environment. Traditionally, testers have done their best to replicate this environment with the physical machines on hand. While this approach can work, it’s often simpler and cheaper to use virtual machines instead. VMs are easier to create and to configure into exactly what’s required. Think about testing a multi-tier application, for example, where the user interface, business logic, and database all run on separate machines. Realistic tests for this application require three machines, something that’s usually easier to do with VMs.
To help organizations create and manage VM-based test labs, Visual Studio 2010 includes Visual Studio Lab Management. This software is accessed via MTM’s Lab Manager activity, as Figure 12 shows.
Figure 12: Visual Studio Lab Management 2010 allows creating and managing a VM-based test and development lab.
As the figure shows, Lab Management relies on System Center Virtual Machine Manager (VMM) 2008, which is included with this part of the product. VMM allows defining templates for virtual machines, then creating multiple Hyper-V-based VMs from a single template. Using Lab Management, a tester can create templates for each of the hardware and software configurations an application must run in, then create VMs from these templates as needed. A template might be pre-configured to contain the software a particular application depends on, such as SQL Server or Internet Information Services (IIS). It might also be configured to contain a test agent, making VMs created from it easier for a tester to use.
Putting the Pieces Together: A Testing Scenario
To see how all of these parts can be used together, it’s useful to walk through a scenario. Figure 13 shows the first steps.
Figure 13: A tester can use Lab Management to create VMs for testing an application, then define a test plan for that application with Test Case Management.
This example begins with a tester using the Lab Manager activity in MTM to request new VMs from Visual Studio Lab Management (step 1). The templates used to create those VMs are pre-configured to contain a test agent, which means they’re ready to be used for testing. The software being tested is a Web
application, so three separate VMs are created, one for each tier of the application. Next, the tester uses MTM to create a test plan, storing it in TFS Test Case Management (step 2). Once the test plan is ready, testing can begin. Figure 14 illustrates this part of the process.
Figure 14: Once a new build is deployed, a tester can run test cases from MTM, then access the results and DDA-generated diagnostic data produced by those tests.
Since the goal is to test a specific build of the application, that build must first be created and deployed (step 1). As the figure suggests, Team Foundation Build can deploy a new build to the VM-based test environment as part of an automated build process. The tester can then use MTM to run test cases from the test plan (step 2) against this build. Each test is sent to a test controller, which distributes it to the test agents. These test agents run each test, using appropriate DDAs to gather diagnostic data (step 3). As described earlier, different DDAs are probably used in each of the three VMs, since each is testing a different part of the application. The Video Recording DDA might be used in the VM running the
application’s user interface, for example, the IntelliTrace, Code Coverage, and Test Impact DDAs might be used in the VM running the middle -tier business logic, and just the Event Log DDA might be used in the VM running the database. When the tests are completed, the test results and diagnostic data are sent back to TFS via the test controller (step 4). The tester can now use MTM to access and examine this information (step 5).
When a bug is found, the tester can submit a report directly from MTM. A description of the issue, together with whatever diagnostic data the tester chooses, is stored in TFS for a developer to use. When Lab Management is used, as in this example, it’s even possible for a tester to submit a bug report that links to a snapshot of the VM in which the bug was detected. Because the bug report contains so much supporting information, the developer responsible for the code being tested is significantly more likely to believe that the bug is real. Just as important, that developer will have what she needs to find and fix the underlying problem.
In this scenario, the tests run in step 2 might be either manual or automated. Both testing styles are important, and so Visual Studio 2010 provides support for both. The next sections look at each approach, beginning with manual testing.
Supporting Manual Testing
Manual testing, where someone sits at a screen exercising an application, is an inescapable part of software quality assurance. This kind of testing might be done in an exploratory fashion, or it might require the tester to follow a rigidly specified set of test scripts. In either case, a large part of an application’s tests are often manual.
A primary purpose of Microsoft Test Manager is to support manual testing. Along with the user interface shown earlier for test management, MTM also provides an interface for running manual tests. Sometimes referred to as Test Runner, an example of this interface is shown in Figure 15.
Figure 15: Microsoft Test Manager, shown docked to the left of the application under test, provides a user interface for running manual tests.
The UI of the application under test is shown on the right, allowing the tester to interact with it. The pane on the left lists the steps in the manual test currently being performed. The green circles in this pane mean that the tester has marked this step as successful. A red circle appears at step 6, however, indicating that the tester believes this step has failed. The tester can now file a bug report directly from Test Runner. And because manual tests use the Visual Studio 2010 testing infrastructure described earlier, any of the diagnostic data provided by the DDAs, including IntelliTrace, can be included with this bug report.
Some DDAs are especially useful with manual tests. The Action Recording DDA, for instance, creates a log of the actions performed in a test. This action log contains everything the tester actually did, including details such as mouse hovers. This fine-grained information lets a developer see exactly what steps the tester went through and so can be quite useful in replicating the bug. The action log can be included as part of a bug report, perhaps accompanied by a video of the tester’s screen.
An action log can also be used sometime later by the tester to automatically step through just part of the test. This option, referred to as fast forward for manual testing, lets a tester (or a developer) move quickly to a later part of the test rather than laboriously working through every step to get where she needs to be. For example, a tester who wishes to test an application’s behavior deep into a series of screens can rely on this facility to zip quickly through the navigation required to get there.
Supporting Automated Testing
While manual tests are important, automated testing—software that tests other software—is also useful. Automated tests can only be created with the Visual Studio IDE—they can’t be created using MTM. They can be run in various ways, however: from the IDE, from MTM, or by Team Foundation Build as part of the build process.
Because there are a variety of things to be tested, Visual Studio 2010 has built-in support for several types of automated tests. Figure 16 illustrates some of the most important options.
Figure 16: Visual Studio 2010 supports several kinds of automated tests. The kinds of automated tests supported by Visual Studio 2010 include the following:
Unit tests: As described earlier, a unit test verifies specific behavior in a particular component of
an application. Unit tests are typically created by the developer who writes the code being tested.
Database unit tests: These are unit tests aimed specifically at aspects of an application’s
Web performance tests: An effective way to test the functionality of a Web application is to send
HTTP requests directly to the application’s business logic. This is exactly what Web performance tests do. Typically built by testers, these tests can be defined manually using Visual Studio 2010’s
Web Test Editor, or (more likely) created automatically by using the product’s Web Test Recorder
to record HTTP requests made from a browser.
Coded user interface (UI) tests: Sometimes referred to as UI test automation, a coded UI test is
software that executes actions directly against an application’s user interface, then verifies that the correct behavior occurs. Coded UI tests are typically created by a tester recording the manual actions she takes against an application’s UI, then letting Visual Studio 2010 generate code to replicate those actions. The product also provides support for validating a test’s result, such as checking that a particular text box in the UI should contain a specific value.
There’s one more important category of automated testing to describe: load tests. A load test is intended to simulate how an application performs when it has many users, and it’s typically composed of a group of Web performance tests. Figure 17 illustrates how Visual Studio 2010 provides load testing.
Figure 17: In load testing, multiple test agents submit Web performance tests against an application's business logic, simulating the behavior of many simultaneous users.
As the figure shows, load testing relies on a test controller and one or more test agents, each of which runs on its own physical machine. The controller parcels out Web performance tests among the test agents. Every test agent then submits its tests to the application. The result helps the tester understand how this application will behave under the load created by many users.
To simulate large numbers of users, an organization can buy one or more copies of the Visual Studio Load Test Virtual User Pack 2010. Installed on the test controller, as Figure 17 shows, each pack represents 1,000 virtual users. If a load test needs to see how an application behaves with 3,000 users, for example, the tester needs to install three Load Test Virtual User Packs.
Whether it’s manual or automated, testing is a critically important part of creating applications. By providing a common foundation for both that provides lots of information about bugs, Visual Studio 2010 aims at improving the quality of applications. Not incidentally, it also aims at improving the lives of the people who test those applications.
MANAGING AND TRACKING A PROJECT
Whatever stage a project is in, the people involved need to know what’s going on. Perhaps a project manager is concerned with keeping the work on schedule, or maybe the project is using Scrum, with the ScrumMaster playing a coordinating role on a self-organizing team. Whatever the situation, the people involved must manage and track the work. As already described, Visual Studio 2010 provides reports, dashboards, and more aimed at doing this. It’s worth taking a closer look at two specific areas, however: the beginning of a project and its end.
Pretty much every project (and every iteration) starts with planning. Plans are typically based on requirements, which are stored in TFS. A project manager might use Microsoft Project to read those requirements directly from work items. She can then use this tool to plan a schedule for the effort, as Figure 18 shows.
Figure 18: Microsoft Project can read work items such as requirements and tasks directly from TFS, then let a project manager construct a schedule.
The project manager can use familiar techniques, such as the Gantt chart shown here, to plan the project’s schedule, with the requirements and tasks drawn directly from TFS. For project managers who prefer Excel, Visual Studio 2010 provides other options. For example, the Agile process template includes an Excel workbook designed expressly for planning an agile project and the iterations (sprints) within that project. As always, the information this workbook uses is synchronized with TFS.
Projects start, and projects eventually end. Assuming a project ends successfully, the software must be handed over to the customer. But when is it ready to ship? How can a team know when it’s time to release their work? One obvious metric is fulfilling enough of the project’s requirements, but another is quality, something that’s harder to judge accurately. To help with this, both the Agile and CMMI process templates provide a Quality dashboard that presents relevant information from TFS. Figure 19 shows an example.
Figure 19: The Quality dashboard gives a view into several quality-related metrics for a project. This dashboard provides a window into important metrics for project quality over a specific period, such as the previous month. Those metrics include the following:
Test Plan Progress: Shows the team’s progress in running test cases defined in test plans created with Microsoft Test Manager.
Build Status: Shows the number of builds that succeeded or failed.
Bug Progress: Shows the number of bugs, broken down by status: Active, Resolved, or Closed. Shippable code quality needn’t mean zero bugs, but a continually rising count of active bugs doesn’t bode well for quality.
Bug Reactivations: Shows how many bugs that were previously marked as Resolved or Closed have been reactivated. If this number is rising, the quality of the team’s bug fixes probably isn’t very high.
Code Coverage: Shows the percentage of code tested by build verification tests and others. Code Churn: Illustrates how many lines of code were added, deleted, and changed in check-ins to TFS version control. This is another useful quality measure, since the total should be heading down as a project nears its end.
Using this dashboard, project managers, ScrumMasters, and others—even the customer—can better understand the team’s progress. Rather than seeing individual bits of data in isolation, they can see the totality of a project’s state and thus make better decisions. This information can also help in determining when the product they’re building is ready to ship. Different projects have different standards: A team building a community Web portal probably has a lower quality bar than, say, one building an online ordering system for a major retailer. Yet whatever the group’s risk tolerance, they need data to make a good decision. The Quality dashboard is one example of how Visual Studio 2010 provides this information.
MAINTAINING CODE
Releasing the results of a development project doesn’t mean that there’s no work left to be done. If the software that’s been created has any value, it will stick around for a while, and it’s bound to require changes. Maybe the people who use it have ideas for improvement, or perhaps the business process it’s part of needs to change in some way. Whatever the reason, applications require maintenance.
To a great degree, the tools used for development are also appropriate for maintenance. Still, there are unique challenges that show up in this part of an application’s lifecycle. For example, the people who do maintenance work often aren’t the original developers. A fundamental challenge for these people is to understand the application’s code base. The conventional way to do this is by brute force: just sit down and read the code. Yet understanding the complicated interactions and dependencies in even a moderately sized code base can be very difficult. Besides, we are visual creatures—why not use a graphical tool to help?
Toward this end, Visual Studio 2010 includes the Architecture Explorer. This tool gives its user a window into the structure of existing C# and Visual Basic code. By generating dependency graphs that show how various parts of an application work with each other, the Architecture Explorer can help developers and architects understand what the code is doing. Figure 20 shows an example.
Figure 20: A dependency graph illustrates the relationships among different parts of an application's code.
This example shows a dependency graph focused on an assembly called PetShopWeb.dll. This assembly contains the namespace PetShop.Web, which itself contains a number of other types. The connections between these types are shown as gray lines, with the thickness of each line representing the number of interactions between each pair. As the dialog box in the upper left shows, the user has searched for methods whose name contains the word “Submit”, and the Architecture Explorer is showing one match: a method in the UserProfile type.
As the diagram suggests, the tool is interactive. A user can zoom in and out of the dependency graph, choosing different granularities. For example, a developer new to this application can get a broad view by starting at the assembly level, then zoom in to examine a particular assembly in detail (which is the situation shown in Figure 20). She might then zoom further in to look at a particular class and the other classes it depends on. Having this understanding of dependencies can help mitigate the risk of making a change to the code, since it’s easier to trace the impact a change might have.
While it’s always possible to acquire the same knowledge by reading the source code, starting with a visual approach is likely to speed up the process. And given the importance—and the cost—of maintaining software, providing tools to help makes sense.
ADOPTING VISUAL STUDIO 2010
Visual Studio 2010 has many pieces, and different development teams will choose different configurations. Adopting this tool set requires understanding at least the basics of how Microsoft packages the product. It also requires thinking about how to migrate to this new world from what’s already in place. This section looks at both of these issues.
DECIDING WHAT TO BUY
As is probably obvious by now, Visual Studio 2010 contains lots of functionality. This functionality is divided across several different software components, as was shown back in Figure 1. Microsoft groups these components into a variety of different products, commonly referred to as stock-keeping units (SKUs). Figure 21 lists the primary SKUs for Visual Studio 2010, showing the components in each one.
Figure 21: Each SKU for Visual Studio 2010 includes a specific set of components. Some comments on this diagram:
While TFS is shown in the figure as part of three Visual Studio 2010 IDE SKUs (Professional, Premium, and Ultimate) and Test Professional, it’s actually provided in the MSDN subscription. It’s possible to buy the IDEs without this subscription (and thus without TFS) or to buy TFS on its own.
Recall that Lab Management is implemented as part of TFS and that it requires the Lab Management client contained in Microsoft Test Manager. Because of this, the Lab Management 2010 SKU must be used together with both TFS and a SKU that includes MTM.