HAL Id: insu-02984568
https://hal-insu.archives-ouvertes.fr/insu-02984568
Submitted on 25 Nov 2020
HAL is a multi-disciplinary open access archive for the deposit and dissemination of sci-entific research documents, whether they are pub-lished or not. The documents may come from teaching and research institutions in France or abroad, or from public or private research centers.
L’archive ouverte pluridisciplinaire HAL, est destinée au dépôt et à la diffusion de documents scientifiques de niveau recherche, publiés ou non, émanant des établissements d’enseignement et de recherche français ou étrangers, des laboratoires publics ou privés.
Xinran Liang, Jeffrey Post, Bruno Lanson, Xiaoming Wang, Mengqiang Zhu,
Fan Liu, Wenfeng Tan, Xionghan Feng, Guomin Zhu, Xin Zhang, et al.
To cite this version:
Xinran Liang, Jeffrey Post, Bruno Lanson, Xiaoming Wang, Mengqiang Zhu, et al.. Coupled morpho-logical and structural evolution of δ-MnO2 to α-MnO2 through multistage oriented assembly processes: the role of Mn(III). Environmental science .Nano, Royal Society of Chemistry, 2020, 7 (1), pp.238-249. �10.1039/C9EN01000A�. �insu-02984568�
1 2 3 4 5 6 7 8 9 10 11
Coupled Morphological a nd Structural Evolution of
δ-MnO
2to α-MnO
2through
multistage Oriented Assembly
processes: the role of
Mn(III)
Xinran Liang,† Jeffrey E. Post,‡ Bruno Lanson,§ Xiaoming Wang,† Mengqiang Zhu,⊥ Fan Liu,† Wenfeng Tan,† Xionghan Feng,†* Guomin Zhu, Xin Zhang and James. J. De Yoreo
†Key Laboratory of Arable Land Conservation (Middle and Lower Reaches of
Yangtse River), Ministry of Agriculture, College of Resources and Environment, Huazhong Agricultural University, Wuhan 430070, China
‡ Department of Mineral Sciences, Smithsonian Institution, Washington, DC §
20013, USA
University of Grenoble Alpes, CNRS, ISTerre, F-38000 Grenoble, France
12 13
⊥
Department of Ecosystem Science and Management, University of Wyoming, Laramie, WY, 82071, United States.
Physical Sciences Division, Pacific Northwest National Laboratory, Richland, WA99352, USA
14 15
KEYWORDS:
δ-MnO2; α-MnO2; morphology evolution; structure transformation;16 Mn(III). 17 18 19 20 21 22 23 24 25 26 27 4 5 6 7 8 9 10 11 12 13 14 15 16 17 18 19 20 21 22 23 24 25 26 27 28 29 30 31 32 33 34 35 36 37 38 39 40 41 42 43 44 45 46 47 48 49 50 51 52 53 54 55 56 57 58 59 60
ABSTRACT:
The efficient assembly of nanoparticles by oriented attachment 28(OA) mechanism has attracted more and more attention. However, the morphological
29
and structural coupling during the OA processes is not fully understood. Here, we
30
propose the OA mechanism during the layer-based δ-MnO2 transformation to
tunnel-31
based α-MnO2 using powder X-ray diffraction, X-ray atomic pair distribution function
32
and transmission electron microscopy. It is suggested staged three-dimensional OA
33
processes play a vital role in both morphological and concurrent structural evolution of
34
δ-MnO2 into α-MnO2. In the initial stage of the evolution, the δ-MnO2 nanodots are
35
found to spontaneously self-assemble into long nanosheet via OA process along a-b
36
plane driven by hydrogen bonding through edge sites. Meanwhile, the Mn(IV) in the
37
[MnO6] octahedral layers are reduced to Mn(III)/Mn(II) by H2O with the release of O2
38
and oxygen vacancies generation in the δ-MnO2 structure. The newly formed Mn(III)
39
which migrates from layers to above/below the vacancies coordinate with three
40
hydroxide oxygen. Therefore, the adjacent long nanosheets attach with each other
41
driven by hydrogen bonding between hydroxide oxygen which coordinated with
42
interlayer Mn(III) and form primary nanorods through face-to-face OA mechanism
43
along c-axis. Concomitantly, the bonding of [Mn(III)O6] octahedra in interlayer of long
44
nanosheets with adjacent [MnO6] octahedral layers were facilitated to construct the new
45
2 2 tunnel α-MnO2. These findings provide insight not only on mechanism of
46
transformation of layer-based nanoparticles to tunnel-based nanoparticles but also on
47
the efficient controlled synthesis and design of nanomaterials through different
48
structures and morphologies.
49 50 51 52 53 54 55 56 4 5 6 7 8 9 10 11 12 13 14 15 16 17 18 19 20 21 22 23 24 25 26 27 28 29 30 31 32 33 34 35 36 37 38 39 40 41 42 43 44 45 46 47 48 49 50 51 52 53 54 55 56 57 58 59 60
Nonclassical mechanism of crystal growth, oriented attachment (OA), proceeds
57
by repeated attachment events of crystalline particles on specific crystal faces that are
58
lattice-matched with true crystallographic alignment.1 The growth of many crystalline
59
substances, including both engineered nanomaterials and naturally-occurring
60
nanoparticles, has been reported via OA mechanism.2 As OA is a process ofefficient
61
assembly of primary particle units, such bottom-up fabrication can produce the novel
62
materials with the versatile properties. These properties of nanoparticles closely related
63
to not only morphology but also structure. The OA process only leads to morphology
64
evolution by previous reported, while the processes of structure changes associated with
65
morphology evolutions were less explored. Revealing the coupling relationship
66
between morphology evolutions and structure changes during the OA process is not
67
only important for controlling the synthetic materials but also proving a novel idea for
68
the study of crystal growth.3
69
Recently, more and more studies reported that poor crystalline layer manganese
70
oxides (LMOs) nanoparticles assemble to LMOs nanoflower and tunneled manganese
71
oxides (TMOs) nanorod by OA mechanism.4-8 And the LMOs and TMOs are widely
72
applied as materials in catalysis, ion exchange, energy storage and octahedral molecular
73
sieves.9-10 In addition, LMOs-to-TMOs reaction mechanisms have been widely
74
investigated because LMOs association with TMOs occur frequently in the
75
environment.5, 8-10 There are some detailed studies about the structure evolution and
76
limited studies about the morphology evolution during LMOs-to-TMOs reaction,
77
respectively.8, 11The two separate studies on the structure and morphology evolution
78
bring some difficulties in full understanding of the LMOs-to-TMOs reaction
79
mechanism.
80
α-MnO2 represents an important family of TMOs with 2 2 and 1 1 tunnel
81
structure which formed by double chains of edge-sharing [MnO6] octahedra share
82
corners with neighboring chains.12 The larger 2 2 tunnels are generally stabilized by
83
K+, Ba+ and Na+.13 The unique physicochemical properties of α-MnO
2 have given this
84
material a wide range of potential applications in gas sensing, catalysis, energy storage,
85
separation (molecular sieves), and battery materials.14-16 These properties are greatly
86 4 5 6 7 8 9 10 11 12 13 14 15 16 17 18 19 20 21 22 23 24 25 26 27 28 29 30 31 32 33 34 35 36 37 38 39 40 41 42 43 44 45 46 47 48 49 50 51 52 53 54 55 56 57 58 59 60
affected by the structure and morphology of α-MnO2.16
87
The δ-MnO2, as an important LMO, is associated with the α-MnO2 frequently in
88
the environmental.11 It was proposed that formation and migration of Mn(III) occurred
89
during structural transformation of δ-MnO2 into α-MnO2.17 And a detailed OA process
90
by which α-MnO2 long nanorods form from α-MnO2 primary nanorods was also
91
reported.16, 18 However, the formation process of α-MnO2 primary nanorods from
92
poorly-crystalline δ-MnO2 nanodots is not understood.19 In addition, it is unclear how
93
the new tunnel structure formation corresponds with morphology evolution by the OA
94
process. A basic knowledge of the morphology evolution across the whole synthesis
95
process and the relationship with structural transformation are also critical for the
α-96
MnO2 material synthesis in application and understanding of the minerology and
97
behavior of δ-MnO2 and α-MnO2 type minerals in the nature.
98
In this study, Na+/K+-stabilized α-MnO2 nanorods were synthesized by
co-99
precipitation of Na/KMnO4 with MnSO4.The dynamic process of Na+-stabilized
α-100
MnO2 nanorods formation is carefully explored; because the Na phase forms at a slower
101
rate than that of K+-stabilized, as shown in previous experiments.13, it provides a more
102
suitable system for study. During the synthesis, intermediate products were sampled
103
and quenched in liquid N2 at different time intervals to stop crystal growth and capture
104
in-situ morphologies and structures. These intermediate products were examined by
105
powder X-ray diffraction (XRD), pair distribution function (PDF), and X-ray
106
photoelectron spectroscopy (XPS) to investigate the structure changes at the atomic
107
level. Meanwhile, morphological changes during the formation process were revealed
108
by using high-resolution transmission electron microscopy (HRTEM) and
field-109
emission scanning electron microscopy (FESEM). Possible explanations for the
110
observed relationship between morphologic and structural evolutions are proposed.
111
RESULTS AND DISCUSSION
112
2MnO4-+3Mn2++2H2O→5δ-MnO2 +4H+ (1)
113
During the synthesis of δ-MnO2, the amount of MnO4- was in excess compared to
114
the Mn(II) shown in equation 1. Therefore, the supernatant was purple after the two
115 4 5 6 7 8 9 10 11 12 13 14 15 16 17 18 19 20 21 22 23 24 25 26 27 28 29 30 31 32 33 34 35 36 37 38 39 40 41 42 43 44 45 46 47 48 49 50 51 52 53 54 55 56 57 58 59 60
solutions were mixed. After the solution was heated to 100 C for 14 min, the color of
116
the supernatant changed from purple to colorless due to the complete reduction of
117
MnO4- ions under the acidic condition (pH=0.86):18, 20, according to equation 2.
118
4MnO4-+4H+→4δ-MnO2 +3O2+2H2O (2)
119
The reaction rate for formation of δ-MnO2 by equ. 2 is much slower than that of
120
equ. 1.18 The structures and the morphologies ofδ-MnO2 from these two pathways were
121
characterized by XRD and HRTEM, Figure 1 and 3, and appear to be identical.
122
Structural evolution. The powder XRD pattern of the initial δ-MnO2 shows two
123
broad diffraction peaks at 37° (d(100) = 2.46 Å) and 65° (d(110) = 1.43 Å) (Figure 1A),
124
which can be attributed to δ-MnO2 with poorly-crystalline, small sized, randomly
125
stacked [MnO6] octahedral layers.7, 18, 21 The d-spacing ratio of d(100) to d(110) is 1.73,
126
indicating a hexagonal layer symmetry.22-24 The absence of basal (001) and (002) peaks
127
(d(001) = 7.2 Å , d(002) = 3.6 Å ) is indicative of stacking of only a few [MnO6] octahedral
128
layers along the c-axis.22, 25-26
129
Before the suspension was heated at 100 ℃ for 10 min, only δ-MnO2 appeared in
130
the XRD pattern (Figure 1A, B). The (100) and (110) diffraction peaks of δ-MnO2 are
131
not sharper than those for the initially formed sample, indicating that the sizes of the
132
crystallites did not increase within the a-b planes (Figure 1B), which is consistent with
133
previous reports.17 A detailed inspection of these (100) and (110) peaks in Figure. 1B
134
suggests a slight structural alteration of the δ-MnO2, evidenced by the appearance of a
135
small shoulder on the high angle side of the (100) peak., Previous studies proposed that
136
this feature could be related to an increased amount of Mn(III) capped on vacancies in
137
the [MnO6] octahedral layers.21 These results suggest that Mn(IV) is being reduced to
138
Mn(III)/Mn(II) and adsorbed on the vacancy sites with increasing heating time.
139
After the suspension was heated for 14 min, weak (110), (200) and (310) peaks of
140
α-MnO2 (ICDD No. 00-29-1020, d(110) = 0.69nm, d(200) = 0.48nm and d(310) = 0.31 nm)
141
appeared, indicating that some of the δ-MnO2 was transforming to α-MnO2 between
142
heating from 10 min to 14 min (Figure 1A).16 The peak widths narrowed and their
143
intensities increased gradually during heating from 14 to 20 min, indicating that
144
crystallite size and crystallinity of α-MnO2 increased.. The evolution of the α-MnO2
145 4 5 6 7 8 9 10 11 12 13 14 15 16 17 18 19 20 21 22 23 24 25 26 27 28 29 30 31 32 33 34 35 36 37 38 39 40 41 42 43 44 45 46 47 48 49 50 51 52 53 54 55 56 57 58 59 60
crystal morphology with structure transformation is explored below.
146
From a peak intensity examination of the pair distribution functions (PDF), a
147
systematic structural change is observed during the synthesis process (Figure 2A). From
148
Na100-6 to Na80, peaks at 2.85 Å and 4.93 Å decrease in intensity.27 These peaks are
149
attributed to atomic pairs involving t first and second Mn shells within the octahedral
150
layer around a given Mn (MnL-MnL1 and MnL-MnL2 shells).21, 27 Contrastingly,
151
correlations at 3.44 Å and 5.28 Å increase in intensity. They are attributed to pairs
152
formed by a MnL and an interlayer Mn (MnIL) at vacancies belonging respectively to
153
the first (Mn-MnIL1) and second (Mn-MnIL2) shells. The PDF results suggest that MnL
154
migrate from the layers to the interlayer, above and below the vacancies, to form
mono-155
μ-oxo bridge (MnL-MnIL1 distance of about 3.44 Å) [MnO6] octahedra.28 As is
156
discussed below, a possible mechanism for this reaction is the reduction of Mn4+ by H+.
157
It is likely that these interlayer Mn(III)/Mn(II) octahedra act as templates for the tunnel
158
‘walls’ during transformation to α-MnO2.11-12
159
Chemical properties. The Mn average oxidation states (AOS) of the intermediate 160
products provide additional evidence for the Mn(III)/Mn(II) production and structural
161
changes of the δ-MnO2. The detailed Mn(IV), Mn(III), and Mn(II) contents which are
162
obtained through fitting the XPS narrow scans of the Mn (2p3/2) spectra are listed in
163
Table 1. The AOS of the samples decrease from 3.96 to 3.70 (Table 2) before the
164
suspension was heated at 100 ℃ for 10 min. The percentages of Mn(IV) decreased from
165
83.5 % to 80.5 %, and the percentage of Mn(III) decreased from 14.3 % to 12.3 % and
166
then increased to 15.3% during this stage, indicating that the Mn(IV) and Mn(III)
167
were initially reduced to Mn(II), followed by the comproportionating between
168
vacancy-adsorbed Mn(II) and structural Mn(IV) to form Mn(III). The values of AOS
169
obtained by fitting of XPS spectra are systematically lower than that obtained by
170
titration method probably due to higher content of lower valence Mn present at the
171
surface compared to that in bulk.29-30 Thus, the XPS-derived AOS represents “surface”
172
Mn AOS, and it is possible that Mn(IV) is reduced to Mn(III)/Mn(II) and adsorbed on
173
the surface of δ-MnO2 nanoparticles. 29-30 Despite the discrepancy between the absolute
174
AOS values, we see similar trends in the two methods.
175 4 5 6 7 8 9 10 11 12 13 14 15 16 17 18 19 20 21 22 23 24 25 26 27 28 29 30 31 32 33 34 35 36 37 38 39 40 41 42 43 44 45 46 47 48 49 50 51 52 53 54 55 56 57 58 59 60
Previous studies have shown that structural Mn(III) was critical to the
176
transformation of layer structured Mn oxides into tunneled ones.11, 31 But the
177
mechanism by which Mn(III) is reduced from Mn(IV) in the initial t δ-MnO2 is still an
178
open question. As described above, some of the octahedral Mn(IV) was initially
179
reduced to Mn(II), and a portion of that was subsequently transformed to Mn(III). Given
180
that apart from H2O (H+) no other reductant exists during the transformation of δ-MnO2
181
to α-MnO2, there are two possible pathways to the reduction of Mn(IV).
182
One way is that the MnO2 is reduced by H+ at ~ 100 ℃ and pH < 1, following the
183
reaction:32
184
2MnO2+4H++𝑒−→2Mn2++2H2O+O2 (3)
185
Depending on solution pH, the Mn(II) cations originating from this partial δ-MnO2
186
dissolution might attach above/below layer vacancies.11 The XRD pattern of NaMix in
187
Figure. 1A shows that the crystallinity of δ-MnO2 was poor (i.e. crystallite size was
188
small), indicating large surface area, which favors equ. 3. As discussed below, however,
189
HRTEM images suggest that the crystallite sizes increased slightly during heating for
190
10 min. As the crystallinity of the sample increases, the Mn(IV) dissolution rate slows
191
down, consistent with the rate of the decrease of the AOS of reaching a minimum
192
when the suspension was heated at 100 ℃ for 10 min.
193
A second possible pathway for reduction of the Mn4+, is for the poorly-crystalline
194
δ-MnO2, with mixed-Mn valences (II, III and IV) to release structural oxygen,
195
following the reaction:33
196
[-Mn(IV)-O2--Mn(IV)-]→[-Mn(III)- -Mn(III)-]+1
2O2 (4)
197
The XPS fitting results of O1s are listed in Table. 1. There are three species of
198
oxygen existing in Mn oxides including lattice oxygen (O2-), hydroxide oxygen (-OH),
199
and oxygen in molecular water. Among the three species of oxides, the O2- decreased
200
from 69.9 % to 56.2 %, and the -OH increased from 18.1 % to 26.3 % during the heating
201
of the suspension for the first 10 min. It lost three O2- and produced six -OH When one
202
Mn(III) migrates from [MnO6] layer to the interlayer, above or below the resulting
203
vacancy, the Mn(III) will be coordinated to three layer O atoms and three OH; the O
204 4 5 6 7 8 9 10 11 12 13 14 15 16 17 18 19 20 21 22 23 24 25 26 27 28 29 30 31 32 33 34 35 36 37 38 39 40 41 42 43 44 45 46 47 48 49 50 51 52 53 54 55 56 57 58 59 60
atoms on the opposite side of the vacancy, where there is no Mn(III), will complete
205
their charge balance by forming OH. . Although this scenario is consistent with the
206
observed change in XPS values for O2- and OH-, the decrease in the XPS value for O
2-207
is greater relative to that of OH- than would be predicted. It is interesting that this great
208
loss of O2- is consistent with creation of O vacancies in the δ-MnO2, as proposed above
209
(equation 4). Also, some studies have suggested that the observed increase of the O1s
210
XPS peak at 532.4 eV in our XPS spectra is induced by the formation of oxygen
211
vacancies (Figure S3).34-38 The uncertainties in the XPS values and other structural
212
unknowns, however, make it impossible to draw definite conclusions. It was reported
213
that longer bond of Mn-O, adsorbed ions, and poorly-crystallinity favored the formation
214
of the oxygen vacancies.33, 39-40 Here, the increase in the content of Na+ cations and
215
Mn(III) (Table1, 2), and the weakening of the crystallinity could facilitate formation of
216
the oxygen vacancies, which promote Mn(III) production and the transformation of 2D
217
layer structure into 1D tunnel structure.
218
Interestingly, the intensity of O1s XPS peaks at 532.4 eV reached a maximum and
219
AOS of δ-MnO2 reached a minimum at heating for 10 min. The reactions described in
220
equ. 3 and equ. 4 became less favorable due to the formation of more stable structure
221
of α-MnO2 and the percentages of Mn(III) and Mn(II) decreased gradually (Table 1).
222
And the decrease of the O1s XPS peak at 532.4 eV is induced by the reduction of
223
oxygen vacancies (Figure S3). This indicated that dissolved oxygen generated by the
224
previous reactions (equ. 3, 4) could refill into oxygen vacancies and oxidizes
225
Mn(III)/Mn(II) back to Mn(IV), causing increase of AOS from 3.70 to 3.96 (Table 2).
226
Contrarily, the content of -OH and Na+ reached a maximum when δ-MnO2 started to
227
transform into α-MnO2, then decreased during the formation of α-MnO2. Na+ cations
228
adsorbed on δ-MnO2 were released because the adsorption affinity and compensation
229
charge (Mn AOS is close to 4.00) of α-MnO2 are less than that of δ-MnO2.41 In addition,
230
bonding of interlayer Mn(III) to construct tunnel structure resulted in decreased of -OH
231
content and increase O2- content during the suspension was heated at 100 ℃ for 10 min
232
to 20 min. The above analysis further reveals the changes of structures and properties
233
of the intermediates during the transformation process.
234 4 5 6 7 8 9 10 11 12 13 14 15 16 17 18 19 20 21 22 23 24 25 26 27 28 29 30 31 32 33 34 35 36 37 38 39 40 41 42 43 44 45 46 47 48 49 50 51 52 53 54 55 56 57 58 59 60
Morphology Evolution. High-resolution transmission electron microscopy 235
(HRTEM), field-emission scanning electron microscopy (FESEM) and electron
236
diffraction were used to elucidate the kinetics of the morphological evolution during
237
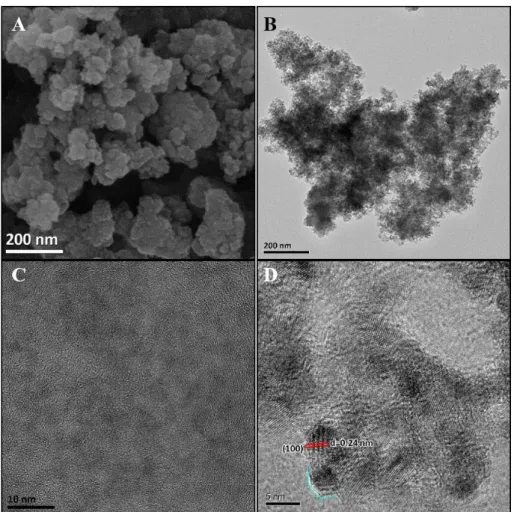
the phase transformation. Immediately after NaMnO4 and MnSO4 were mixed, a
three-238
dimensional morphology of aggregation of about 100 nm in diameter was observed
239
(Figure 3A), and primary nanodots were observed using HRTEM after ultrasonic
240
dispersion (Figure 3B, C). This indicates that the primary nanodots loosely aggregate,
241
likely driven primarily by surface energy. The edges of the primary nanodots in Figure
242
3D range from 2 to 4 nm, in good agreement with the coherent scattering domain (CSD)
243
size of 3.2 nm obtained from the PDF data (Figure 2A). The nanodots exhibited dhkl 244
spacing of 0.24 nm, corresponding to the (100) δ-MnO2 plane, which is consistent with
245
the d(100) = 2.46 Å in XRD patterns (Figure 1A and 3D). Additionally, the absence of 246
(001) and (002) reflections in the XRD patterns indicate that at this stage the poorly
247
crystalline nanodots consists of no more than a few [MnO6] octahedral layers.
248
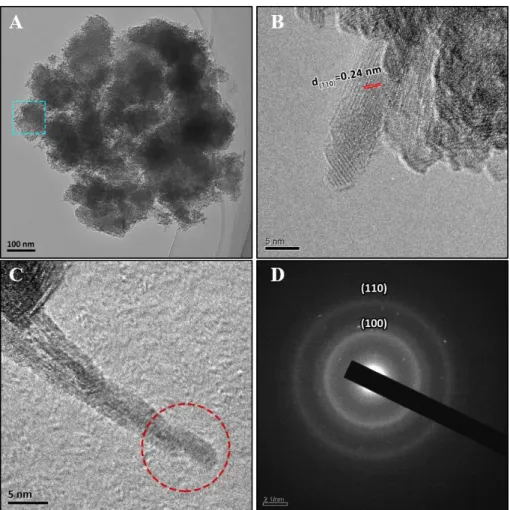
When the suspension is heated for 6 min, long nanosheets appear with lengths
249
ranging from 20 to 60 nm and diameters from 3 to 7 nm (Figure 4A-C). The observed
250
lattice fringes again exhibit a spacing of 0.24 nm, which corresponds to the (100) lattice
251
of δ-MnO2 (Figure 4B), and are consistent with the SAED pattern in Figure 4D for the
252
area highlighted by the blue square in Figure 4A. An additional diffraction ring at ~0.14
253
nm, originating from the (110) reflection of δ-MnO2, is also observed in the SAED
254
pattern (Figure 4D).
255
The HRTEM observations suggest that the long nanosheets and nanodots are both
256
δ-MnO2 with different morphologies. The serrated end of the long nanosheets (Figure
257
4B) and the overall patchwork textures indicate that long nanosheets apparently are
258
formed by direct self-assembly of nanodots. The red circle in Figure 4C indicates a
259
dislocation at the end of long nanosheet, which possibly marks the junction of
poorly-260
crystalline nanodots. The assembly of δ-MnO2 at low pH is energetically favored
261
because the primary nanodots have high surface energy, low Na+ content and hydroxyls
262
on edge sites which can generate hydrogen bonding with adjacent nanodots.4
263
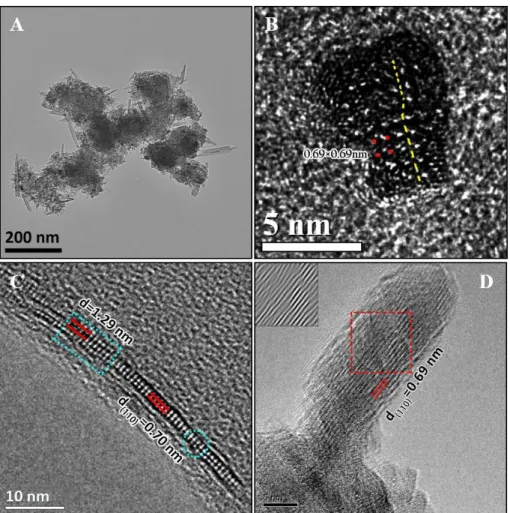
Changes in both structure and morphology indicated the conversion of δ-MnO2
264 4 5 6 7 8 9 10 11 12 13 14 15 16 17 18 19 20 21 22 23 24 25 26 27 28 29 30 31 32 33 34 35 36 37 38 39 40 41 42 43 44 45 46 47 48 49 50 51 52 53 54 55 56 57 58 59 60
to α-MnO2 after the suspension was heated for 10 min. The widths and lengths of the
265
long nanosheets increase to ~10-30 nm and ~30-100 nm, respectively (Figure 5A).
266
HRTEM images of cutting the nanosheets along the (001) plane in Figure 5Breveals
267
that long nanosheets are thickened by assembly, and form nanorods ~7 nm thick (The
268
cutting schematic along the (001) plane is shown in Figure S8A). The measured dhkl 269
spacing of 0.69 nm corresponds to the (110) plane of α-MnO2. The observed nanorods
270
exhibit different sizes and crystallographic orientations due to the assembly of multiple
271
primary nanorods (Figure 5B). Cutting the long nanosheets along the (110) plane
272
(Figure 5C- The cutting schematic along (001) is shown in Figure S8B) shows that the
273
length of long nanosheets is ~ 40 nm. However, the observed thickness of the long
274
nanosheets (2.24 nm) corresponds to only three [MnO6] octahedral layers. The new
275
[MnO6] octahedral layer assembled onto the nanosheet has a spacing of 1.29 nm which
276
is larger than the d(110) below (Figure 5C). And the size of this layer in blue square in 277
Figure 5C (6.7 nm) which corresponds to the size of nanodots, which indicating the
278
long nanosheets thicken by face-to-face assembling of nanodots. The blue circle in
279
Figure 5C reveals the dislocation along [001] direction indicate that there are two small
280
nanorods assembled by end-to-end along (001), which is thermodynamically favored
281
because the larger surface energy of (001) plane than that of (110) plane. HRTEM
282
shows that the nanorods with serrated sides form by assembly of long nanosheets
283
(Figure 5D). The IFFT image in Figure 5D shows that there are many lattice
284
dislocations along the α-MnO2 (110) plane, indicating formation of the long nanosheet
285
by assembly of nanodots. When long nanosheets and nanodots assemble with each other,
286
the period along the α-MnO2 (110) plane is formed gradually. However, the d(110)
287
spacing of 0.69 nm (Fig. 5B) is not observed in the XRD pattern of Na100-10 (Figure
288
1A), likely due to the limited α-MnO2 crystallite size.
289
After the suspension was heated for 14 min, large numbers of nanorods appeared,
290
coincident with the disappearance of the δ-MnO2 nanodots (Figure 6A). The diameters
291
of individual nanorods in Figure 6A range from 8 to 10 nm. Three nanorods attached to
292
each other is observed in Figure 6B. Their serrated sides (Figure 5C, 6B) are smoothed
293
(Figure 6C), most likely by dissolution-recrystallization. Meanwhile, the typical
side-294 4 5 6 7 8 9 10 11 12 13 14 15 16 17 18 19 20 21 22 23 24 25 26 27 28 29 30 31 32 33 34 35 36 37 38 39 40 41 42 43 44 45 46 47 48 49 50 51 52 53 54 55 56 57 58 59 60
to-side assembling between two nanorods is also observed in Figure 6C. There are two
295
nanorods in Figure 6C that assembled at one end to form a continuous lattice along (110)
296
plane. The amount of lattice dislocations observed at the attached interface (Figure 6C
297
inset I) is more than for a single nanorod (Figure 6C inset II). The blue square in Figure
298
6C indicates that two nanorods separate to form a gap at one end. The (100) surface is
299
more stable than (110) surface in solution. Therefore, two nanorods approach each other
300
through van der Waals forces and attach themselves via the common (110) surfaces.
301
This process has been widely reported for the growth of nanostructures by OA
302
mechanism.2, 42-43
303
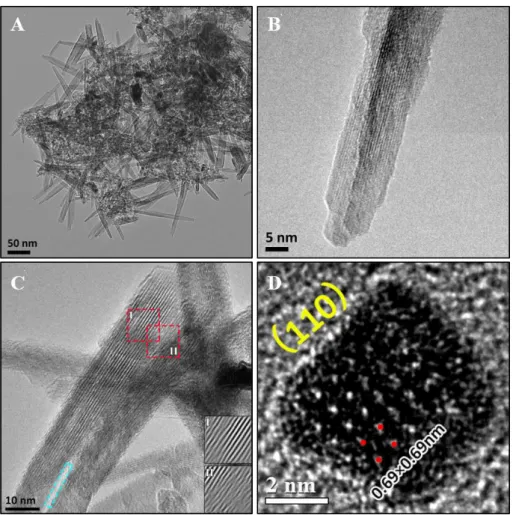
After the final heating stage, the widths and lengths of nanorods increased to
~20-304
40 nm and ~200-400 nm, respectively (Figure 7A, B). The serrated sides and internal
305
lattice dislocations of nanorods in Figure 7C had almost disappeared due to the
306
dissolution-recrystallization. However, the end of nanorods appeared scaly, caused by
307
multiple long nanosheets and primary nanorods stacking (Figure 7C).
308
The coupled morphological and structural evolution. Based on the above 309
analyses, the coupled evolutions of structure and morphology during the formation of
310
α-MnO2 can be illustrated in (Figure 8). Firstly, MnO4- is reduced by Mn(II) to produce
311
primary nanodots of δ-MnO2 with poor crystallinity (with crystallite size of
312
approximately 2 to 4 nm). With increasing heating time, nanodots aggregate serially to
313
form long nanosheets. This process is followed by the edge-to-edge OA mechanism, by
314
which the nanodots rotate gradually to achieve the same direction within the a-b plane.
315
Secondly, the long nanosheets stack with each other to form primary nanorods, which
316
initiates the conversion of δ-MnO2 into α-MnO2. The stacking is not initially coincident
317
because of the different sizes of long nanosheets (Figure S5, 5C, D and 7C). Finally,
318
the primary nanorods assemble along the (110) and (001) planes by side-to-side and
319
end-to-end OA, respectively.
320
Although the δ-MnO2 did not convert to α-MnO2 before heating for 10 min, the
δ-321
MnO2 nanodots attached with each other along their edges to form long nanosheets by
322
a dynamic network of hydrogen bonds between unsaturated oxygen either from oxygen
323
(-O), hydroxyl (-OH), or aquo-groups (-OH2) at the edges of [MnO6] octahedral layers.
324 4 5 6 7 8 9 10 11 12 13 14 15 16 17 18 19 20 21 22 23 24 25 26 27 28 29 30 31 32 33 34 35 36 37 38 39 40 41 42 43 44 45 46 47 48 49 50 51 52 53 54 55 56 57 58 59 60
This edge-to-edge OA of δ-MnO2 was reported in a previous study.4, 7 In this assembly
325
process, the lower pH of 0.86 is favorable for edge-to-edge OA along the (100) plane.7
326
The structure of δ-MnO2 produced in the initial crystallization stage does not meet
327
the necessary conditions (high proportion of Mn(III)/Mn(II) above/below layer
328
vacancies) for conversion to α-MnO2 . Subsequently, the structure adjustment occurs
329
through the production and migration of Mn(III) in the δ-MnO2 nanodots and long
330
nanosheets. Recently, Ling et al. showed that the amount of Mn(III) impacts the
331
structure of δ-MnO2. And Cui et al. revealed that the reduction of Mn(III) is unfavored
332
for the conversion from LMOs (buserite) to TMOs (3 3 todorokite).31 The Mn(III)
333
was apparently important for the structural symmetry change and phase transformation,
334
but the specific role it plays is unclear.44-45 The amount of Mn(IV)/(III) for the ideal
335
transition state structure can be counted as showed in Figure S7, i.e the interlayer Mn(III)
336
content requires to reach 30 mol % of total Mn to meet assembly into 2 2 α-MnO2.
337
This agrees very well with our experimental observation. The AOS of Na100-10 and
338
K100-4, the production of onset of transformation into 2 2 α-MnO2 is 3.70 and 3.74
339
(Mn(III) concentration is 30 % and 26 % of total Mn), respectively. Sufficient Mn(III)
340
is required for the formation the 2 2 tunnels ‘walls’ to support the transformation and
341
providing sufficient hydrogen bonding. One possibility is that the Mn(III) is produced
342
at low pH through the oxidation of water by layer Mn(IV) and the generation of oxygen
343
vacancies. Indeed, [Mn(III)O6] octahedra are distorted by Jahn-Teller effect, and
344
bonding distortion within the octahedral layer is relieved when Mn(III) migrates from
345
layers to the above and below the resulting vacancies (Figure 8B, step 1).11 These
346
[Mn(III)O6] octahedra include three unsaturated oxygen which combined with H+ to
347
form -OH. When the amount of -OH is large enough, a network of hydrogen bonds
348
forms between [Mn(III)O6] octahedra of adjacent nanosheets and nanodots (Figure 8B,
349
step 2, 3). These [Mn(III)O6] octahedra dehydrate via a condensation reaction and form
350
the 2 2 tunnels ‘walls’. Therefore, the number of -OH is expected to be maximum at
351
the initial stage of the transformation and then to decrease during subsequent
352
transformation stages. These long nanosheets and nanodots attach along (001) plane of
353
δ-MnO2 to form α-MnO2 primary nanorods by face-to-face OA (Figure 8B, step 4).
354 4 5 6 7 8 9 10 11 12 13 14 15 16 17 18 19 20 21 22 23 24 25 26 27 28 29 30 31 32 33 34 35 36 37 38 39 40 41 42 43 44 45 46 47 48 49 50 51 52 53 54 55 56 57 58 59 60
To confirm this formation mechanism in the α-MnO2 with different tunnel cations,
355
the K+-stabilized was synthesized using the similar procedures, only NaMnO4 was
356
replaced by KMnO4. During the synthesis of K+-stabilized α-MnO2, all trends of
357
structure evolution are consistent with that during Na+-stabilized α-MnO2 synthesis
358
(Figure S4 and Table S1, S2). It is suggested that the different tunnel cations α-MnO2
359
experience the similar OA formation process. The δ-MnO2 converted to α-MnO2 at
360
heating 100 ℃ for 2 min (Figure S4) indicates the rate of K+-stabilized δ-MnO2
361
conversion is much faster than that of Na+-stabilized δ-MnO
2. The structure of K+
-362
stabilized α-MnO2 was stable when the suspension was aged for 24 h, and previous
363
reports.16 indicate that stable (100) surface of nanorods can be formed during this stage.
364
However, when the Na+-stabilized δ-MnO2 was continuously aged under 60 ℃ for 24
365
h, the XRD patterns of the samples show a new peak dhkl = 0.4 nm of γ-MnO2 with a 1
366
× 2 tunnel structure (Figure S2). The intensity of this peak increased during aging for
367
24 h. The Na+-stabilized α-MnO2 has only small quantities of Na+ (3.24 ± 0.09% in
368
Table 2) in the tunnel to stabilize the tunnel structure. The α-MnO2 with empty tunnels
369
is unstable. These results indicate that the K+ adsorbed on δ-MnO2 not only accelerated
370
the production and migration of Mn(III) δ-MnO2, but also promote the structural
371
conversion to and stability of the produced α-MnO2. This finding agrees well with
372
previous reports that the K+ ions play important roles in templating and stabilizing the
373
tunneled framework.46 Another differences between K+-stabilized α-MnO2 and Na+
-374
stabilized α-MnO2 is the dominant side crystallographic face of the products. In this
375
study, the cutting of the nanorods of Na+-stabilized α-MnO2 along the (001) plane at
376
different stages shows that the side planes of nanorods still correspond with the (110)
377
plane (Figure 7D). This is perhaps in part because the open tunnel structure is formed
378
easier in the assembly process, and the morphology can be better captured during
379
slower Na synthesis. In the presence of K+, the side faces of the nanorods become four
380
(100) faces with lower energy through dissolution-recrystallize).16 Therefore, α-MnO2
381
nanorods with different exposed lattice faces can be controlled in the synthesis
382
according to specific application. The Na+-stabilized α-MnO2 is more suitable to
383
produce nanorods with four (110) lateral face, which likely reduces the distance and
384 4 5 6 7 8 9 10 11 12 13 14 15 16 17 18 19 20 21 22 23 24 25 26 27 28 29 30 31 32 33 34 35 36 37 38 39 40 41 42 43 44 45 46 47 48 49 50 51 52 53 54 55 56 57 58 59 60
energy barrier for ion diffusion, improving the rate performance of α-MnO2 in
385
applications such as rechargeable battery electrodes,47-48 supercapacitors and Li-O2
386
battery catalysts.14, 48-52 The K+-stabilized α-MnO2, on the other hand, is more suitable
387
to produce long nanowires because of a stable tunnel structure with support of K+ that
388
does not collapse easily.
389
Although this study is not exhaustive, it does highlight an important area for
390
further work on morphology and structure interaction. Indeed, future studies could
391
include K+ ion template effects on migration of Mn(III) into tunnel ‘walls’ and the
392
changes in reactivities of the products which are formed in different stages.
393
CONCLUSION 394
Na+-stabilized tunnel structured α-MnO
2 nanorods are found to assemble via the
395
staged oriented attachment (OA) growth process. The coupling evolution of structures
396
and morphologies during the whole process has been explored.
397
Firstly, the poorly-crystalline δ-MnO2 nanodots aggregated along (110) surface to
398
form δ-MnO2 long nanosheets via the edge-to-edge OA mechanism. Meanwhile, the
399
Mn(IV) in the [MnO6] octahedral layer of δ-MnO2 were reduced to Mn(III) by water,
400
and then migrated to above and below the vacancies. Secondly, the morphology and
401
structure of δ-MnO2 evolved simultaneously. The Mn(III), whose amount increased
402
gradually, build up tunnel walls and triggered conversion of the 2D layer structure to
403
the 1D tunnel structure. A dynamic network of hydrogen bonds between -OH which
404
combined with Mn(III) of adjacent long nanosheets are present as a mode of bonding
405
to construct the tunnel structure. Therefore, adjacent long nanosheets aggregated and
406
formed α-MnO2 primary nanorods by a face-to-face OA mechanism. Thirdly, primary
407
nanorods assemble with each other to form longer and wider nanorods by end-to-end
408
and side-to-side OA mechanism, respectively. The defects which formed by assembly
409
are constantly smoothed via OR process throughout the whole reaction process. This
410
work fills the blank in the initial stage of 1D tunnel structured α-MnO2 formation.
411
Meanwhile, it provides greater fundamental understanding of the relationship between
412
the coupled structure and morphology transformation during crystal growth.
413 4 5 6 7 8 9 10 11 12 13 14 15 16 17 18 19 20 21 22 23 24 25 26 27 28 29 30 31 32 33 34 35 36 37 38 39 40 41 42 43 44 45 46 47 48 49 50 51 52 53 54 55 56 57 58 59 60
Material and Methods
414
Synthesis of different types of cations of cryptomelane. In a typical experiment, 415
8.45 g MnSO4⸳H2O (0.5 M) in 100 mL of acetic acid (2 M) and 80 mL aqueous solution
416
of AMnO4 (0.4375 M, A= K or Na) were mixed together under vigorous stirring at
417
60 ℃. This suspension was heated to 100 ℃ for 20 min and was then cool to 80 ℃.
418
After cooling to 80 ℃, the suspension was frozen by liquid nitrogen and washed until
419
the conductivity of the supernatant was less than 20.0 μS cm−1, the suspension was then
420
freeze-dried.
421
After the two solutions were mixed and the suspension was heated to 100 ℃, 10
422
mL of the suspension was extracted into a 50 mL centrifuge tube filled with 20 mL of
423
liquid nitrogen at 0, 2, 4, 6, 8, 10, 14, 16 and 20 min. The extracted samples were
424
centrifuged at 12,000 rpm for 8 min and the precipitates were washed with 50 mL of
425
DDW multiple times until the conductivity of the supernatant was less than 20.0 μS
426
cm−1.The precipitates were then freeze-dried for characterization. Samples were
427
labelled AMix, A100-X and A80, where X is the heating time at 100 ℃ and A is the
428
type of cation.
429
Powder X-ray diffraction. The XRD patterns were collected from the dried 430
powders using a cavity mount on a Bruker D8 Advance diffractometer equipped with a
431
LynxEye detector, using Ni-filtered Cu Kα radiation (λ = 0.15418 nm). The
432
diffractometer was operated at a tube voltage of 40 kV and a current of 40 mA, with a
433
scanning rate of 1°/min and a step size of 0.02°.
434
Elemental analysis and Mn AOS. The chemical composition of the samples was 435
determined by dissolving ~ 0.1 g of each powder sample in 25 mL of 0.25 mol/L
436
NH2OH·HCl. The concentrations of dissolved Mn and K were measured using
437
inductively coupled plasma (ICP) and flame spectrometry, respectively. Mn average
438
oxidation state (AOS) was measured by a back-titration method using a KMnO4
439
standard solution.53
440
X-ray photoelectron spectroscopy. X-ray photoelectron spectra were collected 441
using a VG Multilab2000 X-ray photoelectron spectrometer with an Al K X-ray source
442 4 5 6 7 8 9 10 11 12 13 14 15 16 17 18 19 20 21 22 23 24 25 26 27 28 29 30 31 32 33 34 35 36 37 38 39 40 41 42 43 44 45 46 47 48 49 50 51 52 53 54 55 56 57 58 59 60
(1486 eV) and a base pressure of 3×10⁻⁹ Torr in the analytical chamber. The scans were
443
recorded using the large area mode. The survey scans were collected using a fixed pass
444
energy of 100 eV and an energy step size of 1.0 eV, whereas the narrow scans have a
445
pass energy of 25 eV and an energy step size of 0.1 eV. The charge effect was corrected
446
by adjusting the binding energy (BE) of C (1s) to 284.62 eV. The spectra were analyzed
447
using the Avantage software. The Shirley-type background was subtracted before
448
deconvolution and fitting. The parameters used by Nesbitt et al for the multiple peaks
449
of Mn (2p3/2) for spectra fitting were adopted.54 A 20:80 ratio of the Lorentzian:
450
Gaussian mix-sum function was used for all the fittings.
451
Transmission electron microscopy. The particle size and morphology of the 452
samples were further examined on a JEM-2100F transmission electron microscope
453
operated at an acceleration voltage of 200 kV. Prior to observation, samples were
454
embedded in epoxy resin, left to polymerize for 48 h in the dark and cut with an
455
ultramicrotome (Leica EM UC6) equipped with a diamond knife. The ~50nm thick
456
sections were picked up on lacey carbon films loaded on Cu grids. In addition to assess
457
possible preparation-induced artefacts (use of an ultramicrotome), all sample were
458
prepared according to the above described protocol, filtered and re-suspended in
459
ethanol. A drop of the obtained suspension was deposited on a copper microscope grid
460
covered with perforated carbon.
461
Field-emission scanning electron microscopy. Detailed three-dimensional 462
morphologies of particles were observed by using a field emission scanning electron
463
microscope (SU8010, Hitachi) with a maximum resolution of 1 nm. For high-resolution
464
SEM, the microscope was operated at 15 kV and the working distance was 0.5-30 mm;
465
an in-lens secondary electron detector was used. Prior to SEM analysis, each sample
466
was gold-coated.
467
High-energy X-ray total scattering. Synchrotron-based X-ray total scattering 468
data were collected using an X-ray energy of 58.6491 keV (λ = 0.2114 Å) at beamline
469
11-ID-B of the Advanced Photon Source (APS), Argonne National Laboratory (APS).
470
The measurement was performed using the rapid acquisition PDF method by
471 4 5 6 7 8 9 10 11 12 13 14 15 16 17 18 19 20 21 22 23 24 25 26 27 28 29 30 31 32 33 34 35 36 37 38 39 40 41 42 43 44 45 46 47 48 49 50 51 52 53 54 55 56 57 58 59 60
employing a Perkin Elmer amorphous silicon detector. The image plate was exposed
472
for 1.2 s and the measurement was repeated 75 times for a total collection time of 90 s
473
for each sample. The software Fit2D was used to integrate and convert the 2-D raw data
474
to 1-D intensity versus wave vector (Q) data. The PDF, G(r), was obtained from the
475
raw 1-D data using the program PDFgetX2.
476
Acknowledgements 477
We thank Dr. GV Lowry (AE) and the anonymous reviewers for thoughtful
478
reviews and constructive comments. The authors thank the National Natural Science
479
Foundation of China (Grant Nos. 41471194 & 41171197) and the Strategic Priority
480
Research Program of the Chinese Academy of Sciences (No. XDB15020402) for
481
financial support of this research. Use of the Advanced Photon Source, Argonne
482
National Laboratory, supported by U.S. DOE-BES under Contract
DE-AC02-483 06CH11357. 484 485 486 487 488 489 490 Reference 491
1. Penn, L.; Banfield, J. F., Imperfect oriented attachment:Dislocation Generation in
492
Defect-Free Nanocrystals. Science. 1998, 281, 969-971.
493
2. De Yoreo, J. J.; Gilbert, P. U.; Sommerdijk, N. A.; Penn, R. L.; Whitelam, S.;
494
Joester, D.; Zhang, H.; Rimer, J. D.; Navrotsky, A.; Banfield, J. F., Crystallization by
495
particle attachment in synthetic, biogenic, and geologic environments. Science. 2015,
496
349, aaa6760.
497
3. Zhang, J.; Huang, F.; Lin, Z., Progress of nanocrystalline growth kinetics based on
498
oriented attachment. Nanoscale. 2010, 2, 18-34.
499
4. Liang, X.; Zhao, Z.; Zhu, M.; Liu, F.; Wang, L.; Yin, H.; Qiu, G.; Cao, F.; Liu, X.;
500
Feng, X., Self-assembly of birnessite nanoflowers by staged three-dimensional oriented
501
attachment. Environ. Sci.: Nano. 2017, 4, 1656-1669.
502
5. Zhao, H.; Zhu, M.; Li, W.; Elzinga, E. J.; Villalobos, M.; Liu, F.; Zhang, J.; Feng,
503
X.; Sparks, D. L., Redox Reactions between Mn(II) and Hexagonal Birnessite Change
504
Its Layer Symmetry. Environ. Sci. Technol. 2016, 50, 1750-1758.
505 4 5 6 7 8 9 10 11 12 13 14 15 16 17 18 19 20 21 22 23 24 25 26 27 28 29 30 31 32 33 34 35 36 37 38 39 40 41 42 43 44 45 46 47 48 49 50 51 52 53 54 55 56 57 58 59 60
6. Qian, W.; Liao, X.; Xu, W.; Yang, R.; Livi, K. J.; Zhu, M., Synthesis of Birnessite
506
in the Presence of Phosphate, Silicate, or Sulfate. Inorg. Chem. 2016, 55, 10248-10258.
507
7. Marafatto, F. F.; Lanson, B.; Peña, J., Crystal growth and aggregation in
508
suspensions of δ-MnO2 nanoparticles: implications for surface reactivity. Environ. Sci.:
509
Nano. 2018, 5, 497-508.
510
8. Atkins, A. L.; Shaw, S.; Peacock, C. L., Nucleation and growth of todorokite from
511
birnessite: Implications for trace-metal cycling in marine sediments. Geochim
512
Cosmochim Ac. 2014, 144, 109-125.
513
9. Suib, S. L., ChemInform Abstract: Porous Manganese Oxide Octahedral Molecular
514
Sieves and Octahedral Layered Materials. Accounts Chem Res. 2008, 41, 479-487.
515
10. Dharmarathna, S.; King’Ondu, C. K.; Pedrick, W.; Pahalagedara, L.; Suib, S. L.,
516
Direct Sonochemical Synthesis of Manganese Octahedral Molecular Sieve (OMS-2)
517
Nanomaterials Using Cosolvent Systems, Their Characterization, and Catalytic
518
Applications. Chem Mater. 2012, 24 , 705–712.
519
11. Grangeon, S.; Fernandezmartinez, A.; Warmont, F.; Gloter, A.; Marty, N.; Poulain,
520
A.; Lanson, B., Cryptomelane formation from nanocrystalline vernadite precursor: a
521
high energy X-ray scattering and transmission electron microscopy perspective on
522
reaction mechanisms. Geochem T. 2015, 16, 12.
523
12. Grangeon, S.; Lanson, B.; Lanson, M., Solid-state transformation of
524
nanocrystalline phyllomanganate into tectomanganate: influence of initial layer and
525
interlayer structure. Acta Crystallogr B Struct Sci Cryst Eng Mater. 2014, 70, 828-838.
526
13. Liu, J.; Makwana, V.; Cai, J.; Suib, S. L.; Aindow, M., Effects of Alkali Metal and
527
Ammonium Cation Templates on Nanofibrous Cryptomelane-type Manganese Oxide
528
Octahedral Molecular Sieves (OMS-2). J. Phys. Chem. B. 2003, 107, 9185-9194.
529
14. Truong, T. T.; Liu, Y.; Ren, Y.; Trahey, L.; Sun, Y., Morphological and crystalline
530
evolution of nanostructured MnO2 and its application in lithium-air batteries. Acs Nano.
531
2012, 6 , 8067-8077. 532
15. Li, K.; Chen, J.; Peng, Y.; Lin, W.; Yan, T.; Li, J., The relationship between surface
533
open cells of α-MnO2 and CO oxidation ability from a surface point of view. J. Mater.
534
Chem. A. 2017, 5, 20911-20921.
535
16. Yuan, Y.; Nie, A.; Odegard, G. M.; Xu, R.; Zhou, D.; Santhanagopalan, S.; He, K.;
536
Asayeshardakani, H.; Meng, D. D.; Klie, R. F., Asynchronous Crystal Cell Expansion
537
during Lithiation of K+-Stabilized α-MnO
2. Nano Lett. 2015, 15, 2998–3007.
538
17. Grangeon, S.; Lanson, B.; Lanson, M., Solid-state transformation of
539
nanocrystalline phyllomanganate into tectomanganate: influence of initial layer and
540
interlayer structure. Acta Crystallogr. B. 2014, 70 , 828–838.
541
18. Portehault, D.; Cassaignon, S.; Baudrin, E.; Jolivet, J. P., Structural and
542
morphological control of manganese oxide nanoparticles upon soft aqueous
543
precipitation through MnO4−/Mn2+ reaction. J. Mater. Chem. 2009, 19, 2407-2416.
544
19. Portehault, D.; Cassaignon, S.; Baudrin, E.; Jolivet, J., Morphology Control of
545
Cryptomelane Type MnO2 Nanowires by Soft Chemistry. Growth Mechanisms in
546
Aqueous Medium. Chem Mater. 2007, 19, 5410-5417.
547
20. Mckenzie, R. M., The Synthesis of Birnessite, Cryptomelane, and Some Other
548 4 5 6 7 8 9 10 11 12 13 14 15 16 17 18 19 20 21 22 23 24 25 26 27 28 29 30 31 32 33 34 35 36 37 38 39 40 41 42 43 44 45 46 47 48 49 50 51 52 53 54 55 56 57 58 59 60
Oxides and Hydroxides of Manganese. Mineral Mag. 1971, 38, 493-502.
549
21. Villalobos, M.; Toner, B.; Bargar, J.; Sposito, G., Characterization of the
550
manganese oxide produced by pseudomonas putida strain MnB1. Geochim.
551
Cosmochim. Ac. 2003, 67, 2649-2662.
552
22. Drits, V. A.; Lanson, B.; Gaillot, A. C., Birnessite polytype systematics and identi
553
cation by powder X-ray diffraction. Am Mineral. 2007, 92, 771-788.
554
23. Grangeon, S.; Lanson, B.; Miyata, N.; Tani, Y.; Manceau, A., Structure of
555
nanocrystalline phyllomanganates produced by freshwater fungi. Am Mineral. 2010, 95,
556
1608-1616.
557
24. Yin, H.; Tan, W.; Zheng, L.; Cui, H.; Qiu, G.; Liu, F.; Feng, X., Characterization of
558
Ni-rich hexagonal birnessite and its geochemical effects on aqueous Pb 2+ /Zn 2+ and
559
As(III). Geochim. Cosmochim. Ac. 2012, 93 , 47-62.
560
25. Portehault, D.; Cassaignon, S.; Nassif, N.; Baudrin, E.; Jolivet, J. P., A core-corona
561
hierarchical manganese oxide and its formation by an aqueous soft chemistry
562
mechanism. Angew. Chem. Int. Edit. 2008, 120, 6541-6544.
563
26. Luo, J.; Zhang, Q.; Suib, S., Mechanistic and Kinetic Studies of Crystallization of
564
Birnessite. Inorg. Chem. 2000, 39, 741-747.
565
27. Manceau, A.; Marcus, M. A.; Grangeon, S.; Lanson, M.; Lanson, B.; Gaillot, A. C.;
566
Skanthakumar, S.; Soderholm, L., Short-range and long-range order of
567
phyllomanganate nanoparticles determined using high-energy X-ray scattering. J. Appl.
568
Crystallogr. 2013, 46, 193–209.
569
28. Petkov, V.; Ren, Y.; Saratovsky, I.; Pastén, P.; Gurr, S. J.; Hayward, M. A.;
570
Poeppelmeier, K. R.; Gaillard, J. F., Atomic-Scale Structure of Biogenic Materials by
571
Total X-ray Diffraction: A Study of Bacterial and Fungal MnOx. Acs Nano. 2009, 3 (2),
572
441-5.
573
29. Zaharieva, I.; Chernev, P.; Risch, M.; Klingan, K.; Kohlhoff, M.; Fischer, A.; Dau,
574
H., Electrosynthesis, functional, and structural characterization of a water-oxidizing
575
manganese oxide. Energ. Environ. Sci. 2012, 5, 7081-7089.
576
30. Yin, H.; Liu, F.; Feng, X.; Hu, T.; Zheng, L.; Qiu, G.; Koopal, L. K.; Tan, W.,
577
Effects of Fe doping on the structures and properties of hexagonal birnessites –
578
Comparison with Co and Ni doping. Geochim. Cosmochim. Ac. 2013, 117 , 1-15.
579
31. Yin, H.; Feng, X.; Qiu, G.; Tan, W.; Liu, F., Characterization of Co-doped
580
birnessites and application for removal of lead and arsenite. J. Hazard. Mater. 2011,
581
188, 341-349.
582
32. Cui, H.; Liu, X.; Tan, W.; Feng, X.; Liu, F.; Daniel Ruan, H., Influence of Mn(III)
583
Availability on the Phase Transformation From Layered Buserite to Tunnel-structured
584
Todorokite. Clays. Clay. Miner. 2008, 56 , 397-403.
585
33. Stone, A. T., Reductive Dissolution of Manganese(III/Iv) Oxides by Substituted
586
Phenols. Environ. Sci. Technol. 1987, 2, 979-988.
587
34. Hou, J.; Li, Y.; Liu, L.; Ren, L.; Zhao, X., Effect of giant oxygen vacancy defects
588
on the catalytic oxidation of OMS-2 nanorods. J. Mater. Chem. A. 2013, 1, 6736-6741.
589
35. Xing, M.; Zhang, J.; Chen, F.; Tian, B., An economic method to prepare vacuum
590
activated photocatalysts with high photo-activities and photosensitivities. Chem
591 Commun (Camb). 2011, 47, 4947-4949. 592 4 5 6 7 8 9 10 11 12 13 14 15 16 17 18 19 20 21 22 23 24 25 26 27 28 29 30 31 32 33 34 35 36 37 38 39 40 41 42 43 44 45 46 47 48 49 50 51 52 53 54 55 56 57 58 59 60
36. Wang, K.; Chang, Y.; Lv, L.; Long, Y., Effect of annealing temperature on oxygen
593
vacancy concentrations of nanocrystalline CeO2 film. Appl. Surf. Sci. 2015, 351,
164-594
168.
595
37. Sun, Y.; Yan, X.; Zheng, X.; Liu, Y.; Shen, Y.; Zhang, Y., Influence of carrier
596
concentration on the resistive switching characteristics of a ZnO-based memristor.
597
Nano Res. 2016, 9, 1116-1124.
598
38. Holgado, J. P.; Munuera, G.; Espinós, J. P.; González-Elipe, A. R., XPS study of
599
oxidation processes of CeOx defective layers. Appl. Surf. Sci. 2000, 158, 164-171.
600
39. Li, X.; Ma, J.; Yang, L.; He, G.; Zhang, C.; Zhang, R.; He, H., Oxygen Vacancies
601
Induced by Transition Metal Doping in gamma-MnO2 for Highly Efficient Ozone
602
Decomposition. Environ Sci Technol. 2018, 52, 12685-12696.
603
40. Zhang, G.; Dong, W.; Huang, X.; Zou, J., Oxygen vacancy induced enhancement
604
of photochemical water oxidation on calcium manganese oxide catalyst. Catal Commun.
605
2017, 89, 117-120. 606
41. Dawson, J. A.; Tanaka, I., Oxygen vacancy formation and reduction properties of
607
β-MnO2 grain boundaries and the potential for high electrochemical performance. Acs.
608
Appl. Mater. Inter. 2014, 6, 17776-17784.
609
42. Feng, X. H.; Zhai, L. M.; Tan, W. F.; Liu, F.; He, J. Z., Adsorption and redox
610
reactions of heavy metals on synthesized Mn oxide minerals. Environ Pollut. 2007, 147,
611
366-373.
612
43. Zhang, H.; De Yoreo, J. J.; Banfield, J. F., A unified description of
attachment-613
based crystal growth. Acs Nano, 2014, 8, 6526-6530.
614
44. Zhang, H.; Banfield, J. F., Interatomic Coulombic interactions as the driving force
615
for oriented attachment. Crystengcomm. 2014, 16, 1568-1578.
616
45. Ling, F. T.; Post, J. E.; Heaney, P. J.; Ilton, E. S., The relationship between Mn
617
oxidation state and structure in triclinic and hexagonal birnessites. Chem Geol. 2018,
618
479, 216-227.
619
46. Yang, P.; Lee, S.; Post, J. E.; Xu, H.; Wang, Q.; Xu, W.; Zhu, M., Trivalent
620
manganese on vacancies triggers rapid transformation of layered to tunneled
621
manganese oxides (TMOs): Implications for occurrence of TMOs in low-temperature
622
environment. Geochim. Cosmochim. Ac 2018, 240, 173-190.
623
47. Wei, C.; Xu, C.; Li, B.; Du, H.; Nan, D.; Kang, F., Anomalous effect of K ion on
624
crystallinity and capacitance of the manganese dioxide. J. Power. Sources. 2013, 225,
625
226-230.
626
48. Li, L.; Nan, C.; Lu, J.; Peng, Q.; Li, Y., α-MnO2 nanotubes: high surface area and
627
enhanced lithium battery properties. Chem Commun. 2012, 48 , 6945-6947.
628
49. Arthur, T. S.; Zhang, R.; Chen, L.; Glans, P. A.; Fan, X.; Guo, J.; Mizuno, F.,
629
Understanding the Electrochemical Mechanism of K-αMnO2 for Magnesium Battery
630
Cathodes. Acs. Appl. Mater. Inter. 2014, 6 , 7004-7008.
631
50. Hutchings, G. S.; Rosen, J.; Smiley, D.; Goward, G. R.; Bruce, P. G.; Jiao, F.,
632
Environmental In Situ X-ray Absorption Spectroscopy Evaluation of Electrode
633
Materials for Rechargeable Lithium–Oxygen Batteries. J. Phys. Chem. C. 2014, 118 ,
634
12617-12624.
635
51. Qin, Y.; Lu, J.; Du, P.; Chen, Z.; Ren, Y.; Wu, T.; Miller, J. T.; Wen, J.; Miller, D.
636 4 5 6 7 8 9 10 11 12 13 14 15 16 17 18 19 20 21 22 23 24 25 26 27 28 29 30 31 32 33 34 35 36 37 38 39 40 41 42 43 44 45 46 47 48 49 50 51 52 53 54 55 56 57 58 59 60
J.; Zhang, Z., fabrication of porous-carbon-supported α-MnO nanorods at room
637
temperature: application for rechargeable Li–O batteries. Energ. Environ. Sci. 2013, 6,
638
519-531.
639
52. Xiao, W.; Xia, H.; Fuh, J. Y. H.; Lu, L., Growth of single-crystal α-MnO2 nanotubes
640
prepared by a hydrothermal route and their electrochemical properties. J. Power.
641
Sources. 2009, 193, 935-938.
642
53. Zhai, D.; Li, B.; Xu, C.; Du, H.; He, Y.; Wei, C.; Kang, F., A study on charge storage
643
mechanism of α-MnO2 by occupying tunnels with metal cations (Ba2+, K+). J. Power.
644
Sources. 2011, 196, 7860-7867.
645
54. Kijima, N.; Yasuda, H.; Sato, T.; Yoshimura, Y., Preparation and Characterization
646
of Open Tunnel Oxide α-MnO2 Precipitated by Ozone Oxidation. J. Solid. State Chem.
647
2001, 159, 94-102. 648
55. Banerjee, D.; Nesbitt, H. W., XPS study of dissolution of birnessite by humate with
649
constraints on reaction mechanism. Geochim. Cosmochim. Ac. 2001, 65, 1703-1714.
650 651 652 653 654 655 656 657 658
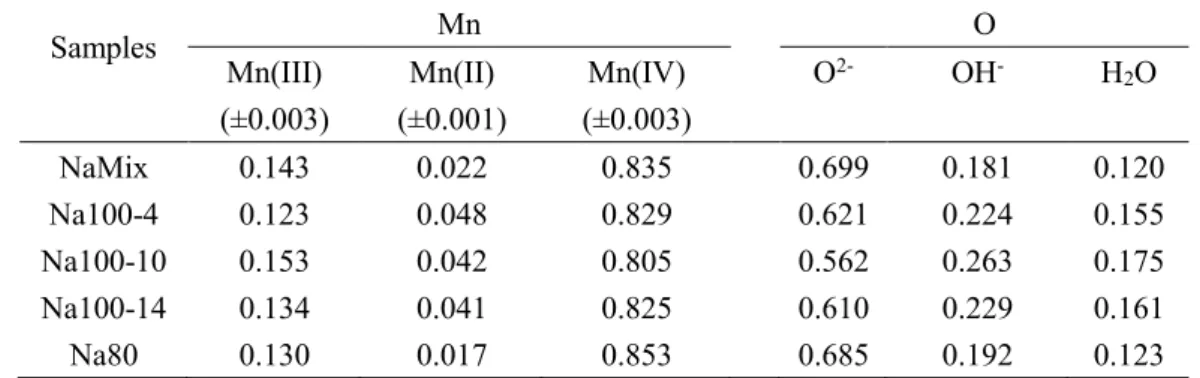
Table 1. Near-surface compositions of Mn and O species derived from fittings of Mn (2p3/2) and O
659 (1s). 660 Samples Mn O Mn(III) (±0.003) Mn(II) (±0.001) Mn(IV) (±0.003) O2- OH- H2O NaMix 0.143 0.022 0.835 0.699 0.181 0.120 Na100-4 0.123 0.048 0.829 0.621 0.224 0.155 Na100-10 0.153 0.042 0.805 0.562 0.263 0.175 Na100-14 0.134 0.041 0.825 0.610 0.229 0.161 Na80 0.130 0.017 0.853 0.685 0.192 0.123 661
Table 2. Na+ content, average oxidation states (AOS) of Mn in intermediate products at various
662
time intervals during Na+-stabilized α-MnO2 formation obtained from titration and fittings of Mn
663
(2p3/2)
664
Samples XPS (± 0.02) Titration Chemical Composition
NaMix 3.81 3.96 ± 0.01 Na0.029MnO1.994⸳0.54H2O Na100-0 - 3.96 ± 0.02 Na0.039MnO1.999⸳0.63H2O Na100-4 3.78 3.86 ± 0.02 Na0.055MnO1.957⸳0.77H2O Na100-6 - 3.75 ± 0.03 - 4 5 6 7 8 9 10 11 12 13 14 15 16 17 18 19 20 21 22 23 24 25 26 27 28 29 30 31 32 33 34 35 36 37 38 39 40 41 42 43 44 45 46 47 48 49 50 51 52 53 54 55 56 57 58 59 60
Na100-10 3.76 3.70 ± 0.01 Na0.090MnO1.895⸳0.86H2O Na100-14 3.78 3.78 ± 0.04 Na0.067MnO1.923⸳0.57H2O Na100-16 - 3.95 ±0.02 Na0.061MnO2.006⸳0.67H2O Na100-18 - 3.98 ± 0.03 Na0.057MnO2.018⸳0.62H2O Na100-20 - 3.96 ± 0.01 Na0.048MnO2.004⸳0.53H2O Na80 3.83 3.92 ± 0.02 Na0.032MnO1.976⸳0.67H2O 665 4 5 6 7 8 9 10 11 12 13 14 15 16 17 18 19 20 21 22 23 24 25 26 27 28 29 30 31 32 33 34 35 36 37 38 39 40 41 42 43 44 45 46 47 48 49 50 51 52 53 54 55 56 57 58 59 60
666
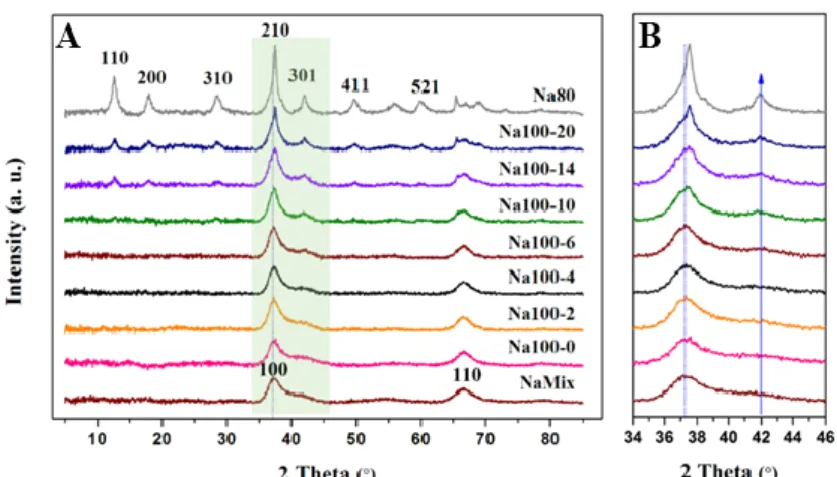
Figure 1. (A) XRD patterns of intermediate products at different intervals of Na+ stabilized
α-667
MnO2formation and crystal growth; (B) The green zone is shown magnified on the right..
668 669 4 5 6 7 8 9 10 11 12 13 14 15 16 17 18 19 20 21 22 23 24 25 26 27 28 29 30 31 32 33 34 35 36 37 38 39 40 41 42 43 44 45 46 47 48 49 50 51 52 53 54 55 56 57 58 59 60
670 671
Figure 2. (A) Pair distribution functions [G(r)] of intermediate products at different intervals of 672
Na+ stabilized α-MnO
2formation and crystal growth; (B) Scheme of a δ-MnO2 layer which
673
containing 1/3 vacancy (blue octahedral) per layer octahedron, seen along c-axis. The MnLX (X =
674
1, 2 or 3) means the first, second and third Mn shells around a given Mn. The MnILY (Y= 1 or 2)
675
means pairs formed by layer Mn and Mn at vacancies belonging respectively to the first and 676 second shells. 677 678 4 5 6 7 8 9 10 11 12 13 14 15 16 17 18 19 20 21 22 23 24 25 26 27 28 29 30 31 32 33 34 35 36 37 38 39 40 41 42 43 44 45 46 47 48 49 50 51 52 53 54 55 56 57 58 59 60
679
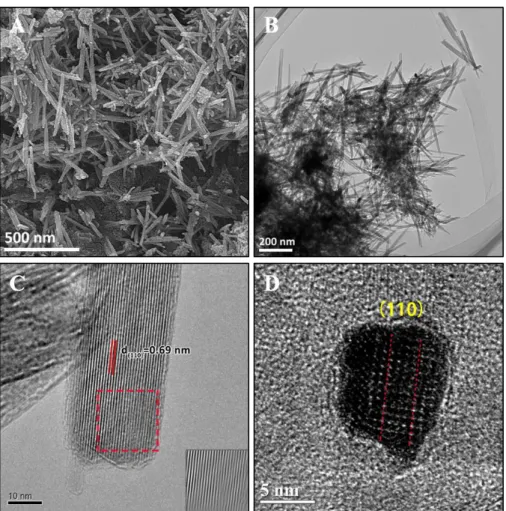
Figure 3. FESEM image of intermediate product of NaMix (A), TEM image (B and C) and
680
HRTEM image (D) showing δ-MnO2 nanoparticles. The blue contour of the particles (D) indicates 681
that it is hexagonal in shape.
682 683 4 5 6 7 8 9 10 11 12 13 14 15 16 17 18 19 20 21 22 23 24 25 26 27 28 29 30 31 32 33 34 35 36 37 38 39 40 41 42 43 44 45 46 47 48 49 50 51 52 53 54 55 56 57 58 59 60
684
Figure 4. TEM (A) image of Na100-6. (B) shows the jagged edges of the nanosheets. (C) particle
685
assemble on the end of nanosheets. The red circle in image C highlights the dislocation caused by 686
primary nanodots assembly. (D) The SAED pattern recorded by focusing the electron beam in the 687
area highlighted by the blue square in image A. 688 689 4 5 6 7 8 9 10 11 12 13 14 15 16 17 18 19 20 21 22 23 24 25 26 27 28 29 30 31 32 33 34 35 36 37 38 39 40 41 42 43 44 45 46 47 48 49 50 51 52 53 54 55 56 57 58 59 60
690
Figure 5. TEM (A) images of the intermediate Na100-10. (B)HRTEM image of an α-MnO2 691
primary nanorod cross section viewed along the [001] zone axis. (C) HRTEM image of the
δ-692
MnO2 long nanosheet cross section view along the [100] zone axis. The blue circle indicates
693
nanodots assembled along the (100) plane. And the blue square indicates nanodots assembled onto 694
the nanosheets along the (001) plane. (D) An HRTEM image of a primary nanorod. And (D)
695
shows the dislocation along (110) plane. Fourier filtered image (D inset) using red area outlined in
696
(D), highlighting the defects.
697 698 D 4 5 6 7 8 9 10 11 12 13 14 15 16 17 18 19 20 21 22 23 24 25 26 27 28 29 30 31 32 33 34 35 36 37 38 39 40 41 42 43 44 45 46 47 48 49 50 51 52 53 54 55 56 57 58 59 60
699
Figure 6. TEM (A) images of the intermediate Na100-14. (B, C) HRTEM images show nanorods
700
assemble along (110) plane. The blue rectangle indicates that there is a gap between two nanorods.
701
Fourier filtered images of zone I and zone II using red area outlined in (C), highlighting the
702
defects. (D) An image of a nanorod cross section viewed along the [001] zone axis.
703 704 4 5 6 7 8 9 10 11 12 13 14 15 16 17 18 19 20 21 22 23 24 25 26 27 28 29 30 31 32 33 34 35 36 37 38 39 40 41 42 43 44 45 46 47 48 49 50 51 52 53 54 55 56 57 58 59 60
705
Figure 7. FESEM image of product of Na80 (A), TEM image (B) and HRTEM image (C) showing
706
α-MnO2 nanoparticles. Fourier filtered image (C inset) using red area outlined in (C), highlighting 707
the defects. (D) An image of a nanorod cross section viewed along the [001] zone axis.
708 709 710 711 712 713 714 715 716 D B 4 5 6 7 8 9 10 11 12 13 14 15 16 17 18 19 20 21 22 23 24 25 26 27 28 29 30 31 32 33 34 35 36 37 38 39 40 41 42 43 44 45 46 47 48 49 50 51 52 53 54 55 56 57 58 59 60
717
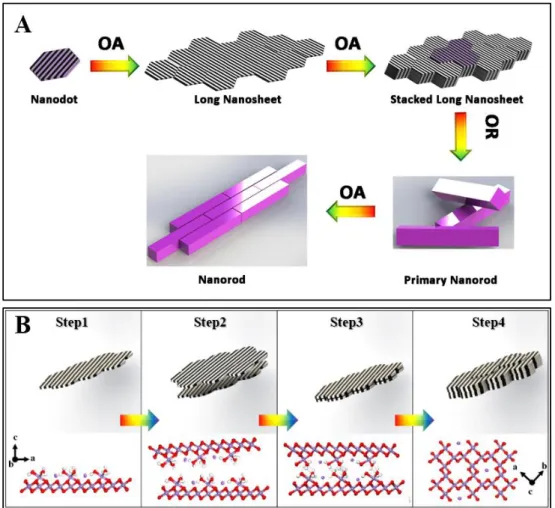
Figure 8. (A) Proposed process of assembly of nanoparticles and morphological evolution with
718
time during crystal growth of α-MnO2 via a staged OA process. (B) Schematic illustrating the 719
structure changes and morphology evolutions during the δ-MnO2 transform to α-MnO2. 720 721 4 5 6 7 8 9 10 11 12 13 14 15 16 17 18 19 20 21 22 23 24 25 26 27 28 29 30 31 32 33 34 35 36 37 38 39 40 41 42 43 44 45 46 47 48 49 50 51 52 53 54 55 56 57 58 59 60
![Figure 2. (A) Pair distribution functions [G(r)] of intermediate products at different intervals of 672](https://thumb-eu.123doks.com/thumbv2/123doknet/13707595.434128/25.892.302.595.107.619/figure-pair-distribution-functions-intermediate-products-different-intervals.webp)