HAL Id: hal-02142607
https://hal.archives-ouvertes.fr/hal-02142607
Submitted on 28 May 2019
HAL is a multi-disciplinary open access archive for the deposit and dissemination of sci-entific research documents, whether they are pub-lished or not. The documents may come from teaching and research institutions in France or abroad, or from public or private research centers.
L’archive ouverte pluridisciplinaire HAL, est destinée au dépôt et à la diffusion de documents scientifiques de niveau recherche, publiés ou non, émanant des établissements d’enseignement et de recherche français ou étrangers, des laboratoires publics ou privés.
Clay mineral adsorbents for heavy metal removal from
wastewater: a review
Shiqing Gu, Xiaonan Kang, Lan Wang, Eric Lichtfouse, Chuanyi Wang
To cite this version:
Shiqing Gu, Xiaonan Kang, Lan Wang, Eric Lichtfouse, Chuanyi Wang. Clay mineral adsorbents for heavy metal removal from wastewater: a review. Environmental Chemistry Letters, Springer Verlag, 2019, 17 (2), pp.629-654. �10.1007/s10311-018-0813-9�. �hal-02142607�
Environmental Chemistry Letters (2019) 17:629–654 https://doi.org/10.1007/s10311-018-0813-9
Clay mineral adsorbents for heavy metal removal from wastewater:
a review
Shiqing Gu1,2 · Xiaonan Kang1 · Lan Wang1 · Eric Lichtfouse3 · Chuanyi Wang1
Abstract
Heavy metal pollution such as water contamination by Pb, Hg, Cu, Cd and Cr ions is induced by rapid urbanization and industrialization and is a major threat to human health. One of the most efficient processes to clean contaminated water is adsorption. Adsorbents such as clay minerals and modified clays are efficient for the removal of metal ions from wastewater. This manuscript reviews current research in heavy metal adsorption by clay minerals such as halloysite, bentonite, mont-morillonite, vermiculite and attapulgite, from 2013 to 2017, and highlights the main adsorption mechanisms. The structure, composition and synthesis of various clay minerals and modified clays are presented.
Keywords Heavy metal removal · Clays and modified clays · Adsorption properties · Environmental remediation
Introduction
As the world population increases rapidly, the demand for water will gradually increase, and the need for improved water quality is urgent. Half of the earth’s population will face a water crisis by the year 2025 (Rijsberman 2006). Many researchers have focused on the removal of different toxic pollutants from wastewater in the last several decades (Erdem et al. 2004; Ngah et al. 2008; Fu and Wang 2011; Wang and Xu 2012). Water pollution problems are caused by the use of fertilizers (Choudhury and Kennedy 2005), insecticides
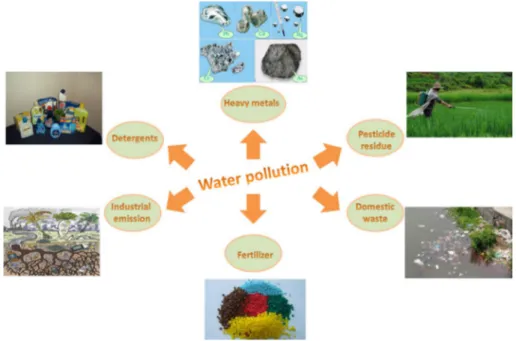
(Matur and Davou 2007), herbicides (Parise et al. 2004), soaps and detergents (Jean et al. 2012), as well as industrial activities, including mining (Dhal et al. 2013), electroplat-ing (Dhal et al. 2013), textiles (Perez et al. 2002) and other chemical industries (Lefebvre and Moletta 2006) (Scheme 1). Consequently, the most efficient solution is removing these toxic chemicals before they are released to the ecosystem.
Due to their abundance and toxicity, heavy metals have become a severe environmental problem. The persistence of heavy metals, such as Cu(II), Hg(II), Pb(II), Cd(II) and Cr(VI), in water environments has led to numerous health problems in humans and animals (Elom et al. 2014; Stanko-vic et al. 2014) . Heavy metals are the major components of inorganic pollutants, such as pesticides, fertilizers, sludge, and municipal waste, which have contaminated large areas of water and land. Heavy metals are carcinogens and may pose a serious health threat to all living beings. Table 1 shows the effects on humans and diseases caused by heavy metals. How-ever, some heavy metals play irreplaceable roles as essential substances in mammalian metabolic systems, for instance, zinc plays an important role in the development of the brain and intelligence; copper is a constituent element of hemo-cyanin in human body; manganese can promoting the normal growth and development of bone, and maintain the normal metabolism of glucose and fat (White and Broadley 2009).
Exposure to heavy metals beyond safe levels can cause serious damage. Table 2 shows the maximum allowable lim-its of various heavy metals (Ahmaruzzaman 2011; Uddin * Chuanyi Wang wangchuanyi@sust.edu.cn Lan Wang wanglan@ms.xjb.ac.cn Eric Lichtfouse eric.lichtfouse@gmail.com
1 Laboratory of Environmental Sciences and Technology,
Xinjiang Technical Institute of Physics & Chemistry, Key Laboratory of Functional Materials and Devices for Special Environments, Chinese Academy of Sciences, Ürümqi 830011, China
2 University of Chinese Academy of Sciences, Beijing 100049,
China
3 Aix Marseille Univ, CNRS, IRD, INRA, Coll France,
CEREGE, Avenue Louis Philibert, 13545 Aix en Provence, France
2017). In order to mitigate the uncontrolled emissions of these harmful heavy metals in wastewater, recent treatment technologies for heavy metals have been proposed world-wide. Several water treatment techniques, such as solvent extraction (Navarro et al. 2007), evaporation (Jakob et al.
1996), chemical precipitation (Matlock et al. 2002), ion exchange (Kapoor and Viraraghavan 1995), electrochemi-cal treatment (Chen 2004), membrane filtration technologies (Mavrov et al. 2006), and the emerging metal-organic frame-works (MOFs) technologies (Feng et al. 2018a, b; Kobielska
Scheme 1 Different causes of environmental water pollution, such as fertilizers, domestic waste, pesticide residue, heavy metals, detergents and industrial emission
Table 1 Common diseases and effects on human caused by Pb, Hg, Cu, Cd, Cr and Sb
Heavy metal Effects on humans and diseases caused by heavy metals References
Pb Anemia, nephropathy, heart disease, nervous system disease Chen et al. (2011)
Hg Minamata disease, hepatopathy, skin disease, diseases of digestive and respiratory
systems Feng and Qiu (2008)
Cu Hepatocirrhosis, acute gastroenteritis Xiong and Wang (2005)
Cd Renal failure, diseases of bone and digestive system Nordberg (2009)
Cr Diabetes, hypertension, renal failure, respiratory disease, tumor Wang et al. (2011)
Sb Skin disease, heart disease, hepatopathy, nervous system disease He et al. (2012)
Table 2 Allowable limits of heavy metals in drinking water according to various agencies
WHO represents World Health Organization, IS 10500 represents the drinking water standards in India, EU Standard represents the drinking water standards in European Union, USEPA represents the drinking water standards of United States Environmental Protection Agency, CDW represents the drinking water standards of Canada, NHMRC represents National Health and Medical Research Council in Australia, MEP repre-sents Ministry of environmental protection of China
Metal WHO IS 10500 EU Standard USEPA CDW, Canada NHMRC,
Australia MEP, China Maximum allowable values for drinking water (mg/L)
Copper 2.000 0.050 2.000 1.300 1.000 2.000 1.000 Cadmium 0.003 0.003 0.005 0.005 0.005 0.002 0.005 Lead 0.010 0.010 0.010 0.015 0.010 0.010 0.010 Mercury 0.001 0.001 0.001 0.002 0.001 0.001 0.000 Chromium 0.050 0.050 0.050 0.100 0.050 0.050 0.050 Antimony 0.005 – 0.005 0.006 0.006 0.005 0.005
et al. 2018), and advanced oxidation processes (AOPs) (Feng et al. 2018a, b; Nidheesh et al. 2018), have long been used for the removal of toxic pollutants. However, these technolo-gies have drawbacks such as toxic byproducts and high cost. For a long time, adsorption has been considered an effec-tive method for pollution control (Reddad et al. 2002; Bradl
2004). Adsorption techniques have significant advantages, such as profitability, availability, low cost (for example, the price of adsorption by vermiculite is only 20% of osmotic membrane technology), high efficiency (for example, the adsorption efficiency of kyanite for Cu(II) can reach 100%), and ease of operation in comparison with other techniques (Ajmal et al. 2001; Keng et al. 2014). Moreover, it offers sim-ple operation and high efficiency (the maximum efficiency can reach 100%) in the removal of toxic heavy metals, even at trace levels (Musyoka et al. 2013). The key to adsorption technology is to prepare environmentally friendly, cheap and efficient adsorbents. A variety of adsorbents such as active carbon, zeolite, chitosan and clay have been studied and developed to remove toxic heavy metals from wastewater and soil (Strelko et al. 2004; Kosobucki et al. 2008).
Clay is a type of small particle existing naturally on the earth’s surface. It mainly consists of water, alumina, silica and weathered rocks (Murray 1991). Clay and clay com-posite materials have been developed as highly efficient adsorbents for heavy metal removal from aqueous solu-tions (Kasgoz et al. 2008; Mockovciakova et al. 2010). Clay materials also comprise exchangeable cations including Na+,
Ca2+ and K+, making them efficient adsorbents (Srinivasan
2011). Most clay minerals are negatively charged (due to the substitution of Si4+ and Al3+ by other cations) and are
exten-sively applied in the removal of heavy metal cations from wastewater in view of their high surface area and high cation exchange capacity (Yuan et al. 2013). Heavy metal adsorp-tion by clay and clay composites consists of a series of com-plicated adsorption mechanisms, including ion exchange, surface complexation, and direct bonding of heavy metal cations to the surface of clays (Catalano and Brown 2005; Deng et al. 2006; Sari et al. 2007).
Furthermore, pretreatment of clays can improve the adsorption capacity of heavy metals. The process of clay pretreatment enhances the pore volume, surface area, and the amount of surface acid sites (Srimurali et al. 1998). In this way, clay materials can become more organophilic and hydrophobic, also enhancing the adsorption capacity for non-ionic organic substance after treatment or modification.
This article reviews the use of clay-based adsorbents including montmorillonite, attapulgite, halloysite and ver-miculite, in recent years (2013–2017). Here, we summarize their compositions, adsorptive potential and efficiencies. In addition, we have classified the various clay minerals and evaluated their abilities to remove toxic heavy metals in wastewater. We emphasize clay and modified clays as
environmentally safe adsorbents. The main purpose of this review is to help readers choose suitable adsorbents for the removal of target heavy metals as well as to facilitate the development of new adsorbents.
Properties and classification of clays
Clay minerals are mainly phyllosilicate minerals character-ized by layered structural units made up of one or two tet-rahedral silica sheets around an octahedral aluminum sheet (Velde 1995). They have particle sizes of less than 2 μm. The tetrahedral sheets have a Si2O6(OH)4 unit consisting of four hydroxyl groups surrounding every silicon atoms in a tetrahedron arrangement. By comparison, an octahedral arrangement consists of Fe, Mg or Al atoms surrounded by six hydroxyl or oxygen atoms, such as in the composition of Al2(OH)6 (Hendricks 1942; Gale et al. 1990).
Clays generally have three different inner surfaces, edges and surfaces-outer surfaces between the silicate layers. The interlayer and outer surfaces are susceptible to being changed during ion exchange and adsorption processes. Most clay minerals produce a small amount of net nega-tive surface charge due to isomorphic substitution. Further-more, particle edges of clay minerals may produce charges according to the suspension pH as a result of broken primary bonds, such as Si–O and Al–O (Leroueil et al. 1979).
Clays have a wide variety of physical properties, such as fineness of particles, hardness, good plasticity, associativity, appropriate shrinkage, high refractoriness and the capac-ity for surface decoration (Odoma et al. 2013). Clays have small particle sizes and high specific surface areas as a result of their complex porous structures, which facilitates physi-cal and chemiphysi-cal interactions with dissolved species. These interactions result from crystallinity, electrostatic repulsion, adsorption and some cation exchange reactions. The high porous surface area indicates a high bonding force on the surface of the clays (Reichle 1986).
Based on the differences in internal layer structures, clays can be divided into two types: amorphous and crystalline (Chen et al. 2000). The crystalline clays possess crystal structures that can be divided into groups such as 1:1 type layer (kaolinite), 1:1 type tube (halloysite), 2:1 type layer (montmorillonite, smectite, vermiculite), the regular mixed-layer type (Chlorite group) and 2:1 type mixed-layer-chain type (attapulgite, sepiolite). Table 3 presents the chemical com-positions of various natural clay minerals.
Kaolinite, chemically expressed as Al2Si2O5(OH)4, has the theoretical components of Al2O3 (39.53%), SiO2 (46.53%), and H2O (13.94%), in the case of the oxides. The
chemical formula demonstrates that no substitution appears involving Si4+ substituted by Al3+ in the layer of tetrahedron
Ca2+, etc.) in the layer of octahedron. Kaolinite has a 1:1
layered structure comprised of a tetrahedral SiO4 sheet and
an octahedral sheet with Al3+ as the octahedral cation. The
hydroxyl groups situated below and above the two Al atoms make a central hexagonal distribution in one single plane in the range of the octahedral sheet. Furthermore, there is a small net negative charge at the broken edges on the kaolin-ite crystals, despkaolin-ite the neutral surface charge of kaolinkaolin-ite (Gruner 1932; Brindley and Robinson 1945). The applica-tions of kaolinite clays involve ceramic, paper, medicine and cosmetics industries (Rhim et al. 2013; El-Sherbiny et al.
2015). Furthermore, the application of kaolinite in water treatment is growing rapidly in conjunction with other clay minerals, and H+ ions released from the edge of the layer
structure in acidic environments promote the adsorption of heavy metal ions, such as Pb(II), Cu(II), Hg(II) and Cd(II), from aqueous matrices (Bhattacharyya and Gupta 2008). Some surface adsorption may also occur on the exposed tetrahedral or octahedral sheets (Fig. 1).
Halloysite nanotubes are a kind of aluminosilicate clay [Al2Si2O5(OH)4·H2O with 1:1 layer] with nanotubular and
hollow microstructures. The crystalline structure and phyl-losilicate of halloysite nanotubes are formed by two main
component parts: (1) sheets sharing an Al-O octahedral on the edge; (2) sheets sharing a Si–O tetrahedral at the corner. In the Al–O octahedral sheet, only two-thirds of the exist-ing octahedra sites are filled by aluminum. The formation of the final lamellar structure builds up, containing the AlO6
octahedral and SiO4 tetrahedral. Moreover, the crystalline
structure of halloysite nanotubes can be described as 1:1 phyllosilicate. The water molecules lie between the two continuous layers creating subtle differences in the relative oriented relationship between the adjacent layers, which might cause the differences in the symmetric characteristic of the ultimate layer structure (Du et al. 2010; Luo et al.
2010). Furthermore, there are reactive hydroxyl groups on the surface of tube, which can be modified by some organic compounds to increase the adsorption selectivity of heavy metal ions (Kiani 2014).
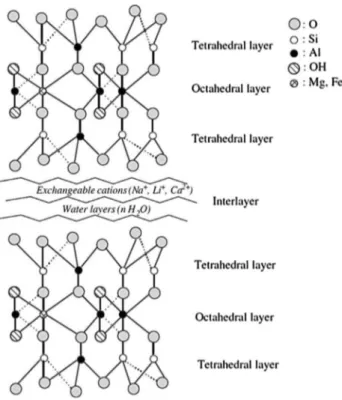
Bentonite is an aluminum phyllosilicate adsorbent mainly consisting of montmorillonite. It is a kind of sedimentary rock comprised largely of clays, with a typical 2:1 layer (smectites) structure and high concentrations of Na+, Ca2+
and Li+ ions located between the layers. The octahedral
and tetrahedral sheets are in such a pattern that the tips of the tetrahedra in each silica sheet and one of the hydroxyl layers in the octahedral sheet constitute a single layer. The distance (d value) between the 2:1 layers is not a deter-mined value because of the constant expansion of the lay-ers. Laponite, a synthetic clay, has alumina silicate mineral layers with negative charges that make for an excellent cati-onic adsorption property due to its significant surface area, with a typical 2:1 layer structure and high concentrations of Li+ ion located between the layers (Bandeira et al. 2012;
Cao et al. 2016). Montmorillonite is capable of immobi-lizing H2O molecules between the sheets, which results in
remarkable expansion. The existence of ordinary impuri-ties, such as mica, quartz, feldspar, calcite and organic mat-ter, negatively affects the cation exchange capacity (CEC) and thermal stability of bentonites (Duman and Tunç 2009; Karimi and Salem 2011). Further, in acidic environments, the release of H+ ions from the edge of the structure causes
metal adsorption from wastewaters onto the edges for ions
Table 3 Chemical compositions of various natural clay minerals
Natural clays Elemental composition (wt%) References
SiO2 Al2O3 Fe2O3 TiO2 Loss on ignition Na2O K2O CaO MgO
Kaolinite 53.70 43.60 2.00 0.10 – – 0.50 – – Jiang et al. (2010)
Halloysite 46.86 34.10 2.27 2.72 12.60 0.05 0.80 0.13 0.08 Jiang et al. (2010)
Bentonite 50.08 17.40 6.00 – 20.32 1.39 0.84 0.28 3.95 Bedoui et al. (2008)
Montmorillonite 65.34 12.89 2.38 0.52 8.06 0.53 1.54 0.24 0.95 Bosco et al. (2006)
Vermiculite 39.00 12.00 8.00 – – – 4.00 3.00 20.00 Panuccio et al. (2009)
Attapulgite 58.38 9.50 – 0.56 – – – 0.40 12.10 de Lapparent (1936)
Sepiolite 55.21 0.43 0.15 0.05 19.21 0.1 0.15 0.20 24.26 Galan (1996)
Fig. 1 The structure of kaolinite. Reproduced from Bergaya et al.
like Cd(II), Zn(II) or Pb(II). Nevertheless, in order to get superior physical performances, such as thermal stability, and mechanical performances, the purification of benton-ite is necessary. In this process, bentonbenton-ite clays are usually purified by sedimentation and acid treatment, successively, before surface modification. According to the difference in exchangeable ions and mineral components, bentonite has a variety of commercial applications. The applications of ben-tonite clays involve raw materials and being treated by the methods of acid activation, soda activation, heat treatment and ion exchange (Karimi and Salem 2011). It can be used in the production of nanocomposites, decolorization of oils, remediation of soil and the synthesis of catalysts (Lenarda et al. 1994) (Fig. 2).
Montmorillonites are unique smectitic clays, and they are widely distributed in the natural environment. Montmoril-lonite is a quite tender phyllosilicate, and its name comes from the location of its discovery, Montmorillon, France. It consists of plate-shaped particles with an average diameter of approximately 1 µm, and it is chemically represented as (Na, Ca)0.33 (Al, Mg)2Si4O10(OH)2·nH2O, which is formed by the change of volcanic ash (Frenkel 1974). Similarly, it also consists of three layers: one octahedral aluminum layer in the center surrounded by two tetrahedral silica layers. Interactions that take place between the sheets generally occur through –OH groups in the octahedral layer and the
tips of the tetrahedral layer. Montmorillonite is also a kind of swelling clay because of the expanding of the lattice caused by polar molecules, including water. In addition, interlamel-lar spacing may fluctuate due to cations changing between the silicate sheets (Winchell 1945). Montmorillonite clay has been used in many applications for many years (de Paiva et al. 2008). Due to its significant biological activity, mont-morillonite clay is widely used in the field of treatment of tropical diseases. Acid-activated montmorillonite clay has been widely used in the food industry working as bleach. Due to its large surface area and expandable layered struc-ture, the excellent adsorption capacity of modified mont-morillonite has been used to remove various heavy metals in aqueous solution, particularly mercury ions (Wang et al.
2014) (Fig. 3).
Vermiculite is a common clay mineral, and it is found in layered silicate, with a structure of 2:1 aluminosilicate. The 2:1 layer structure consists of a tetrahedral sheet of silica and two sheets of MgO2(OH)4 octahedra, in which
silicon is partially replaced by aluminum, creating a stable mica stack. Exchangeable cations located in the interlayer space, such as K+, Na+, Ca2+ and Mg2+, compensate for
the positive charge deficiency in the parallel 2:1 layers. In this way, the two layers are combined, and the struc-ture is generally known as 2:1 layered silicate (Hendricks and Jefferson 1938; Shirozu and Bailey 1966). Vermiculite can be divided into two forms: unexpanded vermiculite and expanded vermiculite. Unexpanded vermiculite refers to raw vermiculite without burning processing step, and after burning processing step, expanded vermiculite is pro-duced. The volume of expanded vermiculite increases after
Fig. 2 The structure of bentonite (including the forms of laponite and montmorillonite). (Reproduced from Nasser et al. 2016 with
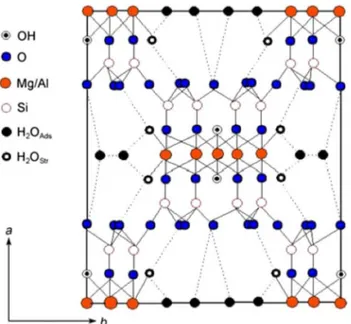
burning processing step in comparison with unexpanded vermiculite. Vermiculite has a large internal surface area, high negative charge on the silicate layers, and higher cat-ion exchange capacity at 120–160 mequiv./100 g in com-parison with other 2:1 layered silicate (Xu and Boyd 1994). Attapulgite clay is a crystalline hydrated aluminum-magnesium silicate mineral, as a rare non-metallic min-eral resource but not very well known on its structure and component (Liu 2007). The important element in the structure is the hornblende double silica chain parallel to the c axis in the long direction (Fig. 4). Parallel to the c axis and linking together with the oxygen atoms on their longitudinal edges, the double silica chains constitute the structure of attapulgite. The vertices of the tetrahedron point to the opposite direction in a continuous chain. A special kind of double ribbed layer, with double rows of tetrahedral apexes vertices, is formed at the bottom and top of the layer in the alternating spacing. Like the double silica chain, the water molecule chains are in parallel with the c axis, filling up the interspaces between the amphi-bolite chains. In this way, the substitutions of silicon by aluminum are considered impossible. From the perspective of performance, attapulgite has a variety of excellent prop-erties as a superior colloid, catalyst, adsorption material, and physicochemical filler due to its unique fiber-crystal structure (Ruiz-Hitzky et al. 2005; Lv et al. 2017). In addi-tion, attapulgite has been extensively used in the treatment of wastewater. Moreover, attapulgite has the advantages of large specific surface area, good compatibility with micro-organisms and strong adsorption capacity for heavy metal ions (Wang and Wang 2016).
Adsorption properties of various modified
clays
For the purpose of enhancing the adsorption capacity of raw clay minerals, various modification methods have been used over the past few decades. Different treatment meth-ods can remove various heavy metals effectively. Many comparative studies have revealed that modification can effectively increase the adsorption capacity of clay materi-als. Here, we present our research progress on heavy metal removal using clay minerals in recent years (2013–2017), and we highlight the significant findings in adsorption mechanism studies.
Heavy metal removal by 1:1 type clays
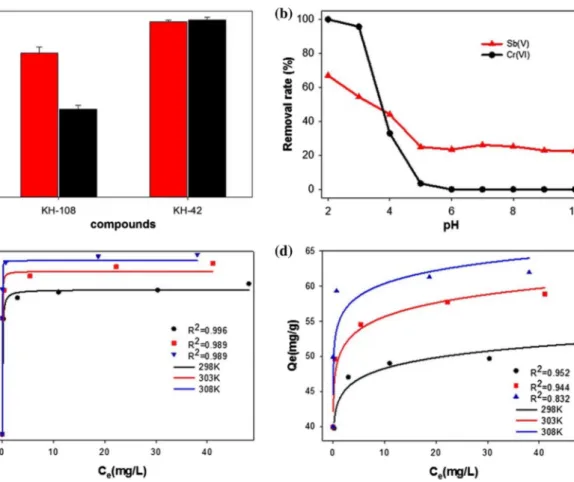
Sb(V) and Cr(VI) removal by modified halloysite nanotubes In this work, a new adsorbent was successfully synthe-sized from Fe3O4 nanoparticles growing on halloysite nanotubes (HNTs), followed by succedent decoration by silane coupling agents. The halloysite nanotubes/Fe3O4
composite modified by anilino-methyl-triethoxysilane (KH-42) exhibited high adsorption capacity for Cr(VI) and simultaneous removal of Sb(V) and Cr(VI). Furthermore, the maximum removal efficiency for Sb(V) increased from 67.0% in single-solute system) to 98.9% in bi-solute sys-tem, indicating that the existence of Cr(VI) enhanced the removal of Sb(V) by the m-halloysite nanotubes/Fe3O4 adsorbent. This work showed m-halloysite nanotubes/ Fe3O4 has great potential in treating wastewater with
coex-isting heavy metal ions, such as Sb(V) and Cr(VI) (Zhu et al. 2017a, b).
Preparation of m‑halloysite nanotubes/Fe3O4 nanocomposites
The preparation of m-halloysite nanotubes/Fe3O4
compos-ites was based on the following steps: (1) clay mineral cation exchange sites were activated and saturated by hydrochloric acid and Fe(III); (2) Fe3O4 was immobilized on the clay surface by in situ co-precipitation of Fe(II) and Fe(III) spe-cies; and (3) condensation reactions were used to graft the silanes onto the clay surfaces.
Characterization of m‑halloysite nanotubes/Fe3O4 nanocomposites
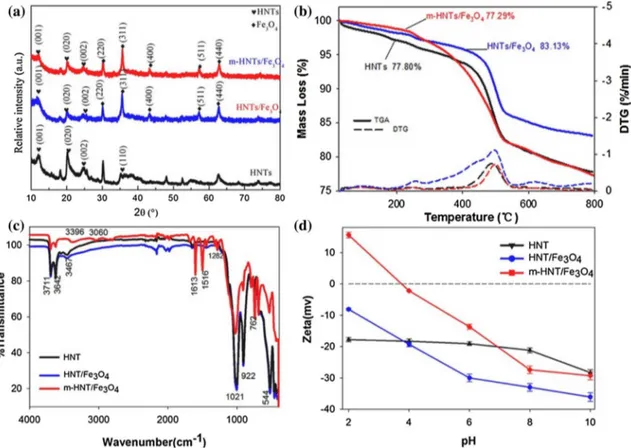
The X-ray diffraction (XRD) patterns of halloysite nano-tubes, halloysite nanotubes/Fe3O4, and m-halloysite
nano-tubes/Fe3O4 are shown in Fig. 5a. The diffraction peaks at
Fig. 4 Structure of attapulgite projected on the (001) plane. (Repro-duced from Pan et al. 2011 with permission)
35.09°, 24.85°, 20.14°, and 12.00° corresponded to the d val-ues of 0.254 nm, 0.358 nm, 0.411 nm and 0.733 nm, respec-tively. These peaks were indexed to halloysite nanotubes. New diffraction peaks for halloysite nanotubes/Fe3O4 at
62.70°, 57.17°, 43.23°, 35.54°, and 30.13° corresponded to the d values of 0.161 nm, 0.209 nm, 0.252 nm and 0.296 nm, and these peaks were identified as Fe3O4, according to JCPDS Card No. 19-0629. These results reveal that mag-netic Fe3O4 nanoparticles were successfully immobilized on
the surfaces of halloysite nanotubes (Zhang et al. 2008). In addition, the characteristic diffraction peaks of Fe3O4 and halloysite nanotubes were retained in the m-halloysite nano-tubes/Fe3O4 nanocomposites, indicating that Fe3O4 and
hal-loysite structures were reserved in the preparation process of m-halloysite nanotubes/Fe3O4 nanocomposites.
The results of thermo gravimetric analysis (TGA) and derivative thermogravimetric (DTG) curves are shown in Fig. 5b. The process of devolatilization for halloysite nano-tubes and halloysite nanonano-tubes/Fe3O4 showed similar curves for DTG. And the first-step mass loss in the temperature
(30–150 °C) was associated with the evaporation process of adsorbed water on the surfaces. Moreover, the mass loss at 490 °C was attributed to the dihydroxylation process of struc-tural aluminol groups in halloysite nanotubes (Xie et al. 2011). The mass loss in the temperature (30–150 °C), in comparison with halloysite nanotubes/Fe3O4, was decreased for the
modi-fied samples, indicating that water adsorbed on the surface of the clay was replaced by the grafting agents (Guangyan et al.
2014). In the temperature of 200–550 °C, the increased mass loss for m-halloysite nanotubes/Fe3O4 was attributed to the
decomposition process of the silane grafted onto the surface, including the internal surfaces with Al–OH and the external surfaces with Si/Al–OH (Duquesne et al. 2007).
Attenuated total reflectance-Fourier transform infrared spectroscopy (ATR-FTIR) spectrum of raw halloysite nano-tubes is shown in Fig. 5c. The absorption peaks at 3711 and 3642 cm−1 were attributed to –OH stretching of Al-OH
groups, and the peak at 922 cm−1 was caused by -OH
defor-mation of the above –OH groups. All of the above peaks appeared in the ATR-FTIR spectra of halloysite nanotubes/
Fig. 5 a The X-ray diffraction (XRD) patterns, the characteristic
dif-fraction peaks of Fe3O4 and halloysite nanotubes were retained in the
m-halloysite nanotubes/Fe3O4 nanocomposites, indicating that Fe3O4
and halloysite structures were reserved in the preparation process of m-halloysite nanotubes/Fe3O4 nanocomposites; b thermo gravimetric
analysis (TG) and derivative thermogravimetric (DTG) curves, the mass loss differences of halloysite, halloysite nanotubes/Fe3O4, and
m-halloysite nanotubes/Fe3O4 nanocomposites indicate the clay
sur-face was decorated with the grafting agents; c Attenuated total reflec-tance-Fourier transform infrared spectroscopy (ATR-FTIR) spectrum of halloysite nanotubes samples, the changes of peak reveal the suc-cessful grafting of the silane coupling agent onto the surface of hal-loysite nanotubes; d relationship between pH and zeta potential for halloysite nanotubes samples, the characterization indicates that mag-netic Fe3O4 nanoparticles and KH-42 have been successfully
Fe3O4. It is remarkable that the vibration peaks at 3060 and 3396 cm−1 of m-halloysite nanotubes/Fe
3O4 are newly
dis-covered, and these peaks were ascribed to C–H asymmet-ric vibrations and N–H asymmetasymmet-ric stretching (Hong et al.
2008). In addition, the peak at 1613 cm−1 was ascribed to
the stretching vibration of C=C in the benzene ring. The 1516 cm−1 peak was attributed to the N–H curve vibration
(Ma et al. 2006). Furthermore, the strength of peak (Al–OH) decreased, which was due to the interaction between KH-42 and Al–OH (Luo et al. 2011). These results reveal the suc-cessful grafting of the silane coupling agent onto the surface of halloysite nanotubes.
The relative affinity of the composite for adsorption is closely related to the surface charge, and the surface charge mainly depends on the pH of water environment. As a function of solution pH, the zeta potentials of m-halloysite nanotubes/Fe3O4, halloysite nanotubes/Fe3O4, and halloysite nanotubes are exhibited in Fig. 5d. The surface zeta poten-tials for halloysite nanotubes/Fe3O4 and halloysite nanotubes
are negative from the pH range of 2.0–10.0, which can be
ascribed to the –OH groups present on the surface of hal-loysite nanotubes/Fe3O4 and halloysite nanotubes (Huang
et al. 2016). After modification by KH-42 silane coupling agent, the Zeta potential values turn much more positive. Moreover, once the pH was lower than 4, a positively charged surface was observed, which can be ascribed to the protonation of the amine groups (Luo et al. 2011). This char-acterization indicates that magnetic Fe3O4 nanoparticles and KH-42 have been successfully immobilized on the surfaces of halloysite nanotubes.
Simultaneous adsorption of Sb(V) and Cr(VI) by m‑halloysite nanotubes/Fe3O4
As shown in Fig. 6a, the removal rate of Sb(V) (RSb) in
the single-solute system is obviously lower than that in the bi-solute system, further demonstrating the adsorption capability of m-halloysite nanotubes/Fe3O4 for Sb(V) and
Cr(VI). As shown in Fig. 6b, the removal of Sb(V) and Cr(VI) decreased with increasing solution pH. As shown in
Fig. 6 a The removal rate of Cr(VI) and Sb(V) in the bi-solute
sys-tem, the removal rate of Sb(V) (RSb) in the single-solute system is
obviously lower than that in the bi-solute system, further demon-strating the adsorption capability of m-halloysite nanotubes/Fe3O4
for Sb(V) and Cr(VI); b the effect of initial pH on the adsorption of Cr(VI) or Sb(V) by m-halloysite nanotubes/Fe3O4, showing the
removal of Sb(V) and Cr(VI) decrease with increasing solution pH;
c Langmuir plot and d Freundlich plot for the removal of Cr(VI) by
m-halloysite nanotubes/Fe3O4, suggesting the Langmuir model is
more appropriate than the Freundlich to describe the adsorption pro-cess (Zhu et al. 2017a, b)
Fig. 6c, d, Langmuir and Freundlich isotherm models were used to discuss the adsorption equilibrium for Cr(VI). The correlation coefficient values (R2) indicate that in order to
describe the adsorption process better, the Langmuir model is more appropriate than the Freundlich, which suggests that the Cr(VI) adsorption type on the surface of m-halloysite nanotubes/Fe3O4 belongs to monolayer adsorption.
Potential adsorption mechanisms
Electrostatic attraction provides initial driving force for Cr(VI) to bind onto the surfaces of m-halloysite nanotubes/ Fe3O4 (Eq. 1). Inner-sphere complexation is another key factor for Cr(VI) and Sb(V) adsorption (Eqs. 2–5). For inner-sphere complexation, Cr(VI) are first adsorbed onto the surface of m-halloysite nanotubes/Fe3O4 adsorbents by functional groups and anion-π interactions (Eq. 2), and then H3SbO4 is attached onto the surface of m-halloysite
nano-tubes/Fe3O4 adsorbents by the Cr(VI)–O–Sb(V) interaction
(Eq 3). Furthermore, Sb(V) and Cr(VI) ions could form Cr(VI)–O–Sb(V) complexes in aqueous solution. In that case, Cr(VI)–O–Sb(V) complexes are adsorbed by compl-exation reactions (Eqs. 4, 5).
Summary
To improve its adsorption capacity and solid-liquid separa-tion property, the surface of halloysite is decorated by Fe3O4 nanoparticles and modified with silane coupling agents successfully. The halloysite nanotubes/Fe3O4 composite
modified by KH-42 exhibits the highest capacity for Cr(VI) adsorption; the Cr(VI) removal efficiency achieves to 100% when the initial contention of Cr(VI) is < 40 mg/L. Results obtained from ATR-FTIR and XPS measurements confirm the formation of inner-sphere complexes between Cr(VI) and functional groups of m-halloysite nanotubes/Fe3O4. In the bi-solute system, part of Cr(VI) ions are primarily adsorbed onto m-halloysite nanotubes/Fe3O4, and then form
Cr(VI)–O–Sb(V) with the freedom of Sb(V). In addition, (1) m-HNTS/Fe3O4− NH + H++ HCrO4−
→ (m-HNTs∕Fe3O4− NH+)HCrO−4
(2) (m-HNTS/Fe3O4− NH+)HCrO−4 → m-HNTs∕Fe3O4− N − O − Cr
(3) m-HNTs/Fe3O4− N − O − Cr + H3SbO4 → m-HNTs∕Fe3O4− N − O − Cr − O − Sb (4) HCrO4+ H3SbO4+ H+→ Cr − O − Sb (5) m-HNTs/Fe3O4− NH + Cr − O − Sb + H+ → m-HNTs∕Fe3O4− N − O − Cr − O − Sb
partial Cr(VI) and Sb(V) ions form Cr(VI)–O–Sb(V), then adsorbed onto m-halloysite nanotubes/Fe3O4 by
compl-exation. It is concluded that m-halloysite nanotubes/Fe3O4
could be used as a low cost, easy separation, and relatively effective adsorbent for simultaneously removing Cr(VI) and Sb(V) from industrial wastewater and natural surface water. Heavy metal removal by 2:1 type layer clays
Synthesis of functionalized modified montmorillonite/ carbon nanocomposites
The montmorillonite/carbon nanocomposites were prepared by a one-pot process of hydrothermal carbonization, regard-ing d-glucose as the carbon nanoparticle precursor. The
as-prepared nanocomposite montmorillonite/carbon provided a foundation for grafting the following functionalized groups: –COOH, –OH and –NH2. For
montmorillonite/carbon-COOH, a mixture of H2O2 solution and montmorillonite/ carbon was stirred vigorously. Ultimately, a black powder, referred to as montmorillonite/carbon-COOH composite, was obtained after washing and drying. As for the montmo-rillonite/carbon-OH composites, we added montmorillonite/ carbon material into the NaOH solution and transferred it to a high temperature hydrothermal device at 150 °C. Montmo-rillonite/carbon-NH2 was synthetized by mixing
montmo-rillonite/carbon and NaNO2 with ethane diamine solution, followed by sonication and microwave digestion. According to the above methods, we preliminarily introduced three dif-ferent organic functional groups (–COOH, –OH and –NH2)
onto the surface of montmorillonite/carbon nanocomposites. Characterization of modified montmorillonite/carbon nanocomposites
N2 adsorption–desorption isotherms and distributions of pore size for montmorillonite and montmorillonite/ carbon composites are shown in Fig. 7a, b. The surface area of montmorillonite/carbon was larger than that of Na+-montmorillonite, indicating the carbonaceous
nano-particles prepared on montmorillonite contribute to the specific surface area. The increase in N2 adsorption
capac-ity at low pressure suggests that there are a small amount of micropores in montmorillonite/carbon, and the remark-able hysteresis loops at relative pressures (0.4–0.8) indicate the existence of mesoporous structures (Sing et al. 1985; Bakandritsos et al. 2004). Furthermore, the pore size peak of Na+-montmorillonite is 4.0 nm, while the as-prepared
montmorillonite/carbon inherits the 4 nm-pore distribu-tion for montmorillonite (Fig. 7b). It is worth noting that a new peak at 7.8 nm appears in montmorillonite/carbon, which can be attributed to the carbon particles loaded onto
montmorillonite. The above results suggest that the carbona-ceous nanoparticles are one part of montmorillonite/carbon, and the carbonaceous nanoparticles have significant impact on the specific surface area and porosity.
Infrared spectroscopy was adopted for the structural analysis of three functionalized montmorillonite/carbon composites, montmorillonite/carbon and montmorillonite (Fig. 7c, d). The characteristic band of montmorillonite at 3635 cm−1 was ascribed to the structural –OH group
vibra-tional stretching. Some new peaks appeared in the spectrum of montmorillonite/carbon after the hydrothermal carboniza-tion process. The peak at 2941 cm−1 was attributed to the
vibration of C–H groups. And peaks at 1623 and 1707 cm−1
were ascribed to C=C and C=O stretching vibrations
(Demir-Cakan et al. 2009). As the results shown, the func-tional carbonaceous nanoparticles had been partially loaded onto the surfaces of montmorillonite. The results suggest that montmorillonite is partially modified by the functional carbonaceous species. In comparison with montmorillonite/ carbon, the strong peaks of montmorillonite/carbon-COOH at 1714 and 3400 cm−1, correspond to the vibrations of
C=O groups and the stretching vibrations of O–H groups, respectively. And montmorillonite/carbon-OH exhibited stronger peaks at 3400 cm−1, 1585 cm−1 and 1402 cm−1 in
comparison with montmorillonite/carbon. As for montmo-rillonite/carbon-NH2 composite, the peaks at 1448 cm−1,
1638 cm−1 and 3307 cm−1 were attributed to the vibrations
of C–N groups, bend vibrations and stretching vibrations
Fig. 7 a N2 sorption isotherm, The increase in N2 adsorption capacity
at low pressure suggests that there are a small amount of micropo-res in montmorillonite/carbon, and the remarkable hystemicropo-resis loops at relative pressures (0.4–0.8) indicate the existence of mesoporous structures; b pore size distribution of montmorillonite/carbon and montmorillonite, the pore size peak of montmorillonite is 4.0 nm, while the as-prepared montmorillonite/carbon inherits the 4 nm-pore distribution for montmorillonite, suggesting that the carbonaceous
nanoparticles are one part of montmorillonite/carbon, and the carbo-naceous nanoparticles have significant impact on the specific surface area and porosity; c FTIR of montmorillonite/carbon and montmoril-lonite; d FTIR of functionalized montmorillonite/carbon composites, confirming that the designated functional groups have successfully modified the structure of montmorillonite/carbon composites (Zhu et al. 2017a, b)
of N–H groups (Chen et al. 2014), respectively. The above results confirm that the designated functional groups have successfully modified the structure of montmorillonite/car-bon composites.
Figure 8a demonstrates the X-ray diffraction (XRD) pat-terns of montmorillonite/carbon composites and montmoril-lonite. The basal spacing of clays is calculated according to the following Bragg equation (Eq 6).
where θ represents the incident angle, and d(001) stands for the clay basal spacing. As shown in Fig. 8a, the basal (6) d(001) = 1.54
2 sin(2𝜃∕2)
spacing of the prepared montmorillonite/carbon increased to ~ 15.06 from ~ 12.3 of montmorillonite, which indicates that subtracting the thickness of one smectite layer (9.6 Å), the remaining interlayer distance of clay was 5.1 Å. Moreo-ver, the results confirm that the clay interlayers should be inserted by a few carbon clusters (~5 Å in size) (Anadao et al. 2011).
Batch adsorption experiments Experimental research of adsorption was adopted at different pH values to determine the influence of solution pH on removing Pb(II) by function-alized montmorillonite/carbon, montmorillonite/carbon and montmorillonite. Figure 8b shows the relationship between
Fig. 8 a The X-ray diffraction (XRD) patterns of
montmorillon-ite/carbon and montmorillonite, the basal spacing of the prepared montmorillonite/carbon increased to ~ 15.06 from ~ 12.3 of mont-morillonite, which indicates that subtracting the thickness of one smectite layer (9.6 Å), the remaining interlayer distance of clay was 5.1 Å, confirming that the clay interlayers should be inserted by a few carbon clusters; b effect on the adsorption of Pb(II) by solution pH, the order of adsorption capacity is as follows: montmorillonite/ carbon-COOH > montmorillonite/carbon-OH > montmorillonite/ carbon-NH2 > montmorillonite/carbon, the Pb(II) adsorption
capac-ity of all adsorbent systems increased with the increase in pH from 2
to 5; c Pb(II) adsorption isotherm of montmorillonite/carbon-COOH under different temperatures, the Langmuir model can describe the adsorption process of Pb(II) much better than the Freundlich model according to the correlation coefficient values (R2), demonstrating
the presence of maximum monolayer surface coverage and constant adsorption site energy; d effect of contact time on the adsorption capacity for Pb(II), the adsorption rate for Pb(II) appeared a rapid increasing reaching 94.66 mg g−1 in the first 40 min and remained
stagnant at 98.36 mg g−1 owing to the presence of a large amount of
pH of solution and adsorption capacities of different adsor-bents. As a result of the addition of more adsorption sites and functional groups, the adsorption capacities for Pb(II) of functionalized montmorillonite/carbon increased obvi-ously after montmorillonite/carbon modification (Zhang et al. 2015). The order of adsorption capacity is as follows: COOH > montmorillonite/carbon-OH > montmorillonite/carbon-NH2 > montmorillonite/car-bon. In addition, the Pb(II) adsorption capacity of all adsor-bent systems increased with the increase in pH from 2 to 5. The complexations between Pb(II) and different functional groups (–NH2, –COOH and –OH groups) work for the dif-ferent adsorption effects with the three adsorbents.
The Pb(II) adsorption capacity by montmorillonite/car-bon-COOH increased obviously with the increase in initial concentration (Fig. 8c). For Pb(II) concentrations greater than 100 mg L−1, there is little change in amount of Pb(II)
adsorption. According to the correlation coefficient values (R2), the Langmuir model can describe the adsorption
pro-cess of Pb(II) much better than the Freundlich model, which demonstrates the presence of maximum monolayer surface coverage and constant adsorption site energy. The theoretic adsorption capacity of montmorillonite/carbon-COOH for Pb(II) reached 247.85 mg g−1, much higher than most of
the carbon-based adsorbents, such as carbon nanotubes and modified activated carbon (Kadirvelu et al. 2000; Li et al.
2005; Gao et al. 2009; Chakraborty et al. 2011).
In practical application, the adsorption rate is another key factor in the design of adsorbents. As shown in Fig. 8d, the adsorption rate for Pb(II) appeared a rapid increasing reaching 94.66 mg g−1 in the first 40 min and remained
stagnant at 98.36 mg g−1. Owing to the presence of a large
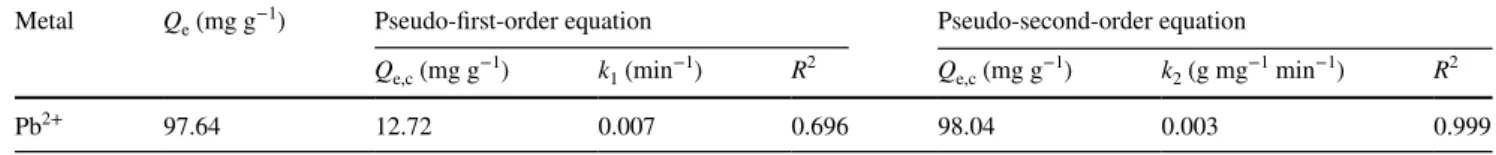
amount of surface active groups, the initial adsorption rate for Pb(II) was high. On the contrary, it is because of the gradual consuming of surface adsorption sites that the Pb(II) adsorption rate after 40 min became slow, and during this period, the state of charge balance formed on the surface of adsorbent (Luo et al. 2011). According to Table 4, in com-parison with the pseudo-first-order model, the pseudo-sec-ond-order model is more suitable for describing the process of Pb(II) adsorption due to a higher correlation coefficient (R2). Furthermore, the Q
e (experimental adsorption
capac-ity at equilibrium) approximates to Qe,c (calculated value by
kinetic equation) of pseudo-second-order model. Therefore, chemical adsorption is responsible for the process of Pb(II)
adsorption by means of sharing electrons between Pb(II) and adsorbent and forming covalent forces (Baydemir et al.
2007).
Summary Montmorillonite/carbon and functionalized montmorillonite/carbon nanocomposites were synthesized by a one-pot hydrothermal process. The spectroscopic char-acteristic results confirmed that the montmorillonite were decorated by functional carbonaceous species successfully. Their adsorption properties were evaluated by the Pb(II) removal. Consequently, Pb(II) adsorption onto m-montmo-rillonite/carbon was strongly affected by the surface func-tional groups. The Pb(II) adsorption capacity follows the order carboxylated montmorillonite/carbon > hydroxylated montmorillonite/carbon > aminated montmorillonite/car-bon > montmorillonite/carmontmorillonite/car-bon. Mechanistic study implies that the complexation of Pb(II) with functional groups on the surface of adsorbents plays an important role in its removal. All of those results indicate that the functionalized montmo-rillonite/carbon composites have excellent adsorption prop-erties for removing Pb(II) from contaminated water. Synthesis and properties of modified bentonite
Previous studies have demonstrated that bentonite can be adopted as a filler in the matrices of polymer due to the strong interactions between the Si–O–Si groups of bentonite and functional groups in polymer matrices, including –OH, –COOH, –NH2 and N-acetyl glucosamine units (Darder et al. 2005). In this work, we combined bentonite clay with the chitosan-poly(vinyl alcohol) (CTS-PVA) polymer matrix and synthesized a new type of chitosan-poly(vinyl alcohol)/ bentonite (CTS-PVA/BT) adsorbent.
Preparation of chitosan‑poly(vinyl alcohol)/bentonite nanocomposites
Due to the presence of impurities, including illite, kaolinite, feldspar quartz and carbonate, the pretreatment of raw ben-tonite is necessary to optimize the chemical and mechani-cal properties of the nanocomposites. Scheme 1 shows the process of pretreatment adopted in this work.
We prepared a series of chitosan-poly(vinyl alcohol)/ben-tonite composites with different benalcohol)/ben-tonite contents by cross-linking and interpenetrating polymer network technologies.
Table 4 Kinetic fitting parameters for the pseudo-first-order equation and pseudo-second-order equation, the pseudo-second-order model is more
suitable for describing the process of Pb(II) adsorption due to a higher correlation coefficient (R2)
Metal Qe (mg g−1) Pseudo-first-order equation Pseudo-second-order equation
Qe,c (mg g−1) k
1 (min−1) R2 Qe,c (mg g−1) k2 (g mg−1 min−1) R2
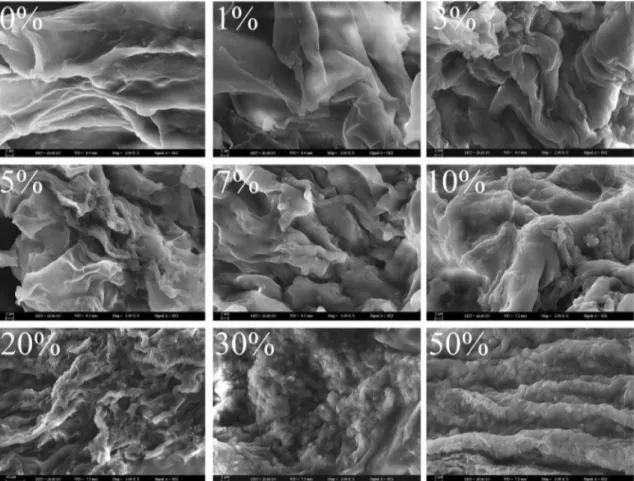
As shown in Scheme 2, we added poly(vinyl alcohol) aque-ous solution and a certain amount of bentonite into the chi-tosan solution. Next, we poured glutaraldehyde solution into the mixture. The mixture underwent freeze-thawed cycle for three times, and the nanocomposites were developed. Characterization of chitosan‑poly(vinyl alcohol)/bentonite nanocomposites Scanning electron microscope (SEM) photographs of the chitosan-poly(vinyl alcohol)/bentonite adsorbents with different bentonite contents are exhibited in Fig. 9. The surface topography of the chitosan-poly(vinyl alcohol)/bentonite adsorbent is apparently different from that of chitosan-poly(vinyl alcohol). After introduced ben-tonite, chitosan-poly(vinyl alcohol) produces many slit pleats and pores, compared to the tight bentonite surface. The surfaces of chitosan-poly(vinyl alcohol)/bentonite, with the increase in bentonite content from 1 to 7%, seem looser and more porous than that of chitosan-poly(vinyl alcohol), and no apparent protuberances were observed. With further increasing the bentonite content (beyond 7%), the protuber-ances become increasingly evident which can be attributed to the accumulation of clay tactoids due to the aggregation of clay tactoids.
As shown in Fig. 10, N2 adsorption isotherms reveal the
pore structure and specific surface area of the chitosan-poly(vinyl alcohol)/bentonite adsorbent. Based on the classification of IUPAC, the adsorption isotherms fit type
IV characteristics, suggesting that the chitosan-poly(vinyl alcohol)/bentonite adsorbent belong to the representa-tive mesoporous material. The hysteresis effect shows the typical H2 characteristics of interstices pores, which can be seen clearly under the circumstance of mesopore filling. With the increase in bentonite content from 1 to 50%, the hysteresis loop transfers to higher relative pres-sure, indicating the presence of larger mesopores. The Brunauer–Emmett–Teller (BET) analyses for surface area of chitosan-poly(vinyl alcohol)/bentonite adsorbent varied from 11.07 to 14.72 m2/g, with the total pore volume
rang-ing from 0.0168 to 0.0394 cm3/g. The small specific surface
area can be attributed to the structure of tight cumulating; in addition, the pore structure with low volume may be due to closed particles’ blocking effect.
The Derivative thermogravimetric analysis (DTG) and the thermogravimetric analysis (TGA) curves were used to study the thermal decomposition properties of the chi-tosan-poly(vinyl alcohol)/bentonite adsorbent. As shown in Fig. 11, two degradation stages are observed in both DTG and DTA curves. The first stage of mass reduction occurred at 110 °C, attributed to the evaporation of the residual water in the adsorbent. The second weight loss stage occurred between 250 and 540 °C, caused by the thermal decomposi-tion of chitosan-poly(vinyl alcohol)/bentonite. Furthermore, with the increase in bentonite content, the weight loss peaks in the DTG curves shifted to higher temperature ranges,
Scheme 2 Pretreatment process of raw bentonite (Wang et al.
suggesting the introduction of bentonite strengthened the thermal stability of the composites.
Heavy metal adsorption properties of chitosan‑poly(vinyl alcohol)/bentonite adsorbent Figure 12 shows the heavy metal adsorption capacities at equilibrium with different bentonite contents containing the individual species of heavy metal in acetic salt solutions. The Hg(II) equilibrium adsorption capacity of chitosan-poly(vinyl alcohol)/ben-tonite was far higher than that of Pb(II), Cd(II) and Cu(II), which indicates the synthetic chitosan-poly(vinyl alco-hol)/bentonite may exhibit special selective adsorption for Hg(II). With the bentonite contents of 50, 30, 10 and 0%, the Hg(II) adsorption capacities of chitosan-poly(vinyl alcohol)/ bentonite were 360.73, 392.19, 455.12 and 460.18 mg/g, respectively. Under the same conditions, we observed that the Hg(II) adsorption capacity of the pretreated bentonite was 11.20 mg/g. If bentonite clay particles were simply dis-tributed in the polymer matrix of chitosan-poly(vinyl
hol), the adsorption capacities of chitosan-poly(vinyl alco-hol)/bentonite should be equivalent of the total adsorption capacity of chitosan-poly(vinyl alcohol) polymer and ben-tonite, i.e., 235.69, 325.46 and 415.28 mg/g for chitosan-poly(vinyl alcohol)/bentonite with the bentonite contents of 50, 30 and 10%. The experimental data are far higher than the calculated values, indicating the nanocomposite is not just simple mixture. In addition, the bentonite clay took part in the preparation of chitosan-poly(vinyl alcohol)/bentonite and increased the Hg(II) adsorption capacity to a certain extent.
To further confirm the Hg(II) adsorption selectivity of the chitosan-poly(vinyl alcohol)/bentonite adsorbent, multi-component adsorption experiments were carried out. The distribution coefficient (Kd) represents the adsorption affinity
of the heavy metals for the adsorbent, which can a useful tool to research the retention and mobility of metal-cation in adsorbent system (Gomes et al. 2001). In the presence of other heavy metal ions, the selectivity coefficient (k) of the
Fig. 9 Scanning electron microscope (SEM) photographs of
chitosan-poly(vinyl alcohol)/bentonite adsorbent with different bentonite contents, surfaces of chitosan-poly(vinyl alcohol)/bentonite become looser and more porous than that of chitosan-poly(vinyl alcohol) with the increase in bentonite content from 1 to 7%; with further
increas-ing the bentonite content (beyond 7%), the protuberances become increasingly evident which can be attributed to the accumulation of clay tactoids due to the aggregation of clay tactoids (Wang et al.
chitosan-poly(vinyl alcohol)/bentonite adsorbent for Hg(II) is determined using the following equation:
(7) k= K d(Hg) K d(M)
where Kd(Hg) and Kd(M) stand for the distribution coef-ficients for Hg(II) and another heavy metal ion, respec-tively. The k values are presented in Table 5. With increas-ing bentonite content, the Hg(II) selectivity coefficient of the chitosan-poly(vinyl alcohol)/bentonite adsorbent increased, indicating that the Hg(II) adsorption selectivity of
Fig. 10 N2 adsorption isotherms of chitosan-poly(vinyl
alcohol)/ben-tonite adsorbent with different benalcohol)/ben-tonite contents, with the increase in bentonite content from 1 to 50%, the hysteresis loop transfers to higher relative pressure, indicating the presence of larger mesopores;
the small specific surface area can be attributed to the structure of tight cumulating; in addition, the pore structure with low volume may be due to closed particles’ blocking effect (Wang et al. 2014)
chitosan-poly(vinyl alcohol)/bentonite can be significantly improved by the introduction of bentonite clay. It can be con-sidered as the most meaningful finding to support the use of bentonite clay in the polymer matrix of chitosan-poly(vinyl alcohol).
Summary The chitosan-poly(vinyl alcohol)/bentonite nanocomposites have been synthesized by the combina-tion of bentonite and the chitosan-poly(vinyl alcohol) pol-ymer matrix. The chitosan-poly(vinyl alcohol)/bentonite nanocomposites possess a mesoporous structure, excellent adsorption capacity and selectivity for Hg(II) ions. The ben-tonite content greatly affects the microstructure of the nano-composites and their adsorption selectivity for Hg(II) ions. In addition, the selectivity coefficient of the nanocomposites toward Hg(II) ions increases with increasing the bentonite content.
Fig. 11 Thermogravimetric analysis (TGA) (a) curves and Derivative thermogravimetric analysis (DTG) (b) curves of chitosan-poly(vinyl alcohol)/bentonite composites with different bentonite contents, with the increase in bentonite content, the weight loss peaks in the DTG
curves shifted to higher temperature ranges, suggesting the introduc-tion of bentonite strengthened the thermal stability of the composites (Wang et al. 2014)
Fig. 12 Adsorption capacities of chitosan-poly(vinyl alcohol)/ben-tonite for different heavy metals, the Hg(II) equilibrium adsorption capacity of chitosan-poly(vinyl alcohol)/bentonite was far higher than that of Pb(II), Cd(II) and Cu(II), which indicates the synthetic chitosan-poly(vinyl alcohol)/bentonite may exhibit special selective adsorption for Hg(II) (Wang et al. 2014)
Table 5 Hg(II) selectivity coefficients (k) of chitosan-poly(vinyl
alcohol)/bentonite (CTS-PVA/BT) in the presence of other heavy metal ions, with increasing bentonite content, the Hg(II) selectivity coefficient of the chitosan-poly(vinyl alcohol)/bentonite adsorbent
increased, indicating that the Hg(II) adsorption selectivity of chi-tosan-poly(vinyl alcohol)/bentonite can be significantly improved by the introduction of bentonite clay
Heavy metals k
CTS-PVA CTS-PVA/5%BT CTS-PVA/10%BT CTS-PVA/30%BT CTS-PVA/50%BT
Pb(II) 456.24 567.43 586.82 670.83 719.22
Cd(II) 575.12 725.05 734.94 1354.35 1438.41
Cu(II) 1.83 1.55 1.67 1.71 3.64
Synthesis and properties of modified vermiculite Preparation of g‑polyacrylamide/vermiculite
nanocomposites
First, the raw vermiculite was acid-treated. Next, the a-Verm (acid-treated vermiculite) was organically modified as fol-lows: 3.0 g Verm, 1.0 mL water and 3.0 mL 3-(triethoxysi-lyl)propyl methacrylate were added to 100 mL toluene with ultrasonic agitation for 30 min. The final TEPM-modified acid vermiculite was abbreviated as OVerm. OVerm dis-persed into a three-neck flask with a certain amount of the toluene solution and stirred for 10 min, followed by the addi-tion of acrylamide monomer and 2, 2-azobisisobutyronitrile initiator. The obtained sample was denoted as polyacryla-mide/vermiculite (PAM/OVerm). Triethylenetetramine was applied to introduce more –NH2 to the long chain of polyacrylamide. PAM/OVerm was dispersed in a flask con-taining distilled water. The pH of the mixture was adjusted with sodium hydroxide or hydrochloric acid solution. Dur-ing stirrDur-ing at a specified temperature, formaldehyde and triethylenetetramine were added. The obtained adsorbent material is abbreviated as g-polyacrylamide/vermiculite (g-PAM/OVerm).
Characterization of g‑polyacrylamide/vermiculite nanocomposites
The derivative thermogravimetric analysis (DTG) curves of vermiculite samples (Fig. 13b) had an endothermic peak at about 91.6 °C, implying a loss of moisture. The TEPM-mod-ified vermiculite (OVerm) exhibited an endothermic peak at 312.4 °C, which was attributed to the decomposition of the TEPM. Moreover, the derivative thermogravimetric analysis
curves of polyacrylamide/vermiculite and g-polyacrylamide/ vermiculite also had an endothermic peak at 354 °C, which was largely caused by the decomposition of polyacrylamide. Moreover, the total mass loss of acid-modified vermiculite, TEPM-modified vermiculite, polyacrylamide/vermiculite and g-polyacrylamide/vermiculite at 25–750 °C were 11.14, 19.18, 24.28 and 26.11%, respectively (Fig. 13a). The mass loss demonstrates that the number of organic groups, includ-ing –C–H and –NH2, remaining in the samples per unit mass increased as the modification and grafting reactions proceeded. In other words, the thermogravimetric analysis and Derivative thermogravimetric analysis results confirmed
Fig. 13 Thermogravimetric analysis (TG) (a) and Derivative ther-mogravimetric analysis (DTG) (b) curves of acid-treated vermiculite (a-Verm), TEPM-modified vermiculite (OVerm), polyacrylamide/ vermiculite (PAM/OVerm) and g-polyacrylamide/vermiculite
(g-PAM/OVerm), the mass loss demonstrates that the number of organic groups, including –C–H and –NH2, remaining in the samples per unit
mass increased as the modification and grafting reactions proceeded
Fig. 14 N2 adsorption–desorption isotherms of vermiculite (Raw
Verm), acid-treated vermiculite (a-Verm), TEPM-modified vermicu-lite (OVerm), polyacrylamide/vermicuvermicu-lite (PAM/OVerm) and g-poly-acrylamide/vermiculite (g-PAM/OVerm), exhibiting type II isotherms with a hysteresis loop based on IUPAC classification, and the iso-therm type for all vermiculite samples in the series is the same
the presence of the polyacrylamide modification and –NH2 grafting reaction on vermiculite.
The nitrogen adsorption–desorption isotherms for a series of vermiculite samples (Fig. 14) exhibit type II isotherms, with a hysteresis loop, based on IUPAC classification. This indicates a large mesoporous distribution, with pore size between 2 and 50 nm (Valente et al. 2009). The hysteresis loops is type H3, in connection with the slit-shaped pores or plate-like particles. The isotherm type for all vermiculite
samples in the series is the same. The surface area (SBET) increased after acid modification. Raw vermiculite and acid-treated vermiculite had a SBET of 27.76 and 694.24 m2/g,
respectively. In addition, the surface areas of TEPM-mod-ified vermiculite, polyacrylamide/vermiculite and g-poly-acrylamide/vermiculite were 396.46 m2/g, 247.37 m2/g and
201.84 m2/g, respectively. S
BET decreased with the further
modification and grafting reaction. The smaller SBET of func-tionalized Verm was a consequence of the coverage of the silane coupling agent and polyacrylamide, which reduced the adsorption of N2 (Table 6).
Adsorption of Pb(II) by g‑polyacrylamide/vermiculite nanocomposites
The effects of time on the adsorption of Pb(II) by g-poly-acrylamide/vermiculite are given in Fig. 15a, b. The adsorp-tion rate was very fast during the first 20 min, during which the removal of Pb(II) was 120.1 mg g−1. After that, the
adsorption rate was very slow, and the adsorption equilib-rium gradually completed within 60 min for Pb(II). From
Table 6 Specific SBET of vermiculite (Raw Verm), acid-treated
ver-miculite (a-Verm), TEPM-modified verver-miculite (OVerm), polyacryla-mide/vermiculite (PAM/OVerm) and g-polyacrylapolyacryla-mide/vermiculite (g-PAM/OVerm), SBET decreased with the further modification and
grafting reaction; the smaller SBET of functionalized Verm was a
con-sequence of the coverage of the silane coupling agent and polyacryla-mide, which reduced the adsorption of N2
Samples Raw Verm a-Verm OVerm PAM/
OVerm g-PAM/OVerm SBET (m2/g) 27.76 694.24 396.46 247.37 201.84
Fig. 15 The pseudo-second-order kinetics (a), the pseudo-first-order kinetics (b), the adsorption rate was very fast during the first 20 min, during which the removal of Pb(II) was 120.1 mg g−1; after that, the
adsorption rate was very slow, and the adsorption equilibrium gradu-ally completed within 60 min for Pb(II), Langmuir plot (c) and
Fre-undlich plot (d) for the adsorption of Pb(II) by g-polyacrylamide/ vermiculite, Pb(II) adsorption by g-polyacrylamide/vermiculite increased with increasing initial Pb(II) concentrations, demonstrat-ing the Langmuir model can represent the adsorption isotherm results better than Freundlich
Table 7, the correlation coefficient value (r2) of the
pseudo-first-order model was relatively lower, showing a poor fit to the adsorption data. Nevertheless, the correlation coef-ficient for the pseudo-second-order was greater than 0.995. Meanwhile, the calculated qe value was also very close to
the experimental data, according to pseudo-second-order kinetics. The adsorption dynamics analysis suggests that the Pb(II) adsorption fit the pseudo-second-order kinetics model. Therefore, the pseudo-second-order mechanism was predominant in the process of Pb(II) removal by g-poly-acrylamide/vermiculite, which corresponded to the rate-con-trolling step of chemical adsorption (Ho and McKay 1999). Langmuir and Freundlich isotherm models were car-ried out to explore the Pb(II) adsorption equilibrium. The results are shown in Fig. 15c, d and Table 8. In general, Pb(II) adsorption by g-polyacrylamide/vermiculite increased with increasing initial Pb(II) concentrations. Additionally, the correlation coefficient (r2) values demonstrate the
Lang-muir model can represent the adsorption isotherm results better than Freundlich. This indicates that monolayer adsorp-tion mechanism works for the removal of Pb(II) because the active sites distribute evenly on the surface of g-polyacryla-mide/vermiculite (Vadivelan and Kumar 2005). Based on the Langmuir equation, the theoretical maximum adsorption capacity (qm) of Pb(II) on g-polyacrylamide/vermiculite is
219.4 mg g−1.
The reutilization of g-polyacrylamide/vermiculite on Pb(II) adsorption was performed in a batch experiment. Hydrochloric acid was used to extract the Pb(II) from the adsorbents for 30 min in a constant temperature vibration shaker. After separation by centrifugation, the g-polyacryla-mide/vermiculite was reused. Figure 16 reveals the Pb(II) adsorption capacity by g-polyacrylamide/vermiculite, and the removal efficiency of the regenerated g-polyacrylamide/ vermiculite could obtain 90% at the fifth test cycle, which
suggests that g-polyacrylamide/vermiculite adsorbents are promising for the efficient adsorption for Pb(II) (Gu et al.
2018). Summary
An effective approach to functionalization of Verm for removal of Pb(II) was developed by significantly improving specific surface area and silanol groups of Verm by acid activation and further modifying Verm surface with a series of organic reactions for introducing more functional amine groups. The amine-functionalized Verm showed much greater efficiency in Pb(II) adsorption at different pH values
Table 7 Parameters of kinetic models of Pb(II) adsorption onto g-polyacrylamide/vermiculite, the adsorption dynamics analysis suggests that the Pb(II) adsorption fit the pseudo-second-order kinetics model with the correlation coefficient for the pseudo-second-order greater than 0.995
Metal ion Pseudo-first-order Pseudo-second-order
qe (mg g−1) k
1 (min−1) r2 qe (mg g−1) k2 (g mg−1 min−1) r2
Pb2+ 131.1 0.1447 0.9903 146.7 0.00128 0.9954
Table 8 Langmuir and Freundlich parameters for Pb(II) adsorption on the g-polyacrylamide/vermiculite, the correlation coefficient (r2)
values demonstrate the Langmuir model can represent the adsorp-tion isotherm results better than Freundlich, indicating that monolayer
adsorption mechanism works for the removal of Pb(II) because the active sites distribute evenly on the surface of g-polyacrylamide/ver-miculite
Metal ion Langmuir Freundlich
QM (MG G−1) K
L (L/mg) r2 KF (mg1−n Ln g−1) n r2
Pb2+ 219.4 2.8307 0.9851 11.33 1.99 0.9498
Fig. 16 Regeneration of g-polyacrylamide/vermiculite after five cycles, the removal efficiency of the regenerated g-polyacrylamide/ vermiculite could obtain 90% at the fifth test cycle, suggesting that
g-polyacrylamide/vermiculite adsorbents are promising for the
than unmodified Verm. Furthermore, g-polyacrylamide/ver-miculite has better selectivity for Pb(II) ion in comparison with Zn(II), Cd(II) and Cu(II) ions. The adsorption equi-librium data on g-polyacrylamide/vermiculite were in good agreement with the Langmuir adsorption isotherms. The kinetics data fit the pseudo-second-order kinetic well. The great adsorption capacity of g-polyacrylamide/vermiculite might be because of the presence of strong covalent bonds between Pb(II) and the –NH2 groups.
Heavy metal removal by 2:1 type layer‑chain clay Synthesis and properties of modified attapulgite
Preparation of chitosan‑poly(vinyl alcohol)/attapulgite nanocomposite The preparation of chitosan-poly(vinyl alcohol)/attapulgite was similar to that of chitosan-poly(vinyl alcohol)/attapulgite: raw materials cross-linking using atta-pulgite, poly(vinyl alcohol) and chitosan; strong agitating the mixture (attapulgite, poly(vinyl alcohol) and chitosan) to get a homogeneous suspension for a desired duration time; the addition of a proper amount of glutaraldehyde solution to get a gel. After a number of freeze-thawed cycles, the chitosan-poly(vinyl alcohol)/attapulgite nanocomposites were obtained. Furthermore, chitosan-poly(vinyl alcohol) (without attapulgite) was also synthesized for comparison following the same steps.
Characterization of chitosan‑poly(vinyl alcohol)/attapulgite nanocomposites
The X-ray diffraction (XRD) patterns of attapulgite, poly(vinyl alcohol), chitosan and the chitosan-poly(vinyl alcohol)/attapulgite adsorbent are shown in Fig. 17. The typical diffraction peak of attapulgite at 8.38° appeared cor-responding to the interlayer spacing of 10.54 Å. After the interaction with poly(vinyl alcohol) and chitosan, the peak shifted to 8.34°, which corresponded to an interlayer spacing of 10.59 Å. The slight change suggests the formation of a weak interaction between attapulgite and poly(vinyl alcohol) or chitosan in the preparation process of chitosan-poly(vinyl alcohol)/attapulgite, which resulted in the slight change in the microstructure of attapulgite crystal (Zhang et al. 2005; Xue et al. 2011).
Figure 18 shows the FTIR spectra of chitosan-poly(vinyl alcohol)/attapulgite nanocomposite, chitosan-poly(vinyl alcohol) and APT. In the spectrum of the chitosan-poly(vinyl alcohol)/attapulgite, the broad peak at 3425 cm−1 was
ascribed to the stretching vibrations of –NH2 and –OH groups. The absorption peak at 1650 cm−1 was ascribed
to the C–O stretching vibration of –NHCOCH3 group, and
the peak of the C–N bond, constituted through the reaction between –CHO groups of glutaraldehyde and –NH2 groups of chitosan, was also observed in this region. The absorp-tion peaks in the 1030–1160 cm−1 region were assigned to
the overlap of the stretching C–O and C–N, coupled with the bending of –OH groups. And the absorption peaks at 1421 and 1380 cm−1 were attributed to the bending and
scis-soring vibrations of –CH2 groups (Orozco-Guareño et al.
2010). In comparison with APT, in the spectrum of chitosan-poly(vinyl alcohol)/attapulgite, the stretching vibration peaks of Si–OH at 3553 cm−1, 3583 cm−1 and 3617 cm−1
decreased and transferred to the lower wavenumbers (Blanco et al. 1989). The Si-OH stretching vibration and bending vibration of APT at 1660 cm−1, 1030 cm−1 and 984 cm−1
were not observed. Moreover, the bending vibration of Si–O at 507 cm−1 and 479 cm−1 shifted to lower wavenumber
(464 cm−1). This indicates that the Si–OH groups on the
surface of APT participated in the structure of the nanocom-posites. The stretching vibration of –C–O–C– groups in the chitosan-poly(vinyl alcohol)/attapulgite apparently shifted from 1073 cm−1 to the a lower wavenumber (1044 cm−1),
in comparison with chitosan-poly(vinyl alcohol). This was ascribed to the hydrogen bonds originating from –OH in the chitosan polymer and Si–OH on the surface of APT. Cu(II) adsorption mechanisms on the chitosan‑poly(vinyl alcohol)/attapulgite
The binding energies and the X-ray photoelectron spec-troscopy (XPS) spectra of Cu-2p of chitosan-poly(vinyl
Fig. 17 The X-ray diffraction (XRD) patterns of chitosan-poly(vinyl alcohol)/attapulgite (CTS-PVA/APT) nanocomposite, poly(vinyl alcohol) (PVA), chitosan (CTS) and attapulgite (APT), the changes of diffraction peaks suggest the formation of a weak interaction between attapulgite and poly(vinyl alcohol) or chitosan in the preparation pro-cess of chitosan-poly(vinyl alcohol)/attapulgite, which resulted in the slight change in the microstructure of attapulgite crystal (Wang and Wang 2016)