AT THE EARTH’S SURFACE
A. OHMURA
Institute for Atmospheric and Climate Science, Swiss Federal Institute of Technology (ETH), Universit¨atstr. 16, CH-8092 Zurich, Switzerland; Scott Polar Research Institute,
University of Cambridge, UK (E-mail: [email protected])
(Received 14 November 2005; Accepted in final form 27 January 2006)
Abstract. The variation of global radiation (sum of direct solar and diffuse sky radiation) at the Earth’s surface is examined based on pyranometer measurements at about 400 sites. The period of the study covers in general the last 50 years. For Europe the study is extended to the beginning of observations in the 1920s and 1930s. Global radiation generally increased in Europe from the 1920s to the 1950s. After the late 1950s and early 1960s global radiation began to decrease in most areas of the world at a mean rate of 0.7 Wm−2a−1until 1980s, thereafter 75% of the stations showed a recovery at a mean rate of 0.7 Wm−2a−1. All stations in the Polar region, which are far from aerosol sources, also show this pattern of change. At the remaining 25% of the stations the decrease has continued to present. These regions are a part of China, most of India, and Central Africa. Both during the declining and recovering phases global radiation observed under the cloudless condition also followed the same tendency, indicating the simultaneous and parallel changes of aerosol and cloud conditions. Long-term observations of total zenith transmittance of the atmosphere indicate a decrease in transmittance to the mid 1980s and an increase after this period. Since the brighter and darker periods correspond to relatively warmer and colder periods, the present study offers the possibility to quantitatively evaluate the mutual relationships between the solar irradiance, atmospheric transmittance, cloud conditions and air temperature.
Keywords: climate change, radiation, irradiance, aerosol, atmospheric transmission
1. Introduction
The awareness that radiation in the climate system might change is not old and even today not fully grasped by many professionals. An example of the acceptance difficulty is the term, solar constant, obviously conceived under the unquestioned assumption that the emission of the Sun is invariable. The same applies to irradi-ances at the Earth’s surface. Budyko (1982) demonstrated that global radiation is stable over a long period and several years’ observations suffice to characterize a site with a stable mean value. One of the first attempts to question the long-term stability of a radiative component was that by Kessler (1985) with respect to global radiation in Hamburg. Ohmura and Lang (1989) presented observational evidence that global radiation over Europe decreased systematically by about 8 Wm−2during the 30 years following the International Geophysical Year (IGY). The variation was
Space Science Reviews (2006) 125: 111–128
explained by the change in cloud cover. This work was based on the radiation and heat balance data accumulated in the Global Energy Balance Archive (GEBA). Stanhill and Moreshet (1992) investigated solar radiation for Israel, to find a grad-ual but clear decline of global radiation. Liepert et al. (1994) presented a decreasing trend in global radiation over Germany, attributing the change to aerosol. By this time the global dimension of the decreasing tendency in global radiation began to be recognized by more scientists and was coined as global dimming. During the 2002 Radiation Panel meeting of the Global Energy and Water Cycle Experi-ment (GEWEX) in Zurich, William B. Rossow of the Goddard Institute of Space Studies (GISS/NASA) presented two diagrams portraying the time series of total cloud amount for the globe and for the Tropics, based on the results of International Satellite Cloud Climatology Project (ISCCP) encompassing 20 years from 1983 to 2002. The diagrams indicated an unmistakably increasing trend in cloud amount towards the end of the 1980s followed by a rather sharp decrease by as much as 5% over these 15 years. These diagrams gave the author an important hint to examine global radiation by supplementing GEBA with the post-1985 data. In 2003 the author started to compile the post-1985 global radiation data based on the sources in the World Radiation Data Center (WRDC), St. Petersburg, its duplicate of data for earlier years at National Renewable Energy Laboratory (NREL), Golden, CO, and contributions from a number of national meteorological services and research institutions of the world. The present article is intended to present the results of the analyses of global radiation from the earliest observation to the present. Emphasis is, however, given to the post-1985 period.
2. Data Compilation and Quality Control
The best dataset for the present subject is GEBA which contains monthly mean fluxes relevant to the surface energy balance for about 1600 sites (Ohmura and Gilgen, 1992; Gilgen et al., 1998). The data in this archive are instrumentally measured and quality tested. The quality test is made up of four stages orga-nized in ascending order of strictness, and known today as the GEBA qual-ity scheme (Ohmura et al., 1989). This set contains data for the majorqual-ity of the sites only up to 1985. The updating of the dataset for the post-1985 period was an urgent requirement and has been completed at least for global radiation in the occasion of this work. Presently GEBA stores about 250,000 month site fluxes.
A major effort was made to collect the monthly mean global radiation, and in limited cases the total zenith transmittance or pyrheliometric data. Global radiation data are available for many sites at the NREL file that stores the data of the WRDC up to 1990. The data for the period starting 1991 are available from the WRDC in St. Petersburg. This file however often lacks the data of the early 1990s, and those of 1992 are entirely missing.
Many organizations such as national meteorological services possess much of the data missing at WRDC. There are also many public and private research in-stitutions and observatories that possess large amounts of radiation data that may not have been forwarded to WRDC or other equivalent international data archives. A new campaign of requesting data from these institutions was a modest success, bringing the data for the missing period from 600 stations, of which about 400 sta-tions were judged to be of an acceptable quality for the present purpose.
A large amount of quality data is available from the Baseline Surface Radiation Network (BSRN) for the period from 1992 to present. This short but very important period for detecting changes compensates for the missing data for a number of sites in WRDC. In addition, the BSRN data are usually of the highest quality, and offer direct and diffuse sky radiation with auxiliary meteorological data observed at the same sites.
The uncertainty of the measurements by commercially available pyranometers is the order of±3 Wm−2for a short period of observation such as one hour. The sys-tematic error of the long-term observations can be kept much smaller (±1.5 Wm−2), when the instruments are well maintained and regular recalibrations are applied twice a year.
Through these efforts a substantial amount of monthly mean global radiation data have been added to the existing GEBA to complete the updating work. This dataset is accessible at http://bsrn.ethz.ch.
3. Results
The variation of global radiation will be discussed in the following Sections with respect to geographic regions followed by a Section summing up for the globe. For regions with a sufficient number of stations with continuous records, an arithmetic regional mean was calculated in addition to individual station time series. If the region lacks a continuous series, the arithmetic mean excluding the missing years often introduces an artifact fluctuation. In such a case, the regional mean is calcu-lated after the series for each station are normalized with respect to their long-term means.
3.1. EUROPE AND THEBRITISHISLES
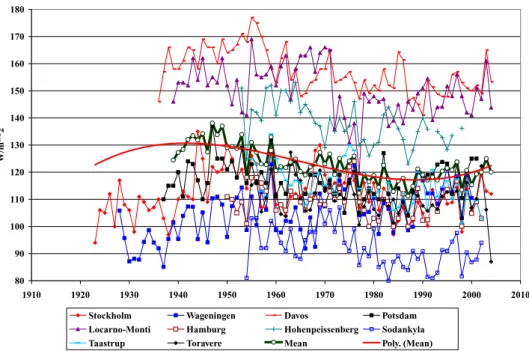
The longest observation series are available in Europe. At five sites, Stockholm, Wageningen, Davos, Potsdam and Locarno-Monti the observations started be-fore 1940. Although the distances between Stockholm, Wageningen, Potsdam and Locarno are the order of 1000 km, the development of the decadal change in ra-diation is amazingly similar (Figure 1). At all locations global rara-diation increased throughout the 1940s arriving at a peak sometime between the late 1940s and early
Global radiation for Europe for sites with more than 50 years observation 80 90 100 110 120 130 140 150 160 170 180 1910 1920 1930 1940 1950 1960 1970 1980 1990 2000 2010 W/m**2
Stockholm Wageningen Davos Potsdam
Locarno-Monti Hamburg Hohenpeissenberg Sodankyla
Taastrup Toravere Mean Poly. (Mean)
Figure 1. Annual mean global radiation for ten sites with more than 50 years observation in Europe.
Regional mean is expressed in a thick green line with open circles. The polynomial trend is given in a thick red line.
1950s. The longer two series at Stockholm and Wageningen indicate that the in-creasing trend was already set in the 1920s. Global radiation increased between 1922 and 1952 by 20 Wm−2. The mean rate of increase during the 1940s for Stockholm was 1.4 Wm−2a−1, while the regional mean was 0.5 Wm−2a−1. After the peak was reached in the late 1940s, global radiation decreased during the following 40 years until the late 1980s. Global radiation showed a recovery after late 1980s but the level remains well below the peak value of the late 1940s at all stations. The number of the sites increased rapidly after 1950 and we can add five more sites (Hamburg, Hohenpeissenberg, Sodankyla, Taastrup and Toravere) for this period, allowing a more detailed and accurate analysis. Because of the short nature of the observed period, however, this period of 50 years gives a possibility of estimating the am-plitude of the fluctuation observed only for the declining period. Examining the northernmost site of Sodankyla to the southernmost site of Locarno, the absolute magnitudes of the decline from the peak to the bottom increase from north to south with the range of 10 to 15 Wm−2 over the 40 years, which corresponds to about 10% of the annual mean global radiation at these sites. This value is larger than the decline proposed by Ohmura and Lang (1989) of 8 Wm−2over 30 years from the late 1950s to the late 1980s. The subsequent recovery registered an increase of about 6 Wm−2from 1990 to 2003.
The British Isles was earlier characterized as a region showing a prolonged increasing phase of global radiation in comparison with the rest of Europe (Ohmura and Lang, 1989). The British Isles is also an area lacking a good set of long-term observations. Therefore, for this region a mean of the normalized irradiance was calculated with 7 stations (Aberporth, Jersey, Belfast, Eskdalemuir, Lewick, Bracknell, and London). Global radiation indeed appeared to be increasing if the data only up to the mid 1980s were considered. The addition of the post-1985 data resulted in a clearer picture in which global radiation reached a peak in the late 1950s and continued to decline in the following 30 years by−0.04 in the normalized scale or−4 Wm−2. The recovery has been very steep at 0.06 or 7 Wm−2during the last 10 years. Therefore, unlike the earlier characterization, the region followed the general trend of the global dimming and the subsequent brightening seen in the rest of Europe. The phase of the brightening, however, seems to have been delayed by about 5 years.
3.2. ISRAEL
In Mediterranean Europe and the Near East, the only region for which the present analysis can be applied is Israel. Stanhill and Ianetz (1997) reexamined the data used earlier and concluded that global radiation decreased during the period of 40 years from 1954 to 1994, at a mean rate of 1.02 Wm−2a−1, despite a slight decrease in cloud amount. They pointed at the possible effect of aerosol including biogenic aerosol. The analysis of the data of the last 10 years will give an important clue as to if this region is also recovering from the trend of long dimming.
3.3. JAPAN
Japan is probably the best region to examine whether the secular variation discov-ered in Europe is local or global. It is far from Europe and has a well-run network of radiometry with a long history. Presently the series for 102 sites are available of which 49 stations have observational records longer than 40 years starting in 1961. The older data going back to the 1930s are located at the Japan Meteorology Agency, but the homogenization of the time series is ongoing. There are 26 sites among them that are of first class quality and continuation. Annual mean global radiation for these 26 sites and the regional means are presented in Figure 2. All locations share a declining trend from the early 1960s to late 1980s that is followed by a recovery at about the same rate. The mean of the 26 sites indicates a decline by 25 Wm−2 from 1961 to 1990 at a rate of−0.8 Wm−2a−1. The recovery from 1990 to 2002 is 10 Wm−2over 12 years at 0.8 Wm−2a−1. Although this set of data does not include the earlier brightening phase of the pre-1960s, the declining trend from the early 1960s to late 1980s and the brightening phase from the early 1990s to the present are similar to the European sequence.
Annual mean global radiation for 26 best stations, Japan 100 120 140 160 180 200 220 1955 1960 1965 1970 1975 1980 1985 1990 1995 2000 2005 W/m2
Sapporo Morioka Akita Sendai Fukushima
Yamagata Onahama Takada Tateno Tokyo
Nagoya Hikone Yonago Maizuru Shiminoseki
Hiroshima Nara Izuhara Fukuoka Saga
Kumamoto Matsuyama Takamatsu Kochi Shimizu Naha Mean of Japan Poly. (Mean of Japan)
All
Figure 2. Annual mean global radiation for 26 best stations in Japan for the period 1961–2002.
Regional mean is expressed in a thick green line with open circles. The polynomial trend is given in a thick red line.
3.4. CHINA AND ADJACENT COUNTRIES
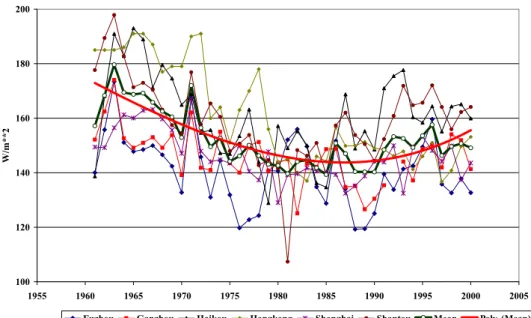
The Chinese National Meteorological Administration operates a network of 121 sta-tions with observasta-tions of global radiation for a period of 40 years from 1961 to 2000. The author selected 66 sites considered to be of long lasting and better quality. These stations show two distinctive types of the variation: the majority (46 sites) show an initially declining tendency up to the 1980s, then a clear recovery starting in the early 1990s, while a small number of sites (20) show a trend of continued dimming to present. As an example of the majority of sites, 6 stations with the best records in southeast China are presented in Figure 3. Although the scatter of individual annual means is large, the regional means indicate a decline of 30 Wm−2 from 1960 to the late 1980s with a rate of 1.2 Wm−2a−1. This rate belongs to the steepest rate witnessed in the world, besides Northern and Central Africa. The recovery after the late 1980s to 2000 is 10 Wm−2. Zhang et al. (2004) reports a continued dimming for the period from 1961 to 2000 for this region, based on the observations at Shanghai, Nanjing and Hangzhou. This work applied only a linear trend analysis. If the time series are carefully analyzed, however, they show an unmistakable reversal of the trend in the late 1980s. A unique variation is seen in northwestern China where more than half of the stations show a continuous decline of global radiation (Figure 4). In this region a 25 Wm−2decrease was seen as the
Best 6 stations in southeast China 100 120 140 160 180 200 1955 1960 1965 1970 1975 1980 1985 1990 1995 2000 2005 W/m**2
Fuzhou Ganzhou Haikou Hongkong Shanghai Shantou Mean Poly. (Mean)
Figure 3. Annual mean global radiation for 6 best stations in southeast China (Fuzhou, Ganzhou,
Haikou, Hongkong, Shanghai and Shantou). Regional mean is expressed in a thick green line with open circles. The polynomial trend is given in a thick red line.
regional mean in the 40 years from 1960 to 2000. There is no indication of an increase at present. Figure 5 shows a regional distribution of the two types of the radiation changes. In the immediately adjacent areas, four sites in Mongolia, two sites in Kazakhstan, one site each in Uzbekistan and in South Korea are added. The sites with continued dimming are located mostly north of the Yangtze River and in northern China. Further to the north in Mongolia, however, there is not a single site with continued dimming. The mean condition in Mongolia is a steady decrease from 1965 till the mid 1980s of 15 Wm−2, followed by a steep recovery of 10 Wm−2from 1990 to 2002.
3.5. INDIANSUB-CONTINENT
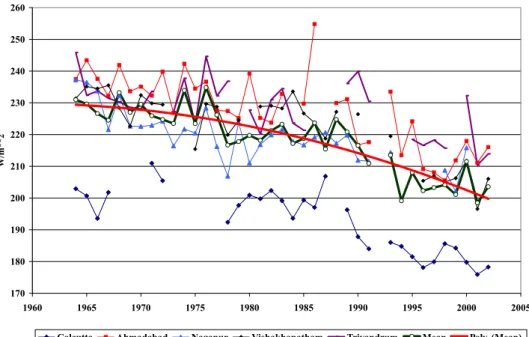
Although India reports global radiation for 15 sites to WRDC, 5 stations are con-sidered to be useful for the present purpose with respect to the length of observation and quality of data. The annual means and their averages for the entire India are presented for the period from 1964 to 2002 in Figure 6. While other stations re-port similar annual means within a narrow range from 200 to 230 Wm−2, Calcutta shows systematically 20 Wm−2lower values, indicating an influence of acute local pollution. All sites, however, show basically the same trend of decrease amounting to 30 Wm−2over the 39 years. There is no sign of recovery.
Best 7 stations in northwest China 100 120 140 160 180 200 220 240 1955 1960 1965 1970 1975 1980 1985 1990 1995 2000 2005 W/m**2
Altay Hami Kuqa Turpan Urumqi Yining Lanzhou Mean Poly. (Mean)
Figure 4. Annual mean global radiation for 7 best stations in northwest China (Altay, Hami, Kuqa,
Turpan, Urumqi, Yining and Lanzhou). Regional mean is expressed in a thick green line with open circles. The polynomial trend is given in a thick red line.
15 20 25 30 35 40 45 50 55 60 70 80 90 100 110 120 130 140
Dimming continuing Dimming followed by brightening
Best five stations in India 170 180 190 200 210 220 230 240 250 260 1960 1965 1970 1975 1980 1985 1990 1995 2000 2005 W/m**2
Calcutta Ahmadabad Nagapur Vishakhapatham Trivandrum Mean Poly. (Mean)
Figure 6. Annual mean global radiation for 5 sites in India (Calcutta, Ahmadabad, Nagapur,
Vishakhapatham and Trivandrum). Regional mean is expressed in a thick green line with open circles. The polynomial trend is given in a thick red line.
3.6. AFRICA
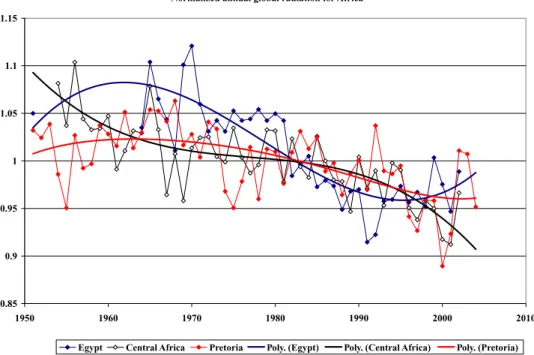
The only region in Africa, north of the Sahara, with systematic radiation mea-surements is Egypt and Tunisia. There are broken records at 4 sites, Tahrir, Cairo, Bahtim and Aswan in Egypt. The records from all these sites indicate the initial dimming and recent recovery, but it appears that the time of the recovery was some-what delayed in comparison with other regions. Since none of these records cover 30 years continuously, and the absolute values among stations differ considerably, the author has only presented the mean of normalized values with respect to the long-term means at each site (Figure 7). The mean curve shows global radiation reaching its peak in the late 1960s and decreasing from the early 1970s to early 1990s. The decline over the 20 years is 0.11 in the normalized scale, which corre-sponds to 26 Wm−2. The recovery starting in the mid 1990s is a modest 8 Wm−2 but has clearly been increasing over the past 8 years. Sidi Bouzid in Tunisia shows basically the same pattern as Egypt, but it shows the initial increasing phase more clearly than Egypt, and reaches its peak in the early 1970s. The range of the subse-quent dimming is 13 Wm−2and is much smaller than in Egypt. The appearances of peaks and valleys in the Mediterranean North African series seem to drag behind Europe by 15 to 20 years.
Normalized annual global radiation for Africa 0.85 0.9 0.95 1 1.05 1.1 1.15 1950 1960 1970 1980 1990 2000 2010
Egypt Central Africa Pretoria Poly. (Egypt) Poly. (Central Africa) Poly. (Pretoria)
Figure 7. Normalized annual mean global radiation for Africa (Cairo, Tahrir, Bahtim and Aswan in
Egypt; Kinshasa, Boende, Harare and Bulawayo in Central Africa; Pretoria in South Africa). Trend lines for each region are expressed in the same colours.
Two countries in Central Africa supply two records each, Kinshasa and Boende in Zaire, and Harare and Bulawayo in Zimbabwe. The records covering almost 50 years from 1954 to 2002 are, however, discontinuous. Therefore, as in the case of North Africa, normalized means have been calculated based on these 4 records and added in Figure 7. Global radiation in this region continued to decrease from the mid 1950s up to present, by 0.14, which corresponds to a decrease of 30 Wm−2over 49 years. Kenya also provides global radiation data for 3 sites, Nairobi, Mombasa and Voi, but these data are not of sufficient quality to be considered.
Maputo in Mozambique offers some of the better data in Africa, starting in the 1950s and continuing to present with only few breaks. The variation in this series is unique in that it shows a decline from the mid 1950s to mid 1970s by as much as 30 Wm−2, followed by a slight brightening. The last 10 years show again a clear decline by 20 Wm−2. The phase is exactly the opposite of what was seen in the Northern Hemisphere. At the moment this pattern does not show any similarity to the other regions. The author believes, however, that this time series may reflect a regionally important situation that is worthy of detailed investigation.
The best radiation records in Africa are available in South Africa. In Pretoria, for example, the observation of global radiation has continuously been made since 1951. The quality of the data is excellent. Global radiation increased gradually to
the late 1960s, followed by a decline to 1990s by 15 Wm−2, and then by a clear increase. The pattern of the change is similar to Europe with a phase lag of about 10 years (Figure 7).
3.7. SOUTHAMERICA
It is unfortunate that there is not a single site in South America that can be used for the present analysis. Nevertheless, global radiation records from Caracas and Coro, Venezuela are analyzed. The data series are frequently broken and the calibration is uncertain. There is, however, no concrete reason to reject these data. If we trust the records, global radiation in this part of South America decreased over 35 years from 1963 to 1998 by about 40 Wm−2, which makes an annual rate of−1.1 Wm−2a−1. This is a very rapid decline in global radiation but similar declining rates are found in Central Africa and southeastern China. More recent data are not available. 3.8. NORTHAMERICA(CONTIGUOUS) INCLUDINGALASKA
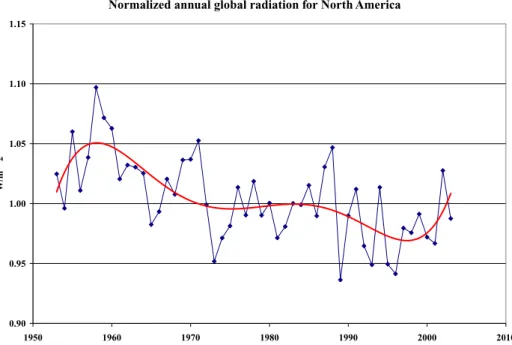
North America taking the contiguous USA and Canada together does not have a good record of long-term observations. Therefore, the annual global radiation only for three better series, Bismarck, Boulder and Toronto has been normalized and the mean series was constructed (Figure 8). In the early 1950s global radiation was still on the rise culminating in the late 1950s. It fell for the next 40 years by 0.08 in the normalized scale or 13 Wm−2and took a recovery course in the mid 1990s. The absolute magnitude of the recovery is very small at 5 Wm−2at this stage. The pattern of the change is similar to Europe with a delayed phase of about 10 years.
There is only one site in Alaska that provides more than 50 years of global radiation records with some breaks. Barrow in Figure 9 indicates an increasing trend lasting until the early 1960s, followed by a 30 years declining phase until the early 1990s. The magnitude of the decline is 8 Wm−2. The recovery during the last 10 years is very small but clearly visible. It appears as if the pattern is similar to Europe with damped amplitude but the phase is delayed by 10 years. The other site with a good prospect of the study is Fairbanks, which needs still some work to clarify.
3.9. OCEAN SURFACE, OCEANIA, ARCTIC ANDANTARCTIC
The observation for this vast area is still insufficient. To cover major ocean surfaces, there are only two possibilities, either to rely on island-based observations or to use satellites. The short history of satellite data excludes the latter possibility. Island-based measurements are scarce, mostly short lived and prone to lose accurate calibration. Nevertheless, there are some results worthy of consideration. Figure 10 presents two sites available from the tropical Pacific, one in Fiji and the other in
Normalized annual global radiation for North America 0.90 0.95 1.00 1.05 1.10 1.15 1950 1960 1970 1980 1990 2000 2010 W/m**2
Figure 8. Normalized annual mean global radiation for North America (Bismarck, Boulder and
Toronto). The polynomial trend is expressed in the smooth curve. Annual global radiation for Arctic stations
70 75 80 85 90 95 100 105 110 115 120 1950 1955 1960 1965 1970 1975 1980 1985 1990 1995 2000 2005 W/m**2
Aklavik/Inuvik Resolute Barrow Sodankyla
Poly. (Aklavik/Inuvik) Poly. (Resolute) Poly. (Barrow) Poly. (Sodankyla)
Figure 9. Annual mean global radiation for Arctic stations (Aklavik/Inuvik, Resolute, Barrow and
Annual mean global radiation for Tropical Pacific 100 120 140 160 180 200 220 240 260 1960 1965 1970 1975 1980 1985 1990 1995 2000 2005 W/m**2
Nandi, Fiji Suva, Fiji Science Garden, Phlipplines Regional mean Poly. (Regional mean)
Figure 10. Annual mean global radiation for the tropical Pacific (Nandi and Suva in Fiji; Science
Garden in the Philippines). Regional mean is expressed in a thick green line with open circles. The polynomial trend is given in a thick red line.
the Philippines. Although there are no similarities between these series and the others, it is worthy to note that these two sites in the tropical Pacific show quite large fluctuations with peaks from the late 1970s and 1980s, and are presently losing radiation. In the case of Fiji, the increase from the 1960s to the end of 1980s is 30 Wm−2, and the decline during the last 15 years is 35 Wm−2at Nandi based on 40 years of continuous observation. We have little material to disprove the credibility of these data. Another station in Fiji at Suva also shows a similar sequence after 1985. The only other location offering a series of more than 30 years in the tropical Pacific is the Science Garden in the Philippines. This spot shows a range of increase amounting to 35 Wm−2 between 1965 and the peak time in the late 1970s. The presently continuing dimming trend shows already a 35 Wm−2 lower value than in the late 1970s. It is difficult to prove if these large ranges of variability in the tropical regions are real or artifact. The definite answer rests on having long series of accurate radiometry at a number of places in the tropics.
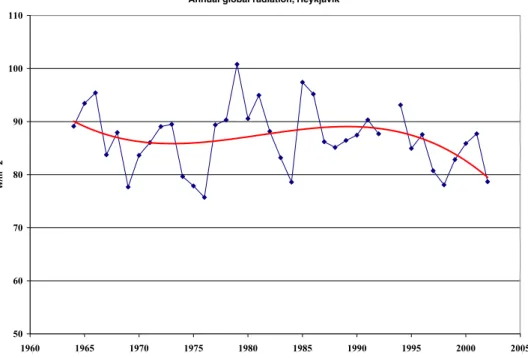
For the high latitude ocean climate region, Iceland was chosen. Figure 11 for Reykjavik shows the variation for 39 years from 1964 to 2002. What is common to all ocean stations discussed above is the recent decline of radiation starting in late 1980s. This is the time when the majority of land-based stations started to show signs of brightening.
Annual global radiation, Reykjavik 50 60 70 80 90 100 110 1960 1965 1970 1975 1980 1985 1990 1995 2000 2005 W/m**2
Figure 11. Annual mean global radiation for Reykjavik, Iceland. The polynomial trend is expressed
by the smooth curve.
Australian series do not show any significant trends, not because global radiation lacked in long-term variation (Stanhill and Kalma, 1994; Stanhill, 2005), but the Bureau of Meteorology adjusted long-term averages to a fixed value to compensate for a possible drift of calibration (B. Fogan, private communication). A re-analysis based on the history of calibration is presently under way.
In the Arctic and Antarctic, there are not sufficient long-term observations of reliable quality on which the calculation of the decadal variation can be justified. The main reason is the frequent atmospheric disruptions to measurements such as frost condensation, rime accretion and snowfall. Most time series are interrupted by long breaks. Nevertheless, Stanhill (1995) and Stanhill and Cohen (1997) reported significant decline in global radiation in both polar regions up to the mid 1990s. The rate of decrease is 0.36 Wm−2a−1and 0.28 Wm−2a−1for the Arctic and Antarctic, respectively. Since the technology to avoid these problems has been available for some time, the observations made in recent years must supply a valuable addition to the post-1990 period. Besides Barrow, three stations (Aklavik/Inuvik, Resolute and Sodankyla) in the Arctic have been added in Figure 9. All Arctic stations show a broad peak in the late 1950 and early 1960s, followed by about 30 years of decline. All sites also show a recent brightening tendency. All polar stations of BSRN (Ny Alesund, Barrow, Syowa, von Neumayer and South Pole) show an increasing trend for the period after 1992. The mean rate of the increase for the Arctic and Antarctic
are 0.40 Wm−2a−1 and 0.73 Wm−2a−1, respectively. The fact that these remote sites show a clear dimming trend only to the late 1980s, and a recovering tendency after 1990 suggests the global nature of the switch from the dimming to brightening at this time.
3.10. GLOBALCONDITION
The observations of global radiation at 380 stations lasting more than 40 years have been analyzed. The longest series is the measurement in Stockholm starting in July 1922. The majority (75%) of stations show a similar sequence of radiation change over the last 40 years. They show a declined of radiation from the early 1960s to the end of the 1980s, followed by a recovery during the last 10 to 15 years. Much longer observations available only in Europe show an initially increasing trend from 1920s to 1950s, thereafter a decline as mentioned above. Six sites in the Arctic and Antarctic also share this trend during the last 50 years. The trends in the polar regions are considered to represent the changes in a large region of the world, as the region is far from major aerosol sources. In 4 regions, middle China, the entire Indian subcontinent, Central Africa and Venezuela global radiation has continued to decrease during the last 40 years of the observation period. It is not possible to investigate the situation in these regions for the period prior to 1960. Although represented by only small number of sites, Maputo (Mozambique), Nandi (Fiji), Science Garden (the Philippines) and Reykjavik (Iceland) show a rather rare succession of the change. Radiation increased towards the late 1980s and early 1990s and then started to decrease to present. This is a trend completely opposite to what the majority of the above-discussed sites show. This sequence is also different from the stations with continuous dimming, as they reveal a clear brightening phase in 1970s. This peculiar trend of a small number of stations should be further studied in detail, as all these sites are located in oceanic regions and may represent a large area of the world.
4. The Cause of the Secular Variation
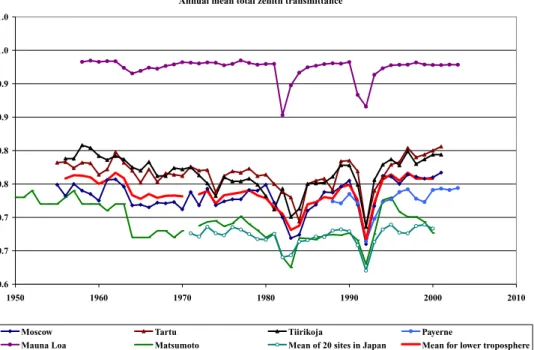
For the period after January 1992, as BSRN data became available, the global brightening has been recognized at the majority of stations in the network ranging from Svalbard to the South Pole (Wild et al., 2004). Further it was found that global radiation observed under cloudless conditions also showed the same increasing tendency. This means that the basic tendency of global radiation is shaped not only by the change in cloud conditions as previously believed but also by constituents of the cloudless atmosphere. This consideration had led the author to investigate the long-term variation of the total zenith transmittance of the atmosphere. Ideally, this investigation should aim at establishing the long history of the optical depth
Annual mean total zenith transmittance 0.6 0.7 0.7 0.8 0.8 0.9 0.9 1.0 1.0 1950 1960 1970 1980 1990 2000 2010
Moscow Tartu Tiirikoja Payerne
Mauna Loa Matsumoto Mean of 20 sites in Japan Mean for lower troposphere
Figure 12. Long-term observations of annual mean zenith transmittance of the cloudless atmosphere.
due to aerosol at a number of sites. However, it is at present very difficult to obtain long-term observations with which the aerosol optical depth can be calculated, with the exception of several sites. For Table Mountain, California and Mt Montezuma, Chile, Roosen and Angione (1984) reported the constant nature of the aerosol optical depth for the period of 32 years from 1926 to 1957 for the former, and for the period of 23 years from 1932 to 1954 for the latter. If the presented diagrams are carefully analyzed, however, both sites show a clear trend of increasing optical depth for the period after the mid 1940s. Makhotkina et al. (2005) analyzed pyrheliometric data for the territory of the Russian Federation for the period of 1976 and 2002, and concluded that the aerosol optical depth over the vast region of Russia increased to the mid 1980s followed by a period of decrease.
The total transmittance is a useful substitute for the aerosol optical depth under the present circumstances. Total zenith transmittance for 6 sites with long observa-tion records based on well-calibrated pyrheliometers is presented in Figure 12. All sites are located in the Northern Hemisphere. All but Mauna Loa are low altitude stations showing a decreasing transmittance through the second half of the 1950s to 1980s. The other 5 transmittance-series indicate a clear trend of recovery after the mid 1980s, despite momentary depressions caused by El Chich´on and Mt Pinatubo eruptions. The trend of the total transmittance indicates a parallel change of the aerosol optical depth and global cloud amount. Since this trend is not seen in the Mauna Loa observations, the trend discussed here is a phenomenon in the lower
troposphere. This general trend in the aerosol load in the lower troposphere is the basis to understand the above-discussed course of global dimming to the 1980s and the following brightening tendency observed in 75% of the regions investigated in the present article. These sites are all located in advanced nations who shared the quick industrial recovery during the first twenty years after the end of the world war. Many of these nations also launched a systematic campaign to calve air pol-lution in the 1980s. Global dimming and brightening may be the direct result of these activities. There is however the remaining 25% of the regions with contin-ued dimming. Unfortunately, there are no long-term pyrheliometric observations in these regions, or BSRN stations. The recently increasing economic activities and biomass burning resulting in increased emission of aerosol may be the cause of the continued dimming in these regions. The changes of global radiation and total transmittance discussed above offer important insights into the interaction of aerosols, optical depth, clouds and solar radiation.
Acknowledgements
The present article is a part of the summary of the author’s work on atmospheric radiation that was carried out during the last twenty years. He has been greatly supported by colleagues in his group at ETH, notably Drs. Hans Gilgen, Andreas Roesch, Peter Tschuck and Martin Wild. The present article was written while the author was a visiting scholar at the Scott Polar Research Institute, and Brenda Ry-man Visiting Fellow at Girton College at the University of Cambridge. The author wishes to thank Professor Julian A. Dowdeswell, the director of the Scott Polar Research Institute, and Dr. Roland Randall, a fellow of Girton College. The author was helped by many individuals who organised and supplied valuable radiation data. A special thanks is due to Professor Guangyu Shi of the Chinese Academy of Sciences, Messrs Kohei Honda at Japan Meteorological Agency and Danie Es-terhuyse, South African Weather Service. The author is indebted to Professor Bert Holtslag of Wageningen University for notifying the author of the existence of the world’s second longest observation series at Wageningen and Mr. Bert Heusinkveld of Wageningen University for supplying the entire observation.
References
Budyko, M. I.: 1982, The Earth’s Climate: Past and Future, Intern. Geophys. Ser. 29, Academic Press, N.Y.
Gilgen, H., Wild, M., and Ohmura, A.: 1998, ‘Means and trends of shortwave irradiance at the surface estimated from Global Energy Balance Archive Data’, J. Clim. 11, 2042–2061.
Kessler, A.: 1985, Heat Balance Climatology, World Survey of Climatology, General Climatology, Vol. 1A. Elsevier, Amsterdam.
Liepert, B., Fabian, P., and Grassl, H.: 1994, ‘Solar radiation in Germany – observed trends and an assessment of their causes. Part 1: Regional approach’, Beitr. Phys. Atmosph. 67, 15–29. Makhotkina, E. L., Plakhina, I. N., and Lukin, A. B.: 2005, ‘Some features of atmospheric turbidity
variations in Russian territory during the last quarter of the Twentieth Century (in Russian)’,
Meteorologia i Hydrologia 2005, 28–36.
Ohmura, A. and Lang, H.: 1989, ‘Secular variation of global radiation in Europe’, in: J. Lenoble and J.-F. Geleyn (eds.): IRS’88: Current Problems in Atmospheric Radiation, A. Deepak Publ., Hampton, VA, pp. 298–301.
Ohmura, A., Gilgen, H., and Wild, M.: 1989, Global Energy Balance Archive GEBA, World Climate
Program – Water Project A7, Report 1: Introduction, Verlag der Fachvereine, Zuerich, Zuercher
Geografische Schriften 34, 62 pp.
Ohmura, A. and Gilgen, H.: 1992, ‘Global energy balance archive (GEBA, WCP-Water A7) and new aspects of global radiation distribution on the earth’s surface’, in: S. Keevallik and O. K¨arner (eds.): IRS’92: Current Problems in Atmospheric Radiation. A. Deepak Publ., Hampton, VA, pp. 271–274.
Roosen, R. G. and Angione, R. J.: 1984, ‘Atmospheric transmission and climate: Results from Smith-sonian measurements’, Bull. Am. Met. Soc. 65, 950–957.
Stanhill, G. and Moreshet, S.: 1992, ‘Global radiation climate changes: The world network’, Clim.
Change 21, 57–75.
Stanhill, G. and Kalma, J. D.: 1994, ‘Secular variation of global irradiance in Australia’, Australian
Meteorological Magazine 43, 81–86.
Stanhill, G.: 1995, ‘Global irradiance, air pollution and temperature changes in the Arctic’, Phil.
Trans.: Phys. Sc. Engin. A352, 247–258.
Stanhill, G. and Cohen, S.: 1997, ‘Recent changes in solar irradiance in Antarctica’, J. Clim. 10, 2078–2086.
Stanhill, G. and Ianetz, A.: 1997, ‘Long term trends in, and spatial variation of global irradiance in Israel’, Tellus 49, 112–122.
Stanhill, G.: 2005, ‘Global dimming: A new aspect of climate change’, Weather 60, 11–14. Wild, M., Ohmura, A., and Gilgen, H.: 2004, ‘On the consistency of trends in radiation and
tem-perature records and implications for the global hydrological cycle’, Geophys. Res. Let. 31, 10.1029/2003GL019188.
Zhang, Y. L., Qin, B. Q., and Chen, W. M.: 2004, ‘Analysis of 40 years records of solar radiation data in Shanghai, Nanjing and Hangzhou in eastern China’, Theor. Appl. Climatol. 78, 217–227.