Publisher’s version / Version de l'éditeur:
Vous avez des questions? Nous pouvons vous aider. Pour communiquer directement avec un auteur, consultez la première page de la revue dans laquelle son article a été publié afin de trouver ses coordonnées. Si vous n’arrivez pas à les repérer, communiquez avec nous à PublicationsArchive-ArchivesPublications@nrc-cnrc.gc.ca.
Questions? Contact the NRC Publications Archive team at
PublicationsArchive-ArchivesPublications@nrc-cnrc.gc.ca. If you wish to email the authors directly, please see the first page of the publication for their contact information.
https://publications-cnrc.canada.ca/fra/droits
L’accès à ce site Web et l’utilisation de son contenu sont assujettis aux conditions présentées dans le site LISEZ CES CONDITIONS ATTENTIVEMENT AVANT D’UTILISER CE SITE WEB.
Technical Translation (National Research Council of Canada), 1969
READ THESE TERMS AND CONDITIONS CAREFULLY BEFORE USING THIS WEBSITE.
https://nrc-publications.canada.ca/eng/copyright
NRC Publications Archive Record / Notice des Archives des publications du CNRC :
https://nrc-publications.canada.ca/eng/view/object/?id=266c06ad-b673-4ab5-9365-3d77d63872e5 https://publications-cnrc.canada.ca/fra/voir/objet/?id=266c06ad-b673-4ab5-9365-3d77d63872e5
Archives des publications du CNRC
For the publisher’s version, please access the DOI link below./ Pour consulter la version de l’éditeur, utilisez le lien DOI ci-dessous.
https://doi.org/10.4224/20386673
Access and use of this website and the material on it are subject to the Terms and Conditions set forth at
Permafrost investigations in the field. Part 1. Geocryological surveys;
Part 3. Long-term geocryologic investigations
NRC TT -1358
NRC TT - 1358
NATIONAL RESEARCH COUNCIL OF CANADA
TECHNICAL TRANSLATION 1358
PERMAFROST INVESTIGATIONS IN THE FIELD
PART ONE. GEOCRYOLOGICAL SURVEYSCHAP. II, P. 44· 88
CHAP. IV, P. 136 -170,
189·
201CHAP.
V,
P.211 - 222
PART THREE. LONG - TERM GEOCRYOLOGICAL INVESTIGATIONS, P. 362 - 421
V. A. OBRUCHEV INSTITUTE OF PERMAFROST STUDIES
ACADEMY OF SCIENCES OF THE U. S.
S.
RIZDATEL'STVO AKADEMII NAUK SSSR, MOSCOW 1961
TRANSLATED BY
V.
POPPETHIS IS THE ONE HUNDRED AND SEVENTY·NINTH OF THE SERIES OF TRANSLATIONS PREPARED FOR THE DIVISION OF BUILDING RESEARCH
OTTAWA
ThL, t i of ;2oviet :-1 t t t t Lo
in permafrost イ・セゥッョウ is of particular interest to the Jivislor or
bオゥャ、ゥョセ Research in jts studies of permafrost and b1l i 1 d l n [ problems
:in no r t.her-n Canada. The rオセLZ[ゥゥャョウ have been involved in c onstructi on on pc rrna t'r-o st for many year':1 in Siberia and their e xne r te nc e s a r:e of [\reat Lnt.e rest to エィョLセP who arr, inv()lvn d l n this act.Lvi tv .
'I'his Hu s sta n ma nual Wi-Li not 1,;"un:;1;,tr'd in its entlreVl b e c a u s e of i ts consi d e ra b 1e jenイセ t han d ir ;' ej evan ceof s0me l: apter s t v
Canadian corrd lt Loris . This tr'ansl:,tionlnclucles about two-thirds of the o r-LgtnaI text. Comments upon th co nto nt.a of t.hi a t r-ansLat Lcn
from any who have had experience in pei-ma f'r-ost areas will be weLcorne d by the Division. ;,uch mutual c'xchanp'.E: of informaticn wl 'lI be of
セイ・。エ assistance to the Division in its セセウォ of providing essential information on permafrost in Canada.
The uivision is gr'ateful to I'lr. V. Poppe of the 'I'r-ansl.atLons
Section, National Research Council, for セイ。ョウャ。エェョァ this document
and to Dr. R.J.F:. Brown of t.ni s DivL3ion who cIiec k e d the tr-a nsLa t i on .
Ottawa
May, 1969
n.
F. Legget CirectorNATIONAL RESEARCH COUNCIL OF CANADA Technical Translation 1358
Title: Permafrost investigations in the
cal surveys, Chap. II, p. 44-88;
Chap. V, p. 211-222. Part III.
investigations, P. 362-421
field. Part I.
Geocryologi-Chap. IV, p. 136-170, 189-201; Long-term geocryological
(Polevye geokriologicheskie (merzlotnye) issledovaniya. ChastI
I. Geokriologicheskaya s'emka, Clava II, s. 44-88; Glava IV,
s. 136-170, 189-201; Glava V, s. 211-222. ChastI III.
Stat-sionarnye geokriologicheskie issledovaniya, s. 362-421)
V.A. Obruchev Institute of Permafrost Studies, Academy of
Sciences of the U.S.S.R.
(Akademiya Nauk SSSR, Institut Merzlotovedeniya im. V.A. V A. Obrucheva)
Publisher: Izdatel'stvo Akademii Nauk SSSR, Moscow 1961
PART ONE.
GEOCRYOLOGICAL SURVEYS
Chapter II. The nature of investigations in the
course of geocryological surveys
') The layer of :sea,sonal freezing and tha\';inji of soil (r,x:k)
The p r-oc e s s e s of ce a s ona I f'r-ee z Ln« and t hawi nr; of soil in time, the
エィゥ」セョ・ウウ of the layer of seasonal freezinf and thawing, the regIme of the layer witn annual temperature fluctuations, and the thIckness of this
In t.he
Ir-rlcvclop':lent they 81' infJue nced b, エGZセ 1'1t5 t.u.t ina L ?C'o,,:raphicaJ zonality
a nd the Lo cal a lt It.u.te .
it is essential to dLs tLngui s h bet ween "the Laver- of se a soriaI freezing"
and "the layer of sC"'30nal t haw l ng
!".
'['he ILr-st ェセ[ t!1C upper layer of soilwhich free z e s in the co l c se a s on and is undcr Lai n by ccn stant unfrozen
soil.
w!li(;h エィMャ|Gj」GゥセQ the warm ,;easort セエエIHャ lセ u ridr.r La Ln by pBセᄋイイjZエイイッZIエN
Their s Lmlla r-Lty .1i :; i n thc f'2Ct that .L'; both instances s c a s oriaI
frc-p?lnr", is fo l Lowe d by s e as oriaI thawing. The .il f'fei ence between them is
t.hat the Lay e r- of s o a sona I f'r-eczinrz is developed in t.ne absence of
perma-frost or when the latter is at a considerable dept!l, while the layer of
s e a s ona l tl13Winl!, is present onlv when pe r-maf'r-ost is ncar the surface. The
elder c hnr-acte rLs t.Lc s of the layer of s e a s ona I f'r-eczlnrr are: possitive mean annual temperature of the soil, the fact that freezing takes place
only from above, and エィ。キゥョセ from above and from below.
The layer of seasonal エセ。キゥョセ is characterized by: ョ・セ。エゥカ・ mean
annua l temperature of soil, and the fact that freezing takes place from
above and from below, but thawing only from above. In the permafrost
region, the layer of seasonal freezing is found only on section where permafrost is absent or at a depth exceedinc that of seasonal freezing.
The layer of seasonal freezing reaches its maximum thickness in the
second half of winter (Fig. 2). The layer of seasonal thawing is thickest
in the fall and occasionally at the beginning of winter.
The thickness of layers of seasonal ヲイ・・コゥョセ and thawing may vary
greatly and depends on the combination of conditions determining the
TABLE OF CONTENTS
Part One. Geocryological surveys
Chapter II. The nature of investigations in the course
of geocryological surveys
2. The layer of seasonal freezing and thawing of soil
(rock). T.N. lhesthova, E.G. Katasonova,
A.M. Pchelintscv, L.S. Khomichevskaya .
3.
Composition and cryogenic structure of permafrost,E.PII. yatasonov . . . • . . . .
4
25
Chapter IV. Field investigation methods in geocryological
surveys
72 37
50
I.P. Elmanov, A.V. Maramzin,
Tols tov .
1. Sampling methods.
N.l. MUkhin, A.N.
2. Geopnysical investigations. A.T. Akimov .
'», Investigations of e;roundwater and surface water.
A.I. Efimov .
Chapter V. Geocryo1ogical mapping
2. Standard symbols for geocryological maps, profiles and
cress-sections. S.P. Kachurin... 87
Part Three. Long-term geocryological investigations
Aims end methods of field studies. A.V. Golubev, A.P. Pavlov,
L ..'). Khomicheskaya...
89
Appendix 1. Methods of measuring soil temperature.
A.V. Golubev, ILA. Kos Lo v , P.A. Solov'ev... 113
Appendix 2. Permafrost record (for test pits and
bore-holes) . . . 148
';:' ab 1 e s . . . 15 0 Figures. . . 188
layer of seasonal thawing raise or lower the permafrost table. If the soil temperature in this layer rises for several years, the layer of seasonal
thawing is transformed into the layer of seasonal freezing. The criterion
of stability of the layer of seasonal thawing or freezing is the mean annual temperature of the ground (soil).
During geocryological field studies the following factors must be
investigated on each section: a) composition and cryogenic morphology of
soils in the layers of seasonal freezing and thawing; b) physical and other properties of soils; c) relation between the depth of freezing and thawing
of soils and various physico-geographical conditions (relief forms, surface
exposure, depth of snow, type and properties of vegetation, etc,; d) the depth of seasonal freezing and thawing of ground under prevailing conditions.
l. The study of composition and cryogerlic ュッイーィッャッセカ of soil in the layers
of seasonal freezing and エィ。キゥョセ
On studying the composition and 2ryogenic morphology of soils, it is
essential to know their genesis, i.e. the method and conditions of their
formation. This problem is solved by geomorphological methods. In the
examination of deposits undergoing seasonal freezing, special attention
should be paid to the peculiarities of their cryogenic texture.
The cryogenic structure of layers subject to seasonal freezing is still
not well understood. On comparing available data it becomes obvious that
there are marked differences between the cryogenic structure of soils in
the layers of seasonal freezing and thawing. In the layer of seasonal
freezing, inclusions, layers and small lenses of ice predominate in its
upper part due to unilateral freezing of the soil. In the layer of seasonal
thawing the distribution of ice inclusions is uneven, since freezing takes place here both from above and below.
For example, a relatively fine layered texture of frozen soil is characteristic of the layer of seasonal freezing in Western Siberia, While coarse layered texture is characteristic of permafrost.
The following aspects of cryogenic soil texture are characteristic of many areas in the permafrost region where the layer of seasonal thawing freezes both from above and below:
a) the cryogenic texture is best defined in the lower part of the layer near the contact with permafrost, where apart from thin there are also large ice lenses (flat and horizontal in alluvial and peaty deposits, slightly wavy in talus deposits);
-6-b) small ice inclusions of various shapes (Table I) are characteristic of the upper part of the layer;
c) the middle part of the layer is relatively dry owing to migration of moisture from top to bottom during freezing, and therefore the cryogenic textures here are not well defined.
On sections with a low moisture content (steep slopes, dry terraces above the flood plain, etc.), no large ice inclusions are formed in the
layer of seasonal thawing.
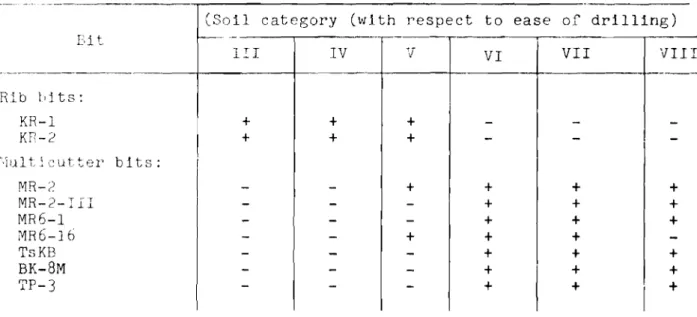
The cryogenic textures shown in Table I are characteristic of soils
undergoing seasonal thawing. In some cases it is relatively simple to
recognize alluvial and talus formations from cryogenic textures and other indicators, and to explain the reasons for the varying ice content of the permafrost.
Seasonal cryogenic te::tures formed in areas of deposition are retained
in contemporaneous permafrost. The study of cryogenic textures of the
layer of seasonal thawing helps to determine the maximum depth of thawing. The composition and cryogenic morphology of deposits undergoing
seasonal freezing are studied by means of drill cores and by examining
the walls of pits and trenches. Of greatest value are pits and trenches
where the distribution and the mode of occurrence of ice inclusions can be
traced over considerable distances. The depth of pits, trenches and
bore-holes must exceed the thickness of the layer of seasonal freezing or
thawing by at least 30 - 50 cm.
The tasks of an investigator studying the composition and cr'yogenic morphology of soil are:
a) to describe the location of the excavation, the elements of relief, the exposure of the section, the degree of swampiness of the surface, the thickness of the moss-lichen cover, etc.;
b) to determine the lithological type of soil (clay loam, sandy loam, sand) and to make a detailed record of the cross-section;
c) to study the primary layering of soil if it is present (type of
layering: horizontal, wavy, lenticular, inclined; thickness and composition
of each layer);
d) to determine the presence of carbonates, iron and humus;
e) to determine the genetic type of soil and the facies to which they belong;
f) to determine the presence of vegetative remains or peat (for example,
the type of peat: allochthonous or authochthonous);
layer, determine the depth and horizons when gleyzation is present, find the causes of gleyzation, and determine the outlines and boundaries of gleyed horizons;
h) to determine the moisture content in the layer of seasonal freezing and thawing (for each layer and the total moisture content)*;
i) to investigate thoroughly the shapes, dimensions and distribution
of ice inclusions (lenses, crusts, pockets); to describe, sketch and
photo-graph cryogenic textures - the systems of ice inclusions in different
genetic horizons; to determine the systems of fractures to which the ice inclusions are related and the processes responsible for the presence of fractures or voids containing icr:.
Each genetic type and variety (facies) of soil is characterized by a definite cryogenic morphology, due to the effect of heterogeneous thermal processes taking place in them, the direction of the heat flux and the rate
of freezing. Therefore the identification of lithological and genetic
types of deposits undergoing seasonal freeZing and their geocryological analysis is one of the main tasks in the study of the layer of seasonal freezing and thawing.
2. Relation of depth of freezing and thawing to the natural environment
The ttlickness of the layers of seasonal freezing and thaWing depends on
the natural ・ョカゥイッョュ・ョセ of a given region or section. Therefore it is
essential to study the physico-geographical and geological characteristics of a given territory.
1. Soil composition. Soil composition affects the depth of freezing
and thawing, because different :ithological types of deposits differ in
their physical and thermophysical properties. Of great importance here is
the ice (moisture) content, which determines the main consumption of heat on freezing and thawing and has a considerable bearing on the thermophysical
properties of soil. The permeability of thawing and unfrozen soil is of
equal importance. The seepage of atmospheric precipitation contributes a
great deal of heat to the thawing process.
The depth of seasonal freezing and thawing is greatly affected also
by the density, structure and mode of occurrence of the soil or rock. An
increase in density raises the coefficient of heat conductivity, which in
*
It is important to find the moisture content of soil both in summer and-8-turn increases エィセ depth of seasonal thawing (freezing).
2. The relief affects the depth of seasonal freezing and thawing because of uneven distribution of snow, different amounts of moisture and peat on the surface, different moisture (ice) contents of surface deposits, etc.
In the permafrost region, the thickness of the layer of seasonal thawing
on better drained and better heated elevated sections i3 greater than in depres3ions.
Outside the permafrost region, the depth of seasonal freezing is
zr-eate r oセi windswept eLe vat ed sections.
3.
Exposure and steepness of slopes. The depth of seasonal thawingon slopes facing s uth 1s on the average
50 - 60%
greater than on slopesof northern exposure. This difference often exceeds 100% in ttle southern
parts of the pe r-maI'r-ost rC; r';i 0 n and steadily dlminLs he s from south to north.
The effect of insolation on southern slopes becomes more pronounced
as they becorrlC セエ・・ー・イN
d1ffcrenc in the rlepth
lipping Cit Cin'·;les of lip
With all other condlt1nns remaining the same, the
of' se a aoria I tha:...}rlf': mav re ac h one metre on slopes o
to 30 .
lj. Zセイエow c o ve r , its depth, density, r!,l'G\-nh and dynamic p r-op er-tLe s play
an important role in thp f'r-ee zi ng and thawing of unconsolidated deposits.
When the snow cover Is thin (2 - 10 em), the イ・イャ・」エゥョセ properties of
sn8W are relatively セイ・。エ・イ than its insulating characteristics, With
increase irl the depth uf snow, its insulating properties become more
pronounced. On ウー」エゥッョセ free of snow, the depth of seasonal ヲセ・・コゥョァ is
at times セo -
60
セイ・Zゥエ・イ than OG sections with an undisturbed snow cover.In certain continental areas, the effect of snow is relatively
uni-form. The depth of thawing of soil is little affected by snow, since it
often disappears prior to the onset of war-m weather.
5.
VCBetation (living and dead) has a diverse effect on freezing andエィ。キゥョセ of soil. Vegetation and organic remains in and on the soil (matting,
moss cover, peat) favour an increase in the moisture (ice) content in its
upper horizons, :ower the temperature and reduce its amplitude, and reduce
the depth of freezing and thawing;. The intensity of solar radiation is
reduced (as nluch as
50
times and more) under a forest cover and this limitsthe extent of soil heating. By lowering the force of the wind, forest
vegetation favours a uniform deposition of snow and its retention in a
loose state, which reduces the amount of heat emitted by the soil.
There-fore, tho depth of thaw beneath a forest cover is two or three times less
thall on sections devoid of trees. The greater the density, height and
remains in the soil and on its surface, the greater its effect on the freezing and thawing of soil.
Determination of relationships between the depth of seasonal freezing or thawing and the lithological composition, relief, snow, vegetation, etc.,
is one of the tasks of field investigations. Quantitative relationships
can be determined only by special observations at field stations.
The depth of thawing and freezing must be investigated separately for each type of terrain.
The following factors must be investigated in the field:
a) the thickness of the layer of seasonal freezing and thawing in unconsolidated deposits of different lithological types and under uniform or complex environmental conditions;
b) the effect of different forms of relief on freezing and thawing under uniform and complex environmental conditions;
c) the thawjng of soils on slopes of different exposure with similar and different ungles of dip, similar lithological types of deposits, similar vegetation, etc.;
d) the relation between the depth of soil freezing and the depth and the density of the snow cover;
e) the effect of different types of vegetation on seasonal freezing and thawing of unconsolidated deposits in different types of terrain.
The observations are recorded as described below (see appendix to this
セ・」エゥッョIN
3.
Determination of the depth of seasonal freezing or thawing of soilThe following methods are used in the field to determine the depth of
freezing or thawing of soil: a) direct measurement, b) temperature
measure-ment, c) extrapolation, d) textural method, and e) calculations.
a) Direct measurement of the depth of seasonal freezing is based on the determination of the depth of freezing and thawing with the help of
exca-vations and boreholes. The layer of seasonal freezing is studied on a
cleaned wall of a testpit or in the core from a borehole. The depth of
freezing is determined from crystals and layers of ice seen with the naked
eye, from changes in the ウエイ・ョァセィ of soil and its colour (frozen soil is
usually somewhat lighter in colour than unfrozen soil), and by observing the thawing of a sample.
The pits are excavated in dense soil, while boreholes are usually
drilled in sandy soil and clay loam. A probe (a pointed steel rod
5 - 6
mm
-10-used when measuring small depths of seasonal thawing (1 - 1.20 m).
How-ever, this method is not always reliable.
The measurements are repreated two or three times at each given point
and reliable results are recorded in a log-book. The depth of thawing
determined at the end of autumn is the maximum depth for a given year and a
given section. The depth of seasonal freezing is determined in the second
half of winter or early spring. The measured thickness of this layer
indicates the conditions of freezing in a given year and a given section. b) The temperature method is used when processing the temperature
measurements obtained in the field and at research stations. A temperature
curve is plotted, and the depth at which the curve crosses the zero ordinate
will correspond to the depth of thawing or freezing. This method is less
accurate than direct determinations. It should be remembered that the
セッッャゥョァ of certain soils to OoC may not always coincide with the depth of
actual freezing of soil. Such a discrepancy is observed in fine-grained
soils in which water crystallizes at temperatures below zero. If the
mineral content of water is high, the crystallization sets in at a still lower temperature.
A zero soil temperature is often observed over a relatively large interval of depth, which points to the inadequacy of thIs method.
c) The method of extrapolation is based on observations of tIle rate ano depth of thawing of soil carried out at the nearest meteorological
station. It is known that seasonal thaWing of soil is a function of time.
Therefore for any period of time, thawing may be expressed as a percentage
of the maximum thawing in the course of a season. Such data for each time
interval serve as a standard in the calculation of maximum thawing based
on observations obtained earlier. This method can be used in the case of
uniform environmental conditions.
Table II contains the data on the rate of seasonal thawing near Igarka (Tumel, 1941) and near Yakutsk (Mel'nikov, 1952) expressed as a percentage of the maximum depth of seasonal thawing.
In both localities the rate of thaWing has been determined over a period of many years at grass-covered sites with water content of soils
not exceeding saturation of the latter. The rate of thawing is shown
gra-phically on Figure
3.
The calculation of the depth of thaw based on thedata in Table II can be done by means of the follOWing formula:
H
=
h--lQO,
n
h - depth of thaw at the time of the investigation, in cm or m; n - coefficient of thawing at the time of the investigation, in %.
Example. At the end of August, the silty clay loam near Igarka
thawed to a depth of 1.20 m (h). From Table II we find that for this
region the depth of thaw in August (the coefficient of thawing n) is 60 or 80% of the maximum depth, depending on the weather, lithological
compo-sition of soil, and other factors. Let us assume that the summer was
relatively dry. Hence the maximum depth of thaw in October (H) will be
1.50 m:
H h . 100 = 1. 20· 100
n 80 1.5 [m]
a)
Below we give the intensity of seasonal thawing of unconsolidated deposits near Noril'sk (in % of maximum depth of seasonal thawing)
calcu-lated by A.V. Leont'ev, and the possible error in the determination of the depth of thaw at different times of the year:
Depth of thaw, % Possible error, %
セ セ 1.VII IS.VII 1.VIII 15.YIII セ
5 25 45 65 75 90 95
±50 ±25 ±20 ±15 ±10 ±5 ±3
15.IX 100
a
d) The method of determining the long-term maximum depth of seasonal thawing of soil from its cryogenic texture is as follows.
The changes in ice content with depth are observed at a chosen site
in a testpit or borehole. Where the ice content gradually diminishes with
depth, reaches a minimum value (ice ceases to be noticeable) and then in-creases sharply, the boundary of this transition often indicates the depth
of maximum thaw. To ascertain that this is the maximum depth, it is
essential to deepen the pit or the borehole by at least one metre. If the
thickness of ice layers increases or the soil is more or less uniformly saturated with ice, then the aforementioned boundary does coincide with the
maximum depth of thaw. In the presence of alternating massive and layered
textures, the maximum depth of thaw will be indicated by the lowest
boundary of the transition from massive to layered texture. The uppermost
boundary of this transition corresponds to the depth of seasonal thawing in one of the years following the maximum thawing.
In such determinations it is recommended to use the core lifter
designed by A.M. Pchelintsev (1951) et al. The extracted cores are sawn
along the axis, cleaned with a knife, and photographed (or carefully
sketched and described). The core photographs are glued together to form
texture of a given soil.
The advantage of testpits over boreholes セゥ・ウ in tte fact that in a
pit it is possible to trace the boundary of thawing fer a considerable
distance. However, the excavation of pits requires more labour and is made
difficult in the summer by caving and flooding. Therfore it is not always
possible to excavate a pit.
Let us examine some examples of the cryogenic texture of some typical cross-sections of frozen soil.
Table III contains the characteristics and sketched examples of
various cryogenic textures. Tables IV to IX contain typical cross-sections
of frozen soil and determinations of the depth of seasonal thawing from cryogenic textures.
A section of epigenetic frozen soil typical of Western Siberia is
shown in Table IV (section I), where the lower boundaries of contemporaneous
and maximum seasonal thawing coincide and lie between layers
5
and6,
characterized by medium- and coarse-layered cryogenic textures. Permafrost
occurs above the upper boundary of the layer with a coarse-layered texture.
The medium-layered texture of layer
5
was formed as a result of freeZingof the thawed layer from below. The fine-layered texture in layer 1 is due
to rapid freezing of the soil, which eliminated the possibility of formation
of large ice lenses. The textures of layers 3 and 4 are due to a low
moisture content of freezing soil. Layer 2 contained a considerable
amount of moisture but it froze slowly.
Section II (Table V) differs from Section I by the fact that the bound-ary of the layer of contemporaneous seasonal thawing in it is above the
boundary of maximum thawing (which is between layers
7
and8)
and lies atthe base of layer
5
formed as a result of freezing from below. This isindicated by the セゥコ・ and distribution of ice lenses. The considerable
thickness of ice lenses points to a high water content of the soil.
In section III (Table VI) the lower boundaries of contemporaneous and
maximum seasonal thawing coincide and lie at the base of layer
8.
Thetexture of layer
6
resembles that of layer5
in section II, although theywere formed in a different way. Layer
6
in section III froze from above,while layer 5 in section II from below.
In section IV (Table VII) the lower boundary of the layer of maximum
seasonal thawing lies at the base of layer 13. The lower boundary of the
layer of contemporaneous thawing is not well defined.
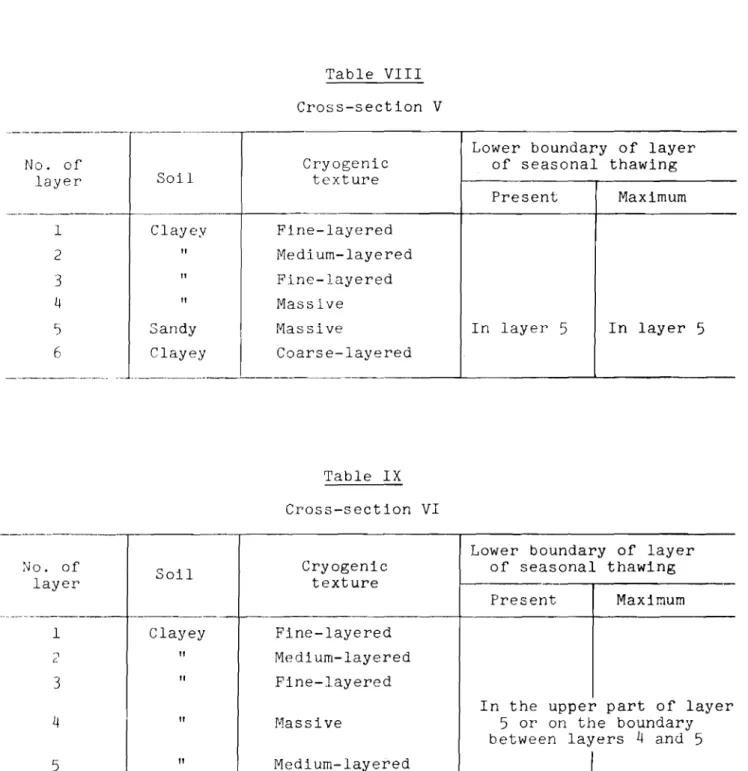
In section V (Table VIII) it is impossible to pinpoint the lower
they lie in the sandy layer 5.
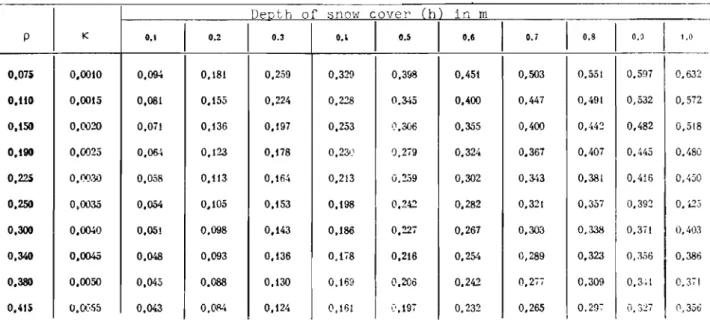
The permafrost layer (5) in section VI (Table IX) is characterized by
an even distribution of ice layers. Therefore it is impossible to pinpoint
the lower boundary of maximum thawing.
The textural method of determining the maximum depth of thaw may be
used under following conditions: 1) when the layer of seasonal freezing
is consistently merging with permafrost; 2) then the lower boundary of the layer of seasonal thawing lies in clayey soil (clay, clay loam and sandy
Joam) .
Let us examine two examples pertaining to the first condition.
Example 1. The layer of seasonal freezing has merged with permafrost.
It is required to find the boundary between them. According to all that
was said above, this boundary corresponds to the depth at which soil with
massive or medium-layered cryof,enic エ・クエオイセ assumes a coarse-layered texture
characteristic of permafrost.
Example 2. The layer of seasonal freezing does not merge with
perma-frost. The depth of seasonal thawing cannot be determined, since the depth
of seasonal freezing is less than the possible depth of seasonal thawing. We can speak only of the maximum depth of seasonal freezing as indicated by the pereletoks.
As far as the second cOlldition is concerned, the textural method can be used only in the case of clay soils in which lenticular ice inclusions
can be formed. Ice lenses are not formed in sandy and coarse soils,
irrespective of their moisture content*.
e) Determination of the depths of seasonal freezin5 and thawing by the thawing by the method developed by V.A. Kudryavtsev is based on the
exami-nation of the effect of a combiexami-nation
ot
factors determining the seasonalfreezing of soils, and on the study of heat exchange. The heat exchange
in the soil can be determined by way of the temperature regime at the
sur-face; attention should be paid to soil composition, lithology, texture,
moisture content, ice content, and thermophysical properties. V.A.
Kudrya-vtsev (1959a) distinguishes four main indicators, which characterize the
processes of seasonal freezing and thawing of soil: a) lithological
compo-sition, soil structure, b) moisture and ice contents; c) mean annual
tempera-ture and d) temperatempera-ture amplitude on the surface. The combination of these
factors determines the type and depth of seasonal freezing and thawing of soil.
*
When investigating the layer of seasonal freezing and thawing, andparti-cularly when determining the depth of seasonal thawing, it is essential
to note the colour of soil. The layer of seasonal thawing is
character-ized by a rusty-brown colour resulting from the presence of ferric oxides. Permafrost is characterized by a greyish-green, dirty light blue, or
-14-In contrast to the usual method of determining the depths of seasonal freezing and thawing at the time of the investigation, the above procedure makes it possible to establish the patterns of formation of the layer of seasonal freezing and thawing.
The mean annual temperature and the annual temperature amplitude at the ground surface reflect the complex heat exchange process in the surface
layer of the lithosphere. The lithological composition of soils, their
structure, moisture content, and ice content characterize the conditions
under which the soils freeze and thaw. It is a relatively simple matter to
determine each one of these conditions in the field.
The aforementioned characterisitcs form the basis of the determination of the depths of seasonal freezing and thawing by means of formulae given
below. The data obtained by these equations may be used to predict changes
in the depth of seasonal freezing and thawing witl1 disturbance of the natural conditions during development of the territory.
Let us examine the sequence of determining the types of seasonal
freezing and thawing of soils, using the four indicators mentioned earlier. a) The lithological composition and structure of soils are determined
by means of boreholes and testpits, by examining outcrops, etc. Samples
for laboratory tests are taken from typical layers. Tile distrlbution of
different lithological soil types is traced on a field map.
b) The moisture content is determined in pits and trenches. Frozen
soil is obtained by means of trench sampling, while unfrozen samples are
taken from every lithological soil type and at least every 50 em. The data
is traced on a field map which is then divideJ into sections showing
different average moisture contents of soils. In each section the
differ-ences in the moisture content must n0t exceed 5 - 10%, but larger differences
are possible on small scale maps.
The maps showing the types and moisture contents of soils are compiled by cnnventional methods used in engineering geology.
The compositions of typical lithological soil types are determined in
the laboratory. The number of analyses depends on the scale of the survey
and the complexity of soil composition and structure. The unit weight
(y),
the relative ice content (i), the specific heat
(e),
and the coefficientof heat conductivity (A) of typical lithological soil types are also
deter-mined. These properties are determined in both disturbed and undisturbed
samples.
c) The mean annual soil temperature (t ) at the base of the layer
av
a series of observations and by individual measurements at different depths
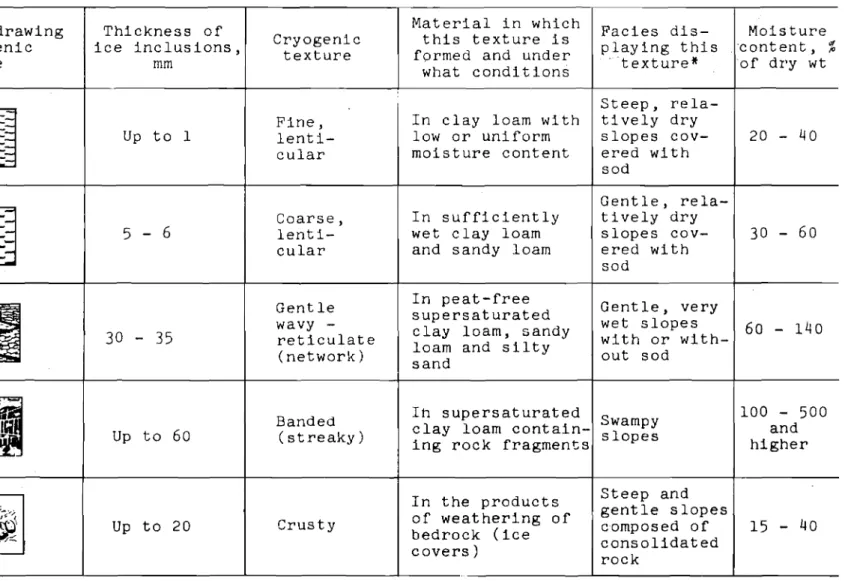
(Kudryavtsev, 1959c). In the latter case, use may be made of a table
showing the relation between the depth of the layer with annual temperature
fluctuations (z), the mean annual soil temperature (tav), and the coefficient
of heat conductivity (K) (Table
X).
If the value of K is known, it ispossible to find on the curve illustrating the changes in temperature with
depth, a point Where the values of z and ta v coincide with those in the
table. These are the required values of
z
and tav If K is unknown, thenthere is only one point on the curve which coincides with the values of
z,
K and ta v in the table. If there are several points, the most likely value
of K is chosen. It should be noted that the error in the determination of
the depth of the layer of seasonal freezing or thawing does not normally
exceed a few centimetres and may be ignored in the determination of
z
andt
a v
By using such individual temperature measurement in stabilized bore-holes, it is possible to determine the mean annual temperature of the soil. These data are also traced on a field map and contours are drawn through
sections with similar temperatures. Within these sections, the range of
temperature fluctuations on large- and medium-scale maps must not exceed
a
0.5 - 1.0 C.
d) The annual temperature amplitude at the ground surface is determined from the amplitude of mean monthly air temperatures by subtracting the
difference which arises owing to the effect of snow and vegetation. Let
us examine the method of determining the effect of snow and vegetation on
the amplitude of temperature fluctuations (Kudryavtsev, 1954).
The decrease in the temperature amplitude oWing to the effect of snow is equal to:
Sz Aa - Av
(1)
( 2 ) A
v
physical air temperature amplitude*
- physical temperature amplitude beneath the snow (at the surface of the vegetation cover).
From the equation of harmonic fluctuations we obtain:
A e- z
1/
iT
awhere A
a
Av
Where z - depth of snow in m;
T - period of fluctuations in hours;
K coefficient of diffusivity of snow in m2 / h r .
-16-maximum depth of snow with a known given below:
On substituting the expression for A into equation (1) and on
v
denoting
・zvセ「ケ
f, we obtain Sz=
Aa (1 -l).
When determining the value of
(1 -
セ
Jゥセ
is essential to take thecoefficient
K.
The values ofK
are0.7-1.0 0.7
0-0.2 0.3-0.4 0.5-0.6
1.0 0.9 0.8
determined from Table
XI.
Depth of snow, m
K
The value of
{l -
セ
)
isIf the depth and density of snow are known and having determined
Sz'
it is possible to calculate the annual temperature amplitude beneath the
snow, i.e. at the surface of the カ・セ・エ。セゥッョ cover.
The decrease in the エ・ュー・セ。エオイ・ amplitude beneath the vegetation cover,
including the moss, the grass and the forest litter, is determined from observations at sites prepared in characteristic sections with different
types of vegetation. m・。ウオイ・セ・ョエウ are made of the daily temperature
amplitude at the surface of the vegetation cover (A ) and in the solI
v
beneath it (As)' This is done by placing the maximum and the minimum
thermometers on the surface of the plant cover and in the soil and keeping
them there for 2h hours. The reinimu:n thermometers are heated, while the
maximum thermometers are cooled prior to insertion. Such measurements are
repeated at least three times on the same site. This gives the vaJues 0f
A
v day andA
s uayセ,
which makes it possible to calculate K of the vegetationcover:
A
=
A ーMzャセS day v day - Y KT ,
where z is the thickness of the vegetation cover in m; T is the time in hours (per day).
On establishing the same relationship for the yearly cycle: ( 4 )
it is possible to determine A , since As v year is known (see the
aforemen-tioned method of determining the effect of snow): A is the temperature
v
amplitude beneath the snow; K has been determined on the site.
There is a better way to relate the decrease in daily temperature
fluctuations to the decrease in annual fluctuations. This is done as
follows.
1n Av year _A - z \
V
I
KT365'7T s yearwhere T is the time in hours per day;
A
1n Av day = セ KT7T.
s day
It follows from equations
(5)
and(6)
thatA
A
InA
v year InA
v da y/19 s year s day ,(5)
(6 ) where 19 =V365.
Hence it is possible to omit the determination of K and to proceed
directly to the determination of As ( i . e . the annual temperature amplitude
on the ground surface) from Av day and As day' The quotient Av day: As day
is determined in the field. The difference between repeated determinations
must not exceed 0.05.
The annual amplitudes of temperature fluctuations on the ground surface are also traced on a field map.
A final map showing the types of seasonal freezing and thawing of soils in a given region (Fig. 4) is then compiled on the basis of all data
obtained. The recorded soil types, within which each of the given factors
varies in area within limits imposed by the scale of the survey, are
characterized by definite depths of seasonal freezing and thawing. The
nomograms in Figures 5 and 6 show the functional relationship between
each of these factors and the depth of seasonal freezing or thawing. The
nomograms are based on the determinations of freezing and thawing of soils
by means of the V.S. Luk'yanov's formula (1957). By using the nomograms
it is possible to calculate the effect of each of the mentioned factors and conditions on the process of seasonal freezing or thawing, and consequently to forecast the changes in the depths of seasonal freezing or thawing on disturbing the natural conditions, for example, on changing the moisture content of the soil, removing or creating artificial covers, etc.
The Luk'yanov formula is as follows:
't'=
(Q
+
C,Q)
(AO
In⦅セNセ⦅]Sセ⦅;- .__
セャ⦅Iᄋ (8 )
, 2 q2 A6 - q(It+
S) q 'where T - the duration of the winter or summer season, hours;
e -
mean air temperature in the winter or summer season;q - average heat flux to the freezing plane from the underlying soil
-18-S - thickness of the soil layer equivalent to the average thermal resistance of insulation on the ground surface in winter, m;
C - unit specific heat of frozen soil, kcal!m3!deg;
A -
coefficient of heat conductivity of frozen soil, kcal!m/deg!hr;Q - latent heat of melting of ice in a unit volume of solI, kcal!m3
;
h - depth of seasonal freezing (thawing), m.
If we determine the effect of snow and vegetation by means of
V.A.
KUdryavtsev's formulae and consider the conditions prevailing on thesurface of the ground, then S will become equa] to zero.
The factors T and
e
are determined fromA
and T recorded on thes av
field map by assuming that the change in the temperature at the ground
surface follows a sinusoidal curve. Then T = tセ - 11, where 1) is the time
which has elapsed since the onset of freezing in hours; 12 is the time up to the end of freezing in hours.
T
T1 = 2n arc sin t- - ,av
A
The values of T and 8 may be found by plotting.
The heat flux q from the underlying unfrozen (or frozen) soil is
determined by the method suggested by V.S. Luk'yanov and M.D. GolovKo
(1957).
After certain modifications, Luk'yanov's formula assumes the following form:
セ⦅R _
+
1= In_.J...Q_
+
!:!l..=9!!
(Q+T )..0CO) AD-qll ;'0
By substituting v for Tq2 セi and u for II )..0 we obtain; v - In u
+
(Q+CO)2" )..0 1·0 - qlt
Given the values of u, we can draw the curve v
=
feu). Having solvedthe left half of the equation and having determined the values of u from the curve, we find the depth of seasonal freezing (thawing) of soil:
1:..
u
11= i.O(1I-..!2
/lq
The nomograms for the maps of seasonal freezing and thawing of clay
loams and sandy soils are constructed separately. A nomogram for any
litho-logical type of soil may be constructed if necessary. The initial data for
the nomograms (Figures
5
and6)
are as follows:1. The mean annual temperatures of soil at the base of the layer of
annual fluctuations (t1) are equal to: ±O.l, ±l, ±2, ±3, ±4, ±50C.
are 11, 17 and 24°.
3.
The moisture contents of soils in the layer of seasonal freezing(thawing) W in
%
of dry weight are: for sand - 5, 10, 20, 30, 40; for claylohm - 15, 20, 30, 40, 50.
4.
The heat conductivity of soils (kcal/m/deg/hr): for sand Aunfrozen=
1.26; Afrozen=
1.64; for clay loam Aunfrozen=
0.92, Afrozen=
1.2.5.
The unit weight of the soil skeleton (mineral soil) (kg/m3) : forsand y = 1600; for clay loam y = 1700.
6.
The relative ice content: for sand i = 1.0; for clay loam 1 = 0.8.7.
The unit specific heat of soil (C) is determined using the followingformula:
where y - unit weight of the soil skeleton (kg/m3) ;
C
s k - specific heat of the soil skeleton (0.2) in kcal/m
3 / d e g . ;
C
w - specific heat of water (1) in kcal/m
3 / d e g . ;
i-relative ice content; C
i c e - specific heat of ice (0.5).
The amount of heat Q required for phase transformation is determined as follows:
r 100
W
i 80,where 80 is the amount of heat in calories required to transform one gram of ice into water.
Let us give an example of how to use the nomograms.
Let us assume that it is required to determine the depth of seasonal freezing of clay loam when its moisture content is 20%, the temperature
°
amplitude on the ground surface is 17 C, and the mean annual temperature of the soil is 1°C.
In this case we make use of the nomogram for clay loam (see Fig.
5).
The curve corresponding to the moisture content of 20% is selected from the family of curves denoting the physical temperature amplitude of 17°C. A line is drawn from a point on the abscissa corresponding to the mean
°
annual soil temperature of 1 C. The ordinate of the point of intersection
of this line with the amplitude curve corresponds to the depth of seasonal
freezing. In the given case it is 2.4 m.
A nomogram may be constructed using any formula. "The sole requirement
in this case is that the depth of seasonal freezing and thawing of soil must be expressed through the mean annual temperature of the latter and the
-20-terr-perature amplitude at the surface" (Kudryavtsev, 1959).
The use of the aforementioned parameters in calculations eliminates
the possibility of human error. The calculated values may be checked by
comparing them with actual depths of' seasonal freezing and thawing on the site.
A map of seasonal freezing and thawing of soils compiled by this method is in good agreement with general geocryological conditions in a given region and renders it possible to determine the characteristics of this region.
4. Mapping of the layer subject to seasonal freezing and thawing using the landscape method
A map showing the following data on the layer subject to seasonal freezinG and thawing is compiled in the course of the geocryologicRl survey:
a) the lithological composition of soils and their structure; the
presence of peat, humus and gleyzation; the facies to which the soils belong; b) the characteristics of the cryogenic morphology of soils, i.e. the cryogenic textures of soils from different facies;
c) the ice content of soils (in winter);
d) the depth of seasonal thawing (freezing) within each element of mesorelief and corresponding soil facies;
e) the moisture content of unfrozen soils (in summer).
This information is mapped by the landscape method with emphasis on
エィセ identification of cryolithological soil types comprising the layer
subject to seasonal freezing and thawing. The landscape method of mapping
this layer is based on the identification of landscapes, i.e. the types of terrain characterized by different physico-geographical and geological conditions, and consequently by different regimes of seasonal freezing and thawing corresponding to these conditions.
The mapping by this method is done as follows.
a) The most typical types of terrain are singled out during field work and their boundaries are traced on a map.
b) the depth of thaw (freezing) is determined several times in each type of terrain during maximum seasonal thaWing (or during maximum seasonal
freezing in the spring). The average depth and the most typical depth of
thaw (freezing) are traced on the map or mentioned in the footnotes.
The schematic map compiled by E.G. Katasonova for a section of a
morphological map since it does not reflect the main soil characteristics
in the layer subject to seasonal freezing (thawing). It can be improved
considerably by including the data on the cryolithological soil types in
this laypr. The study of cryolithological soil varieties is based on the
identification of their genetic types.
The compilation of such a map or a section of a more complex map* is done as follows.
a) In the warm season, work is done on the study of the soil composi-tion within various elements of the mesorelief, the identificacomposi-tion of the most characteristic lithological soil types in the layer undergoing seasonal thawing, and the determination of their moisture content.
b) In winter and spring (and in the North even during the first half of summer), investigations are carried out on the cryogenic morphology of soils, i.e. the cryogenic texture (distribution, shape and thickness of ice inclusions) and on the identification of cryolithological types of deposits
undergoing seasonal freezing. Their boundaries are traced on the map. In
the majority of cases they coincide with the boundaries of the elements of mesorelief.
c) The average depth of thaw (or freezing) for each cryolithological type of deposits undergoing seasonal freezing or thawing is determined in
the period of maximum tha11ing or freezing. The depth of thaw or freezing
is measured by drilling, excavating or testing with a metal probe. The main taxonomical factors identified in the field and traced on the map are the cryolithological soil types (shown by different colours or
different types of shading). The data on the map are supplemented by
in-formation concerning the composition (shown by symbols), the moisture content and the ice content of soils, as well as the depth of seasonal thawing or freezing (in numbers for each soil type).
Figure 8 shows an example of such a map (compiled by E.G. Katasonova).
It is expedient to supplement the map showing the cryolithological soil types in the layer undergoing seasonal freezing with nomograms illus-trating the relationship between the extent of thawing (freezing) and the
changes in environmental conditions. The nomograms are constructed according
to instructions given in the preceding section.
*
Combination maps showing the types of terrain and the cryolithologicalMRRセ
Appendix 1 Recording of data on seasonal freezing and thawing of soils
Depth of Element of relief Element of
meso-freezing Date, (water divide, or microrelief
and thawing, year terrace, flood- (levee, swampy
m plain, etc. ) dep.ces. channel of
an intermitten stream, etc. )
1 2
3
4..
Compo of deposits
and their moist. Degree of Depth of
cont. (in % of dry swampiness snow cover,
or wet wt. ) of section ern
Depth, Moist
m Compo cont.
%
5
6
7
89
Exposure and Type of Compo and Compo and
steepness of vegetation depth of depth of
slope (forest, top soil, ern subsoil and
meadow, peaty horizon
etc.)
10 11 12 13
Literature
Baranov, I.Ya. 0 metodike sostavleniya merzlotnykh kart (primenitel'no k
Zabaikal'yu) (Compilation of geocryological maps (as applied to
Zabaikal'e». Trudy Komiteta po vechnoi merzlote Akad. Nauk SSSR,
V.
6,
1938.Baranov, I.Ya. Geokriologicheskaya (merzlotnaya) karta SSSR masshtaba
1 : 10,000,000 (Geocryological (permafrost) map of the U.S.S.R. at the
scale 1 : 10,000,000). Fondy In-ta merzlotovedeniya Akad. Nauk SSSR,
Moscow, 1957.
Katasonov, E.M. Litologiya merzlykh chetvertichnykh otlozhenii
(kriolitolo-giya) Yanskoi primorskoi nizmennosti (Lithology of frozen Quaternary
deposits (cryolithology) in the Yana coastal lowland). Manuscript.
Fondy In-ta merzlotovedeniya Akad. Nauk SSSR, 1954.
Koloskov,
p.r.
Sezonnaya merzlota pochvy kak odin iz ob'ektov kriosfery(Salls subject to seasonal ヲイ・・コャョセ as a part of the cryosphere).
Koloskov, P.I. 3lizhaishie zadachi i metody izucheniya sezonnoi merzloty pochvy (Immediate tasks and methods of studying the seasonal freezing
of soils). Merzlotovedenie, 1 (2), 1946.
Koloskov, P.I. Sezonnaya merzlota pochvy (Seasonal freezing of soil). Tr.
Vsesoyuznogo geograficheskogo s'ezda, v. 2, 1948.
Kudryavtsev, V.A. TemDeratura verkhnikh gorizontov vechnomerzloi tolshchi v
predelakh SSSR (The temperature of the upper permafrost horizons in
the U.S.S.R.). Izd-vo Akad. Nauk SSSR, 1954.
Kudryavtsev, V.A. Vliyanie litologicheskogo sostava i vlazhnosti gruntov na
ikh temperaturnyi rezhim (The effect of lithological composition and
moisture content of soils on their temperature regime). Vestnik Mosk.
Gos. un-ta, seriya bioI. pochv. geol. i geogr. (4), 1958.
Kudryavtsev, V.A. Vliyanie ekspozitsii i krutizny sklonov mestnosti na
glu-binu sezonnogo promerzaniya i ottaivaniya pochvy (Effect of exposure
and steepness of terrain on the depth of seasonal freezing and thawing
of soils). Nauchnye doklady vysshei shkoly, (2), 1959a.
KUdryavtsev, V.A. セセ・エッ、 priblizhennogo opredeleniya srednikh godovykh
temperatur gruntov pri merzlotnoi s'emke po edinovremennym izmereniyam temperatur gruntov v skvazhine (Approximate determination of mean annual soil temperatures during permafrost survey based on simultaneous
measure-ments of soil temperatures in boreholes). Nauchnye doklady vysshei
shkoly, geologo-geogr. nauki, (1), 1959b.
Kudryavtsev, V.A. 0 sezonnom promerzanii i protaivanii pochv (Seasonal
freezing and thawing of soils). "Materialy VII mezhduved. soveshchaniya
po merzlotovedeniyu", No.2. Izd-vo Akad. Nauk SSSR, 1959c.
Kudryavtsev, V.A. Temperatura, moshchnost i preryvistost tolshch merzlykh
porod (Temperature, thickness and discontinuity of permafrost).
Prin-ciples of Geocryology, v. 1, Izd-vo Akad. Nauk SSSR, 1959.
Luk'yanov, V.S. and Golovko, M.D. Raschet glubiny promerzaniya gruntov
(Cal-culation of- depth of soil freezing). Transzheldorizdat, 1957.
Mel'nikov, P.I. Dinamika merzloty pod zdaniyami i raschet fundamentov dlya
uslovii nizkotemperaturnoi vechnoi merzloty goroda Yakutska (Permafrost
dynamics beneath buildings and design of foundations for use in low
temperature permafrost in Yakutsk). "Issledovaniya vechnoi merzloty v
Yakutskoi respublike", (3), 1952.
Pchelintsev, A.M. Novui bur dlya vzyatiya obraztov merzlykh pochv i gruntov
s nenaruchennoi strukturoi (New drill for undisturbed samples of frozen
soil). Pochvovedenie, (1), 1951.
Pchlelintsev, A.M. Instruktivnye ukazaniya po opredeleniyu ob'emnogo vesa,
vlazhnosti i ob'emnoi l'distosti merzlykh gruntov v polevykh
laborato-riyakh (Instructions for the determination of unit weight, moisture
content and unit ice content of soils in field laboratories). Materialy
po Laboratornym issledovaniyam merzlykh gruntov, (2), 1954.
Nastavlenie gidrometeorologicheskim stantsiyam i postam (Instructions for hydrometeorological stations), No.3, Gidrometeoizdat, Moscow, 1958.
Osnovy geokriologii (merzlotovedeniya) (Principles of geocryology
-24-Rikhter, G.D. Snezhnvi pokrov, ego formirovanie i svoistva (Snow cover,
its formation and properties). Izd-vo Akad. Nauk SSSR, 1945.
Stotsenko, A.V. Sezonnoe promerzanie gruntov Dal'nego Vostoka vne oblasti
vechnoi merzloty (Seasonal freezing of soils in the Soviet Far East
outside the permafrost region). Izd-vo Akad. Nauk SSSR, 1952.
Sumgin, M.I. Vechnaya merzlota pochvy v predelakh SSSR (Permafrost in the
U.S.S.R.). Izd-vo Akad. Nauk SSSB, 1937.
Tumel, V.F. Otchet 0 rabote po melkomasshtabnoi merzlotnoi s'emke v raione
g. Igarki (Report on a small-scale permafrost survey in the Igarka
area). Manuscript. Fondy Instituta merzlotovedeniya Akad. Nauk SSSR,
1941.
Tumel, V.F. Karta rasprostraneniya vechnoi merzloty v SSSR (Permafrost map
of the U.S.S.R.). Merzlotovedenie, 1 (1), 1946.·
Tyrtikov, A.P. Protaivanie pochvy v raione g. Igarki (Soil thawing in the
Igarka area). Tr. In-ta merzlotovedeniya Akad. Nauk SSSR, v. 12, 1953.
Tyrtikov, A.P. 0 v1iyanli rastite1'nostri na mnogoletnemerzluyu podpochvu
(Effect of vegetation on the permafrost). Materialy k osnovam uchenlya
o merzlykh zonakh zemnoi kory, No.3. Izd-vo Akad. Nauk SSSR, 1956.
Khomlchevskaya, L.S. 0 ponyatii "Deyatel'nyi sl01" v oblasti
rasprostrane-niya mnogoletnemerzlykh gornykh porod (The meaning of the term "actlve
layer" in the permafrost region). Materialy k ッウョッカ。セ uchenlya 0
merzlykh zonakh zemnoi kory, No.2, Izd-vo Akad. Nauk 3SSR, 1955.
Khomicbevskaya, L.S. Opyt opredeleniya glubiny sezonnogo protaivaniya po
teksture merlykh gornykh porod v raione Igarki (Determination of the
depth of seasonal thawing from trle texture of permafrost セョ the Igarka
area). Tr. In-ta セ・イコャッエッカ・、・ョゥケ。 Akad. Nauk SSSR, v. 16, 1960.
Shumskii, P.A. Stroenie merzlykh porod (Structure of permafrost).
Mate-rialy po laboratornym issledovaniyam merzlykh gruntov, No.3, Izd-vo Akad. Nauk SSSR, 1957.
Gandahl, R. and Bergdu, W. Two methods for measuring the frozen zone in
soil. Proe. of the 4th International Eng. Congress, Vol. 1, London,
3.
Composition and Cryogenic Structure of PermafrostThe study of composition and structure of permafrost is one of the most
important tasks of geocryological surveying. It is known that rock and soil
of any origin may be present in a frozen state. Their structural, physical
and engineering characteristics depend to a great extent on their ice
con-tent. It has been established that the amount of ice, as well as the shape,
size and distribution of ice inclusions in unconsolidated rocks depend on the genesis of the latter (the lithology and the characteristics of facies to which they belong), and in consolidated and semiconsolidated rocks on the extent of their fracturing and weathering.
A field investigation of the composition and morphology of permafrost consists of the study of their lithological composition and cryogenic textures.
By cryogenic texture we mean the morphological characteristics of
perma-frost as defined by the ウセ。ー・L size and distribution of lenses, layers,
vein-lets, crusts and pockets of ice. The ice in these inclusions is termed
texture forming, and that which holds the individual soil particles together is known as ice cement.
The morphology of any soil, unfrozen or frozen, is determined by its
structure and texture; the ice obscures the primary structure and texture,
which reflect the conditions of soil formation. The term "cryogenic
structure" and "cryogenic texture" describe the characteristics of composi-tion and morphology of frozen ground resulting from the presence and
distribution of ice in it.
Four types of structure are distinguished in the case of unfrozen
unconsolidated soil: coarse (psephitic), sandy (psammitic), powdery
(aleu-ritic), and clayey (pelitic). The structural characteristics of the soil
are reflected in its name. Therefore it is most important to know how
to determine the size of soil-forming mineral particles and to identify the
soil accordingly. This is not difficult in the case of soils with coarse
and sandy structures (rock debris, gravel, coarse-grained sand, etc.). It
is much more difficult to identify the aleurite, clay loam, and sandy loam,
and these are the soils met with most frequently. As a practical aid, we
may recommend the field soil classification compiled by V.V. Okhotin (1940) or Table XII based on this classification.
It is known that the morphology of sedimentary rocks depends largely
on their texture. The textural characteristics are the lamination and the
alternation of layers and lenses which differ in their granulometric and petrographic compositions, with accumulations of clay particles, mica scales
-26-and plant detritus on lamination planes. There are four main types or
lami-nation: horizontal, wavelike, lenticular, and cross lamination (Fig.
9).
In field investigations it is essential to distinguish clearly between the primary structure and texture of sedimentary rocks (as this is Gone by geologists) and the cryogenic texture.
1. The study of frozen consolidated and semiconsolidated rocks'
The shape and distribution of ice inclusions in these types of rock
correspond to the shape of fractures and voids of various origins. In
granites, diabasis and similar rocks, the ice forms pockets and veinlets
(Fig. 10). In bedded rock (limestone, argillite, marl. sandstone, etc.) the
ice layers and lenses are found in fractures and voids on the bedding
planes. Therefore the examination of fracturing of consolidated and
seml-consolidated rocks is most important. in the study of their cryogenic structure.
II' hydrogeology a distinction is made between fracture and ヲイ。」エセイ・ᆳ
stratal (fracture-pore) water. Accordingly we may diEtlnguish between fracture
cryogenic textures found in consolidated rock and fracture-stratal
(fl'act.ure-pore) cryogenic textures characteristic of セ・、ゥュ・ョエ。イケ rocks (Table xセiiIN
For the purposes of a geocryologlcal survey it is not always reqvired
to study the rocks in great detail. At times i t is quite sufficient to
mention the followipg points only: a) the correct name of rock;
b) the structure of the entire rock body (homoger,eous, bedded, compact, etc. ) ;
c) the nature and extent of fracturing; the shape of fractures and voids and their distribution, whether or not all of them are filled with ice (and illustrate this with sketches), and whether there are any fresh fractures;
d) the extent of modification brought about by weathering (whether or not the rocks are leached, oxidized, etc.); and whether or not there are deposits of oxides, salts, etc., on the fracture planes;
e) the structure of ice inclusions and the orientation of limonite crusts, zeolite, calcite, air bubbles, etc.
*
Translator's note: Terms frequently used by Russian engineering geologists.Consolidated rocks (skal'nye porody) are hard rocks with rigid crystalline
or elastic amorphic bonds. They include massive-crystalline extrusives,
metamorphic and certain hard sedimentary rocks, such as アオ。イエコセウ。ョ、ウエッョ・ウL
conglomerates, breccia with strong cement, quartzites, etc.
Semi-consolidated rocks (poluskal'nye porody) are rocks with elastic
crystalline or amorphic bonds, and plastic colloidal bonds. When subjected
to a load, they undergo elastic deformation up to a certain limit, beyond
which they behave as unconsolidated rocks. Semiconsolidated rocks include
More attention should be paid to bedrock, where the latter forms the
uppermost horizon of permafrost (to a depth of 10 - 12 m) and reveals
considerable changes resulting from weathering and cryogenic processes with-in and outside the zones of tectonic disturbances.
2. The study of perennially frozen Quaternary deposits
There are several methods of studying Quaternary deposits. The most
important are the lithological and the mineralogical methods described in appropriate handbooks.
A special study of the stratigraphy of Quaternary deposits is not one
of the tasks of the geocryological survey. However, it should be noted that
an expert investigating these deposits has the opportunity not only of
collecting the fauna, gathering plant remains, or studying the boulders, but checking the validity of available stratigraphical data as well.
The study of permafrost is done by means of the permafrost-facies
ana-lysis. The basic principles of this method are as follows:
a) The perennially frozen Quaternary deposits differ in their ice content
depending on their genesis and the facies to which they belong. The last
two factors affect the local migration of water and its crystallization on freezing.
b) The shape, size and distribution of ice inclusions depend on the lithological characteristics of the deposits containing the ice (or rather the characteristics of facies, to which these deposits belong), and on the morphogenetic conditions prevailing at the time of freezing of the deposits, i.e. the element of relief where the freezing was taking place (flood plain,
slope, depression at the foot of a terrace, etc.). The rocks of each facies
display a specific cryogenic morphology, i.e. a specific cryogenic texture (Tables XIV and XV).
c) The ice inclusions determine the cryogenic morphology of soils and serve as a reliable genetic indicator of permafrost (flood plain, deluvial, oxbow lake, and lucustrine deposits, their facies and sUbfacies).
The permafrost-facies method renders it possible to investigate the characteristics of composition and cryogenic structure of perennially frozen Quaternary deposits, and to identify their facies and the main genetic types
with the help of the following two groups of factors: 1) the grain size
composition, bedding, fauna, plant remains, etc., and 2) the ice content,
shape, size and distribution of ice inclusions. These two groups of factors
are not simply superimposed one upon the other but are closely interrelated. At present the classification of Quaternary deposits complied by E.V. Shantser is considered to be the best and is recommended for use in geo-cryological surveys (Table XVI).
-28-It is relatively simple to distinguish between the genetic types of
Quaternary deposits. It is, however, essential to have a fair knowledge
of geomorphology and to know how to subdivide the relief into genetic
elements which are closely related to various types of Quaternary deposits. It is also essential to know how to interpret correctly the genetic charac-teristics of the materials (grain size composition, sorting, bedding, plant remain, etc.) and how to use them for the reconstruction of environmental
conditions at the time of deposition. In this respect the study of cryogenic
textures of frozen soil also offers considerable help.
Below we give the characteristics of perenially frozen deposits of various origins.
a) Cryogenic characteristics of eluvial deposits. It is known that
within the permafrost region the destruction of bedrock takes place more
セ。ーゥ、ャケ than outside this region. Because of the effect of freezing and thawing, the rocks here are subjected not only to a more intensive breakdown
but also displacement and even mixing. Therefore we may refer to cryogenic
eluvium as a varipty of eluvium in gener!l.
The composition and morphology of eluvial deposits depend on the
petro-graphic characteristics of the parent rock. There are eluvial カ。セゥ^セエゥ・ウ with
rt Dl'edominance of boulder, rubble, and fine-grained (clay loam) material
formed as a result of disintegration of consolidated and semiconsolidated
イッ」ォセL both resistant and non-resistant to frost.
A description of eluvium should be started by noting its petrographic 2nd grairl size compositions, the proportion of fine-grained and coarse-grained material, the size and shape of rock fragments, and the extent of
their weathering, roundness and sorting. Main attention should be given to
the cryogenic texture of eluvium. It has been found by observations that
eluvium displays three types of· cryogenic textures*: crust-like (Fig. 11),
basal (Fig. 12) and fissured-branching (see Table XIII).
During a geocryological survey one should attempt to study all characteristics of eluvial deposits which may indicate the conditions of
their formation and freezing. Special attention should be paid to the shape
of ice crusts which are less clearly defined in eluvial deposits than, for example, in the talus on steep slopes (see Table XIV).
When describing eluvium with a basal texture in which the ice is the main component and serves as an infilling material of a sort (basal cement), attention should be paid to the presence of mineral particles and their
*
The terms given to cryogenic textures are provisory. Some of them willaggregates "suspended" in the ice.
Eluvial deposits often include ice veins which at times extend to a depth of up to 6 m.
b) Cryogenic characteristics of talus deposits. Talus deposits are
sometimes over 20 m in thickness. They contain a great deal of heterogeneous
clay loam and sandy loam, often of the loess-type, with admixtures of waste,
fragments and boulders of parent rock. It is the presence of these materials
which usually helps to classify the formation as a talus deposit. In the
absence of rock fragments and waste it is rather difficult to identify clay
loams as a talus material. The overlying "mantle clay loams" are often
re-garded as problematic as far as their genesis is concerned*.
The perennially frozen talus deposits of the loess type display chara-cteristic ice inclusions the study of which makes it a relatively simple matter to identify various genetic types.
These genetic types are given in Table XIV.
The clay loams and sandy loams in the talus deposits on relatively dry
slopes are characterized by lenticular ice formations (Table XIV, sketches
1 and 2), while on swampy slopes they display reticulate cryogenic textures
(Table XIV, sketch 3) and "bands", Le. gently waving ice layers. The "bands"
are a most important textural and genetic indicator. They are formed on
the boundary of the layer subject to seasonal thawing due to the presence of
water accumulated on the surface of the frozen material. The study of "bands"
makes it possible to evaluate the changes in the morphology of slopes with time and to interpret the conditions prevailing at the time of formation on the talus deposits.
In some cases over 50% of talus on very swampy slopes consist of ice
and represent a sort of ice breccia. It includes relatively thick (up to
one metre) layers of texture-forming ice containing small lumps of clay
loam, peat, rock waste and even small rock fragments. The ice layers have
a banded texture (Table XIV, sketch
4)
and consist of superimposed ice layersor bands up to
5
or6
cm in thickness. Similar deposits representing aconglomerate of clay loam, peat, rubble and boulders cemented together by ice have been described by S.P. Kachurin (1950), who thought that ice in such deposits was due to solifluction.
As a rule, the ice veins in the talus deposits are small.
c) Cryogenic characteristics of alluvial deposits. Perennially frozen
alluvial deposits form the terraces and the river valley floors, as well as
*
In this case the mantle clay loams represent a product of diagenesis, andof cryogenesis of frozen materials of various origins in particular. (Russian editor).