HAL Id: cea-01135471
https://hal-cea.archives-ouvertes.fr/cea-01135471
Submitted on 25 Mar 2015
HAL is a multi-disciplinary open access
archive for the deposit and dissemination of
sci-entific research documents, whether they are
pub-lished or not. The documents may come from
teaching and research institutions in France or
abroad, or from public or private research centers.
L’archive ouverte pluridisciplinaire HAL, est
destinée au dépôt et à la diffusion de documents
scientifiques de niveau recherche, publiés ou non,
émanant des établissements d’enseignement et de
recherche français ou étrangers, des laboratoires
publics ou privés.
Herschel survey of brown dwarf disks in ρ Ophiuchi
C. Alves de Oliveira, P. Ábrahám, G. Marton, C. Pinte, Cs. Kiss, M. Kun, Á.
Kóspál, P. André, V. Könyves
To cite this version:
C. Alves de Oliveira, P. Ábrahám, G. Marton, C. Pinte, Cs. Kiss, et al.. Herschel survey of brown
dwarf disks in ρ Ophiuchi. Astronomy and Astrophysics - A&A, EDP Sciences, 2013, 559, pp.A126.
�10.1051/0004-6361/201322402�. �cea-01135471�
A&A 559, A126 (2013) DOI:10.1051/0004-6361/201322402 c ESO 2013
Astronomy
&
Astrophysics
Herschel survey of brown dwarf disks in
ρ
Ophiuchi
?,??
C. Alves de Oliveira
1, P. Ábrahám
2, G. Marton
2, C. Pinte
3, Cs. Kiss
2, M. Kun
2, Á. Kóspál
4,
P. André
5, and V. Könyves
5,61 European Space Astronomy Centre (ESA/ESAC), PO Box 78, 28691 Villanueva de la Cañada, Madrid, Spain
e-mail: [email protected]
2 Konkoly Observatory, Research Centre for Astronomy and Earth Sciences, Hungarian Academy of Sciences, PO Box 67,
1525 Budapest, Hungary
3 UJF-Grenoble 1/CNRS-INSU, Institut de Planétologie et d’Astrophysique de Grenoble (IPAG) UMR 5274, 38041 Grenoble, France 4 European Space Research and Technology Centre (ESA/ESTEC), PO Box 299, 2200 AG Noordwijk, The Netherlands
5 Laboratoire AIM, CEA/DSM-CNRS-Université Paris Diderot, IRFU/Service d’Astrophysique, C.E. Saclay, Orme des Merisiers,
91191 Gif-sur-Yvette, France
6 IAS, CNRS (UMR 8617), Université Paris-Sud 11, Bâtiment 121, 91400 Orsay, France
Received 30 July 2013/ Accepted 26 September 2013
ABSTRACT
Context.Young brown dwarfs are known to possess circumstellar disks, a characteristic that is fundamental to the understanding of their formation process, and raises the possibility that these objects harbour planets.
Aims.We want to characterise the far-IR emission of disks around the young brown dwarf population of the ρ Ophiuchi cluster in LDN 1688.
Methods.Recent observations of the ρ Ophiuchi cluster with the Herschel Space Observatory allow us to probe the spectral energy distribution (SED) of the brown dwarf population in the far-IR, where the disk emission peaks. We performed aperture photometry at 70, 100, and 160 µm, and constructed SEDs for all previously known brown dwarfs detected. These were complemented with ancillary photometry at shorter wavelengths. We compared the observed SEDs to a grid of synthetic disks produced with the radiative transfer code MCFOST, and used the relative figure of merit estimated from the Bayesian inference of each disk parameter to analyse the structural properties.
Results.We detected 12 Class II brown dwarfs with Herschel, which corresponds to one-third of all currently known brown dwarf members of ρ Ophiuchi. We did not detect any of the known Class III brown dwarfs. Comparison to models reveals that the disks are best described by an inner radius between 0.01 and 0.07 AU, and a flared disk geometry with a flaring index between 1.05 and 1.2. Furthermore, we can exclude values of the disk scale-height lower than 10 AU (measured at a fiducial radius of 100 AU). We combined the Herschel data with recent ALMA observations of the brown dwarf GY92 204 (ISO−Oph 102), and by comparing its SED to the same grid of disk models, we derived an inner disk radius of 0.035 AU, a scale height of 15 AU with a flaring index of β ∼ 1.15, an exponent for dust settling of −1.5, and a disk mass of 0.001 M . This corresponds to a disk-to-central object mass ratio of ∼1%.
Conclusions.The structural parameters constrained by the extended SED coverage (inner radius and flaring index) show a narrow distribution for the young brown dwarfs detected in ρ Ophiuchi, suggesting that these objects share the same disk evolution and, perhaps, formation.
Key words.brown dwarfs – accretion, accretion disks
1. Introduction
Since the prediction of the existence of brown dwarfs (Hayashi & Nakano 1963;Kumar 1963) and the first detections (Rebolo et al. 1995;Nakajima et al. 1995;Oppenheimer et al. 1995), hun-dreds of these objects have been observed and characterised in different environments, from star forming regions to the field. The formation mechanism of brown dwarfs remains a sub-ject of debate, with a range of theories being proposed where they form either as an extension of the star formation process (Padoan & Nordlund 2002; Hennebelle & Chabrier 2008), or by separate mechanisms such as gravitational instabilities in disks (Stamatellos & Whitworth 2009;Basu & Vorobyov 2012),
? Herschel is an ESA space observatory with science instruments
provided by European-led Principal Investigator consortia and with im-portant participation from NASA.
??
Appendices are available in electronic form at
http://www.aanda.org
premature ejection from prestellar cores (Reipurth & Clarke 2001), or photo-erosion of cores (Kroupa & Bouvier 2003).
The observational properties of brown dwarfs are fundamen-tal to the understanding of their formation. For example, the re-cent discovery of a pre-brown dwarf byAndré et al.(2012) using millimetre interferometric observations has lent additional evi-dence that brown dwarfs are capable of forming in the same way as solar-mass stars. Furthermore, observations of brown dwarfs at their early evolutionary stages suggest that they undergo a T Tauri phase analogous to that of hydrogen-burning stars. For example, brown dwarfs are surrounded by circumstellar disks (e.g.Muench et al. 2001), undergo accretion (e.g.Mohanty et al. 2005), drive molecular outflows (e.g.Whelan et al. 2009), and are magnetically active showing evidence of rotational modu-lation of spots on their surface (e.g.Rodríguez-Ledesma et al. 2009). It is therefore pertinent to ask whether brown dwarfs may also form and harbour planetary systems. Searches of planets around cool dwarfs in the field have failed to find any extrasolar
planets orbiting these objects (e.g.Muirhead et al. 2012;Kubas et al. 2012). However,Han et al.(2013) have recently announced the discovery of a planetary-mass object orbiting a field brown dwarf that was found using gravitation microlensing. By study-ing the disks of the young analogues of these objects in the ear-lier stages of formation, we can assess whether the conditions to form planets are present.
In this paper, we aim at studying the disks of the brown dwarf population of the ρ Ophiuchi cluster (LDN 1688). At 1 Myr, the age usually taken for ρ Oph, the hydrogen-burning mass limit corresponds to a spectral type of ∼M6.25 (Luhman et al. 2007;
Baraffe et al. 1998;Chabrier et al. 2000). We focus our work on the most updated list of spectroscopically confirmed members with spectral type later than ∼M6 compiled inAlves de Oliveira et al.(2012), adding to this list one brown dwarf found byMuži´c et al. (2012). There are 43 spectroscopically confirmed brown dwarf members of Ophiuchus. The existence of disks around several of these objects has been previously established from the detection of mid-IR excess (e.g.Bontemps et al. 2001;Natta et al. 2002;Testi et al. 2002;Barsony et al. 2005;McClure et al. 2010; Alves de Oliveira et al. 2012). The T Tauri disk popula-tion of this cluster has been studied by previous missions ex-tending to the far-infrared regime (e.g. IRAS, ISO, and Spitzer,
Young et al. 1986;Bontemps et al. 2001; Wilking et al. 2001;
Padgett et al. 2008). However, even with the increased sensitiv-ity of Spitzer over ISO, none of the brown dwarf disks was de-tected byPadgett et al.(2008) in the analysis of the MIPS 70 µm data (see alsoEvans et al. 2009), probably owing to limitations imposed by the bright background and poor angular resolution.
We present new photometric observations at 70, 100, and 160 µm obtained with the Herschel Space Observatory (Pilbratt et al. 2010), extending the spectral energy distribution (SED) of the young brown dwarfs to the far-IR regime to study the physical properties of their disks. At the time of the writ-ing, this study presents the first complete survey of brown dwarf disks in a young cluster with the Herschel Space Observatory at far-IR wavelengths. Previous comparable works include a sur-vey of brown dwarf and low mass star disks sampling a few ob-jects per cluster across different environments and ages (Harvey et al. 2012a,b). Prior to the launch of Herschel, some bench-mark studies of disks around brown dwarfs were conducted in the submillimetre (Scholz et al. 2006;Bouy et al. 2008;Joergens et al. 2012). More recently,Ricci et al.(2012) have used ALMA to observe a brown dwarf in ρ Oph. In Sect. 2we present the Herschelobservations and describe the data reduction. In Sect.3
we show the brown dwarf detections in our photometric survey, and the modelling of their disks. We discuss the implications of our results in Sect.4, and present the conclusions in Sect.5. 2. Observations and data reduction
The ρ Ophiuchi cluster was observed with the Photodetector
Array Camera and Spectrograph (PACS; Poglitsch et al.
2010) on board Herschel on February 8, 2012 (program
OT1_pabraham_3). Observations were made in PACS scan map-ping mode (70 and 160 µm) using a scan and cross-scan speed of 2000/s in order to reach optimum point-source sensitivity and
point-spread function (PSF) stability, totalling 12.8 h of ob-serving time. The map covers an area of ∼1.6 deg2 centred on
the Ophiuchus cluster (16h27m06.30s, −24◦28048.500). We have added to this study data from the Herschel Gould Belt Survey (HGBS;André et al. 2010) taken with the PACS scan mapping mode (100 and 160 µm), with an observing time of 7 h for a map slightly larger on sky than ours.
The data reduction for the OT1 and HGBS observations was done from level 0 to level 2.5 (final map with the com-bined scan directions) within the Herschel Interactive Processing Environment (HIPE version 8.2,Ott 2010), where an optimised pipeline was created and tailored for faint source detection. For the 160 µm data, we combined the OT1 and HGBS observations to achieve the deepest possible map. In the preprocessing stage we used scan-speed selection, where the allowed velocities were in the range of 10 to 3000/s. Then, a high-pass filter was applied
with a filter-width of 15, 16, and 32 readouts, and a pixel size of 2, 3, and 400was used to project blue, green, and red maps (70,
100, and 160 µm), respectively, using the photProject map mak-ing tool. The flux cut level for high-pass-filter maskmak-ing was set to be 1.5 times the standard deviation of the per-pixel flux values. Glitches were removed with the built-in MMT routine. Although the MMT deglitching method is better suited for faint targets, it may cause flux loss in the case of bright sources, typically for those above 100 mJy. To check whether this phenomenon can modify our values, an additional set of maps was created, now using second level deglitching, instead of MMT. The fluxes ob-tained by the two methods were compatible within the photomet-ric uncertainties, even for our brightest sources (GY92 154 and GY92 344) and therefore we used the MMT flux values through-out the paper.
We searched the PACS maps for detections of the 43 known brown dwarfs and the pre-brown dwarf (André et al. 2012) in the cluster by attempting to fit a 2D Gaussian within <400 from each source’s expected coordinates. For sources where this was successful, the point-source flux was obtained by doing aper-ture photometry centred on the 2D Gaussian peak coordinates. The aperture radii were set to be the average value between the ellipse axes of the PSF full-width half-maximum (5.61, 6.79, and 11.3900, for 70, 100, and 160 µm, respectively). The
inter-polated encircled energy fraction (EEF) for a given aperture size was calculated by fitting a hexic equation to the EEF values reported in the PACS Point-Source Flux Calibration Technical Note (April 2011). For the sky subtraction, we used two radii of 2 and 4 times the aperture radius. Finally, the colour correction values reported in the PACS Photometer Passbands and Colour Correction Factors for Various Source SEDs (April 2011) were used to correct the flux for all bands for a blackbody temperature of ∼1000 K. We validated this method by calculating the flux of reference stars, for which we find an average difference from the reference values of ∼2%. To estimate the uncertainty of the flux measurements, we populated the images with artificial sources of 1 Jy brightness in a radius of 100from each source position.
A source mask was first created with GetSources (Men’shchikov et al. 2012), to ensure that there was no overlap between artifi-cial and real sources. Aperture photometry was carried out in the same way as for the brown dwarfs. This process was repeated 200 times for each brown dwarf location, with the measured fluxes varying around 1 Jy. We take the standard deviation of the 200 artificial source fluxes as a measure of the photometric uncertainty that includes the contribution of the sky background, as well as that of the photometric extraction method. The fluxes of the brown dwarfs detected with PACS are given in Table1. All detected sources have a 3σ detection in at least one PACS band. In TableA.1we give the 1σ upper limits for the non-detected sources.
The HGBS observations were taken in parallel mode, there-fore we could also search the observations taken with the SPIRE instrument (Griffin et al. 2010) for counterparts of the Ophiuchus brown dwarfs. Only the source GY92 344 is detected. Using aperture photometry we derived flux densities of 3.90, 4.20,
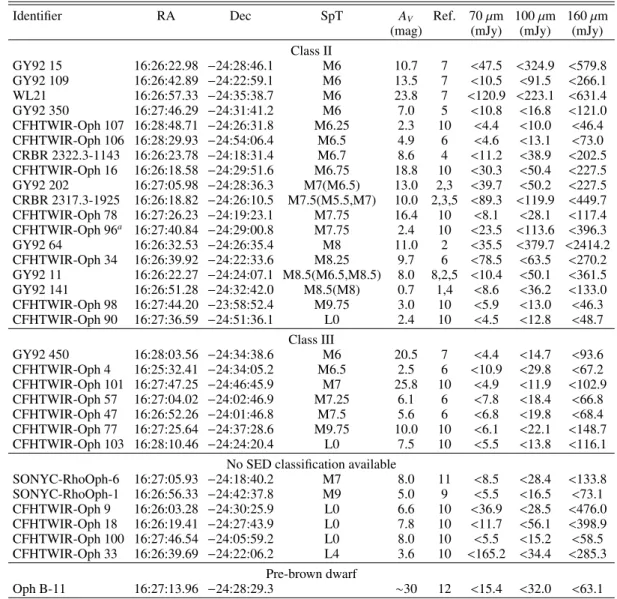
C. Alves de Oliveira et al.: Herschel survey of brown dwarf disks in ρ Ophiuchi Table 1. Herschel/PACS fluxes for the detected brown dwarfs in ρ Ophiuchi.
Identifier RA Dec SpT AV Ref. 70 µm 100 µm 160 µm
(mag) (mJy) (mJy) (mJy)
GY92 154 16:26:54.79 −24:27:02.1 M6 20.1 1, 4, 8 87.5 ± 10.3 172.8 ± 32.8 399.6 ± 246.4 GY92 171 16:26:58.41 −24:21:30.0 M6 6.6 1, 4, 8 41.2 ± 10.5 53.6 ± 34.8 <189.0 GY92 204a 16:27:06.60 −24:41:48.8 M6(M5.5) 0.5 1, 4, 5, 6 80.1 ± 5.6 48.4 ± 19.1 <115.2 ISO-Oph 160 16:27:37.42 −24:17:54.9 M6 6.0 4, 5 38.8 ± 7.6 61.9 ± 20.5 <93.8 GY92 344 16:27:45.78 −24:44:53.6 M6 16.2 1, 4, 8 727.3 ± 4.4 1338.8 ± 12.8 2675.6 ± 87.4 GY92 371 16:27:49.77 −24:25:22.2 M6 5.4 1, 4, 8 42.5 ± 6.3 68.4 ± 19.8 <139.7 GY92 397 16:27:55.24 −24:28:39.7 M6 5.0 1, 4, 8 64.5 ± 6.1 74.7 ± 18.4 <103.4 ISO-Oph 193 16:28:12.72 −24:11:35.6 M6 7.5 4, 5 43.2 ± 4.6 38.6 ± 11.8 63.2 ± 58.8 CFHTWIR−Oph 66 16:27:14.34 −24:31:32.0 M7.75 15.1 7, 9 46.2 ± 9.6 51.6 ± 28.2 <201.0 GY92 3 16:26:21.90 −24:44:39.8 M8(M7.5) 0.0 1, 4, 5, 6 45.6 ± 6.1 <27.2 <65.7 GY92 264 16:27:26.58 −24:25:54.4 M8 0.0 1, 6 26.1 ± 8.6 64.1 ± 28.4 <158.3 GY92 310 16:27:38.63 −24:38:39.2 M8.5(M7,M6) 5.7 1, 2, 3, 4, 5 93.8 ± 5.5 80.8 ± 15.8 <119.4
Notes. Upper limits for non-detections are listed in TableA.1.(a)GY92 204 corresponds to ISO−Oph 102 observed with ALMA byRicci et al.
(2012).
References. (1)Greene & Young(1992); (2)Wilking et al.(1999); (3)Luhman & Rieke(1999); (4)Bontemps et al.(2001); (5)Natta et al.(2002);
(6)Wilking et al.(2005); (7)Alves de Oliveira et al.(2010); (8)McClure et al.(2010); (9)Alves de Oliveira et al.(2012).
70
µ
m
GY92 154 GY92 171 GY92 204 ISO-Oph 160 GY92 344 GY92 371 GY92 397 ISO-Oph 193 CFHTWIR-Oph 66 GY92 3 GY92 264 GY92 310
10
0
µm
16
0
µm
Fig. 1.Herschel/PACS images of young brown dwarfs in ρ Ophiuchi at 70 µm (top row), 100 µm (middle row), and 160 µm (bottom row). All
images are 6000
by 6000
in size centred on the brown dwarf’s coordinates (north is up, east is left), are shown in “DS9 Zscale” stretch colour and, for display clarity only, have been smoothed by a 1σ Gaussian filter.
and 2.26 Jy at 250, 350, and 500 µm (aperture radii of 22, 30, and 4200), respectively. We did not apply an aperture correction to these flux values since there is a strong contribution from scat-tered light (see Sect.3.2).
3. Results
3.1. Herschel/PACS detections
Previous mid-IR studies of ρ Ophiuchi have classified 31 brown dwarfs as Class II (Bontemps et al. 2001; Natta et al. 2002;
Testi et al. 2002; Barsony et al. 2005; McClure et al. 2010;
Alves de Oliveira et al. 2012). We detect 38% of the Class II brown dwarfs in our deep Herschel observations. In particu-lar, we detect 12 sources at 70 µm with signal-to-noise ratio S/N > 3σ. From these, we detect 11 sources at 100 µm, but with a lower S/N which results from the shorter exposure time of those observations. Only three sources are detected at 160 µm, where background emission becomes higher. Figure1shows the Herschel/PACS images of the detected young brown dwarfs in ρ Ophiuchi.
Harvey et al. (2012b) included in their sample of brown dwarfs one member of Ophiuchus that is also located within our Herschel/PACS map (CFHTWIR-Oph 96). We do not detect
this object in our deep observations and only derive the 1σ upper limits of <23.5, <113.6, and <396.3 mJy at 70, 100, and 160 µm, respectively. These values are in agreement with those measured by Harvey et al. (2012b) from their PACS “mini-scan-maps” (Fν(70 µm)= 5 ± 20 mJy and Fν(160 µm)= 130 ± 200 mJy).
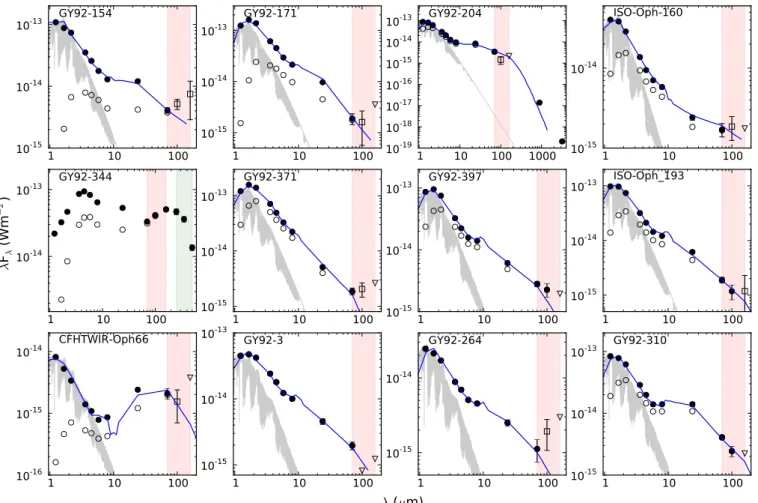
The recently discovered pre-brown dwarf core in the Ophiuchus cluster byAndré et al.(2012) using millimetre inter-ferometric observations (Oph B-11) is not detected in our PACS maps and we are only able to derive the 1σ upper limits of <15.4, <32.0, and <63.1 mJy at 70, 100, and 160 µm, respectively. 3.2. Spectral energy distribution of detected brown dwarfs We constructed the SED for each source detected with PACS by adding ancillary data at near and mid-IR wavelengths, from 2MASS (Cutri et al. 2003), WIRCam/CFHT, and Spitzer (Alves de Oliveira et al. 2010). Figure2 shows the final SEDs with the original fluxes plotted as open circles. The black filled circles (for >3σ detections) show the fluxes dereddened by the extinction values listed in Table 1, using the extinction law of Weingartner & Draine (2001). The wavelength range of the new Herschel/PACS observations is highlighted in red. Several sources are only marginally detected at 100 and 160 µm A126, page 3 of10
1
10
100
10
-1510
-1410
-13GY92-154
1
10
100
10
-1510
-1410
-13GY92-171
1
10
100 1000
10
-1910
-1810
-1710
-1610
-1510
-1410
-13GY92-204
1
10
100
10
-1510
-14ISO-Oph-160
1
10
100
10
-1410
-13GY92-344
1
10
100
10
-1510
-1410
-13GY92-371
1
10
100
10
-1510
-1410
-13GY92-397
1
10
100
10
-1510
-1410
-13ISO-Oph_193
1
10
100
10
-1610
-1510
-14CFHTWIR-Oph66
λ
F
λ(W
m
− 2)
1
10
100
10
-1510
-1410
-13GY92-3
1
10
100
10
-1510
-14GY92-264
1
10
100
10
-1510
-1410
-13GY92-310
λ
(
µ
m)
Fig. 2.SEDs of the young brown dwarfs detected with Herschel. All fluxes have been dereddened using the visual extinction values from Table1
and are shown as filled circles for >3σ detections; open squares depict marginal detections (1< σ <3), and open triangles show 1σ upper limits. The original fluxes are marked with open circles. The Herschel/PACS wavelength range is shown by the red shaded region, and for GY92 344 the Herschel/SPIRE wavelength range is marked by the green shaded region. NextGen model photospheres are shown in light grey. The model with the best-fit parameters is overplotted in blue.
(1 < σ < 3), and these are shown as open squares. The 1σ upper limits are shown as inverted triangles.
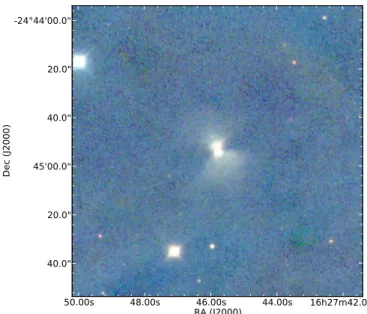
For two sources (GY92 204 and 344), the SEDs are also complemented at longer wavelengths. The brown dwarf GY92 204 has recently been observed in the millimetre with ALMA (Ricci et al. 2012). They measure a flux density of 4.10 ± 0.22 mJy at 0.89 mm and 0.22 ± 0.03 mJy at 3.2 mm. We include these measurements on the SED. The other source, GY92-344 is detected at all SPIRE wavelengths. From near-IR images and the shape of its SED with a significant IR excess, this object resem-bles a very massive edge-on disk. However, it is most likely an example of a large shadow projected by its circumstellar disk on the surrounding cloud (see, for example,Hodapp et al. 2004;
Pontoppidan & Dullemond 2005). In Fig. B.1, we show a
colour-composite of the JHK WIRCam/CFHT near-IR images, where
the central object and scattered light are clearly seen. A detailed study of this object is beyond the scope of this paper.
3.3. Disk modelling
Disks around brown dwarfs radiate from the infrared to the mil-limetre range. Their geometry and dust properties affect the amount of radiation that is absorbed or scattered, setting the temperature of the dust and the amount of re-emitted thermal radiation and shaping their SEDs. We compared the observed
brown dwarf SEDs to the same grid of disk models presented by
Harvey et al.(2012a), built with the radiative transfer code us-ing the Monte-Carlo method MCFOST (Pinte et al. 2006,2009). Our goal is to study the scale height and flaring angle of the disk. We summarise here the modelling setup in building the grid of disk models, a more detailed description is given inHarvey et al.
(2012a).
In MCFOST, the disk extends from an inner radius (rin) to
an outer limit radius (rout) and is parametrized as follows. The
dust density distribution has a Gaussian vertical profile, while the dust surface density and the scale height are power-law dis-tributions: ρ(r, z) = ρ0(r) exp(−z2/2 h2(r)),Σ(r) = Σ0(r/r0)−p,
and h(r) = h0(r/r0)γ, respectively, where r is the radial
co-ordinate in the equatorial plane and h0 is the scale height at
a fiducial radius r0 = 100 AU. The dust grains are defined as
homogeneous and spherical with a differential grain size distri-bution of the form dn(a) ∝ a−3.5da, between a minimum grain size of 0.03 µm and a maximum grain size between 1 µm and 1 mm. Dust extinction and scattering opacities, scattering phase functions, and Mueller matrices are calculated using Mie the-ory. Furthermore, it is assumed that the grain properties are in-dependent of position within the disk, that the grain size distri-bution and dust composition are fixed parameters, and that the outer radius is fixed at 100 AU. The parameters left free to vary in the grid are the inner disk radius and disk inclination, the
C. Alves de Oliveira et al.: Herschel survey of brown dwarf disks in ρ Ophiuchi Table 2. Range of validity from the Bayesian inference for the disk model parameters.
Identifier MBDa Inclination Dust mass Rin h0@100AUb βb pb amax
(MJup) (◦) Log10(M/M ) (AU) (µm)
GY92 154 75...121 41 [0:46] −4 [−6:−4] 0.0354 [0.0096:0.0679] 10 [10:20] 1.1 [1.1:1.15] −1.5 [−1.5:−1.5] 1000 [1:1000] GY92 171 75...121 32 [0:60] −4.5 [−7:−5] 0.0184 [0.0096:0.0354] 10 [10:20] 1.0 [1.0:1.1] −1.5 [−1.5:−0.5] 1000 [1:1000] GY92 204 75...121 63 [0:66] −5 [−5:−5] 0.0354 [0.0184:0.0354] 15 [10:20] 1.15 [1.0:1.15] −1.5 [−1.5:−1.0] 1 [1:1] ISO-Oph 160 75...121 70 [0:66] −5 [−6.5:−4] 0.005 [0.005:0.0679] 15 [10:20] 1.05 [1.05:1.15] −0.5 [−1.5:−0.5] 1000 [1:1000] GY92 371AB 75...121 70 [26:76] −6.5 [−7:−5] 0.0184 [0.0095:0.0354] 10 [10:15] 1.0 [1.0:1.05] −1 [−1.5:−1.0] 1 [1000:1000] GY92 397 75...121 18 [0:60] −5 [−6.5:−4.5] 0.005 [0.0096:0.0679] 20 [10:20] 1.0 [1.05:1.15] −0.5 [−1.5:−0.5] 1 [1:1000] ISO-Oph 193 75...121 18 [0:53] −4.5 [−7:−5] 0.005 [0.005:0.0679] 15 [10:20] 1.0 [1.05:1.15] −0.5 [−1.5:−0.5] 1 [1:1000] CFHTWIR-Oph 66 25...48 87 [84:90] −6.5 [−7:−6] 0.0679 [0.0096:0.2500] 15 [15:20] 1.2 [1.1:1.2] −1 [−1.5:−0.5] 1000 [1000:1000] GY92 3 20...40 41 [0.0:53] −5.5 [−6:−4] 0.0184 [0.0096:0.0354] 20 [15:20] 1.05 [1.0:1.1] −1 [−1.5:−0.5] 1 [1:1000] GY92 264 20...40 32 [0.0:53] −6 [−6.5:−4] 0.0184 [0.0184:0.0354] 20 [15:20] 1.1 [1.0:1.15] −1.5 [−1.5:−0.5] 1 [1:1000] GY92 310 15...30 32 [0.0:46] −5 [−5:−4] 0.0184 [0.005:0.1303] 20 [15:20] 1.1 [1.1:1.1] −1.5 [−1.5:−1.5] 1 [1:1000]
Notes. In Cols. 3 to 9, the first number corresponds to the model plotted in Fig.2.(a)Masses were derived by converting the spectral types from
Table1to temperature using the empirical relation fromLuhman et al.(2003), and the Dusty evolutionary models (Chabrier et al. 2000). The range in masses denotes a typical error in spectral classification of half a sub-spectral type.(b)In MCFOST, the scale height and the dust surface
density are treated as power-law distributions of the form h(r)= h0(r/r0)βandΣ(r) = Σ0(r/r0)−p, respectively, where r is the radial coordinate in
the disk plane, and h0is the scale height at a fiducial radius at 100 AU.
scale-height parameters, the surface density exponent, and the maximum grain size.
In the comparison of the observed SEDs with the grid of disk models, the known stellar parameters are used as input (ef-fective temperature, visual extinction), and represented by the respective NextGen atmospheric model (Hauschildt et al. 1999). A Bayesian analysis is used to determine the most likely range of parameters that reproduces the observations. Figure2shows one of the most likely fitting models overlaid on the brown dwarfs’ observed SEDs (blue solid line). Table 2 presents the resulting disk parameters of the synthetic SED that match the observations, found using a χ2 minimisation. We also give the
ranges of validity for each parameter quoted in brackets derived from the Bayesian inference, corresponding to regions where P > 0.5 × PMax. We have not modelled the disk of GY92 344
since its particular geometry very likely introduces in the photo-metric measurements strong contamination from scattered light, and also makes the measurement of extinction towards the object very uncertain. In this disk orientation, the SED is very sensitive to the inclination angle, and the coarse sampling in our grid of models would be insufficient to derive a reliable model. 4. Discussion
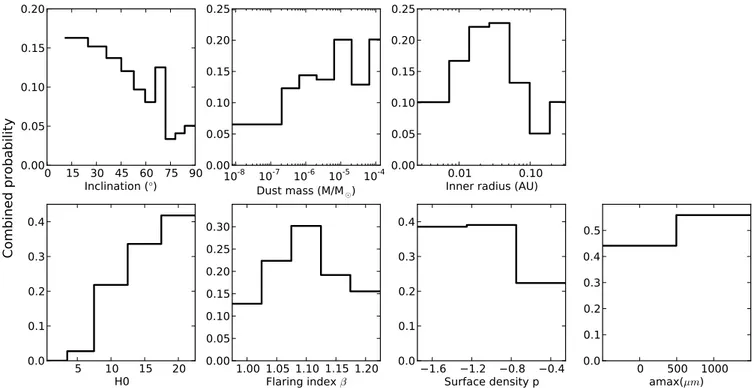
With the new Herschel observations, the combination of the far-IR measurements with previous data at shorter wavelengths, and for one object ALMA millimetre observations, results in an un-precedented dataset for the ρ Ophiuchi brown dwarfs. Taking advantage of the extended SED coverage, we attempted for the first time to characterise their disk structural properties by us-ing the radiative transfer code MCFOST. The histograms of the combined probability distributions for the 11 brown dwarfs mod-elled are shown in Fig.3for each free parameter explored in the MCFOST grid.
4.1. Structural properties of the brown dwarf disks
The disks are found at a variety of inclinations and do not show a particular alignment on the sky, though for most objects this parameter is only loosely constrained (see the ranges of valid-ity in Table 2). The SED of CFHTWIR-Oph 66 is consistent with a nearly edge-on disk geometry (87◦, range of validity be-tween 84◦ and 90◦). This object was previously characterised
byAlves de Oliveira & Casali (2008) as being variable in the near-IR, with variations consistent with a change in extinction probably originating from orbiting material in the circumstellar environment. This scenario is also supported by the disk orien-tation derived here.
The histogram of the combined probability distribution of the inner disk radius for all brown dwarfs shows a narrow range that allows us to calculate a typical inner disk radius be-tween 0.01 and 0.07 AU. This parameter is also well constrained for all objects individually. The near and mid-IR data are sen-sitive to the inner disk, but the extension of the SED character-isation into the far-IR with Herschel is crucial in constraining other disk parameters and therefore improving the model solu-tion. Within the sample of 11 brown dwarfs, we searched for a possible correlation between the inner radius and the mass of the central object, similar to that obtained for young Herbig Ae and late Be stars (Millan-Gabet et al. 2007), but we did not find any clear trend.
In the wavelength range of our observations, typi-cally ≤70 µm, the disk emission is still optitypi-cally thick, and there-fore any attempt to derive dust masses from the disk emission at these wavelengths is likely to be askew. Assuming a gas-to-dust ratio of 100, the derived disk masses are between 0.001 and 0.01 M for the brown dwarfs with an M6 spectral type
(corresponding to masses between 0.075 and 0.121 M for the
central object), and systematically lower, between ∼3 × 10⁻⁵ and 0.001 M for the four brown dwarfs with spectral types
around M8 (brown dwarf masses between 0.015 and 0.048 M ).
The only exception is GY92 371 that has a spectral type of M6 and a low disk mass of ∼3 × 10⁻⁵, but with a large valid-ity range. This object corresponds to the only binary known in our sample (Ratzka et al. 2005) with a companion at a distance of 0.347 ± 0.00100. At this separation, the binary cannot be
re-solved in the mid or far-IR observations. Since our grid of mod-els assumes all central sources to be single, the derived disk pa-rameters could be affected. For the remaining sources, the values are consistent with a ratio of disk mass to central object of less than a few percent. However, the exact result can only be de-rived by observations at longer wavelengths, since our data are not sensitive to the outer part of the disk. The only source for which we can accurately study the disk mass using the grid of models is GY92 204, where the SED is complete up to the mil-limetre regime (Sect.4.3).
0 15 30 45 60 75 90
Inclination (
°)
0.00
0.05
0.10
0.15
0.20
Combined probability
10
-810
-710
-610
-510
-4Dust mass (M/M
¯)
0.00
0.05
0.10
0.15
0.20
0.25
0.01
0.10
Inner radius (AU)
0.00
0.05
0.10
0.15
0.20
0.25
5
10 15 20
H0
0.0
0.1
0.2
0.3
0.4
1.00 1.05 1.10 1.15 1.20
Flaring index
β0.00
0.05
0.10
0.15
0.20
0.25
0.30
1.6
1.2
0.8
0.4
Surface density p
0.0
0.1
0.2
0.3
0.4
0
500 1000
amax(
µm)
0.0
0.1
0.2
0.3
0.4
0.5
Fig. 3.Combined probability distributions for the disk parameters of the 11 brown dwarf disks modelled.
The Herschel measurements at 70 µm allow us to constrain the flaring index (β) of the brown dwarf disks that shows a nar-row peaked probability distribution for each individual object, and for the combined sample as well. We find a range of valid-ity for the histogram of the combined probabilvalid-ity between 1.05 and 1.2, consistent with a flared disk geometry. Furthermore, we can exclude values of the scale height smaller than 10 AU (mea-sured at a fiducial radius of 100 AU), though we cannot exclude values larger than ∼20 AU, since our grid does not probe this parameter beyond this range.
Finally, neither the surface density index (p) nor the maxi-mum grain size (amax) are constrained by our observations.
4.2. Comparison to other disk studies
Studies of brown dwarf disks in the far-IR regime are still rela-tively scarce. Our results can be directly compared to those pre-sented inHarvey et al.(2012a,b), because we used the same in-strument and, more importantly, the same grid of models. The first immediate conclusion is that the analysis of the 11 brown dwarf disks in ρ Ophiuchi reveals a much narrower combined probability distribution of the inner disk radius and the flaring index than that in Harvey et al.(2012a). These parameters are well constrained for each individual brown dwarf, and the result is consistent with the fact that our sample is restricted to coeval objects that span a limited range in mass. For the same param-eters, Fig. 10 ofHarvey et al.(2012a) shows a large spread of values. This is likely to be a reflection of the range in ages (from ∼1 to 10 Myr) and larger differences in central mass of their entire sample taken over several clusters. Unfortunately, the au-thors have not published the results of the modelling for par-ticular subsets of objects with similar ages or masses, thus we cannot extend our comparative analysis. We can, however, em-phasise the point that based on those two disk structure parame-ters (inner radii and flaring index), which are well constrained by our observations, our coeval sample of brown dwarfs in ρ Ophiuchi presents very similar properties. This implies that
all these brown dwarf disks have evolved, and were probably formed, in similar circumstances.
In another recent study using Herschel observations,Spezzi et al. (2013) have used a different radiative transfer code to study the disk properties of low-mass stars in the ∼2 Myr old Chamaeleon II cluster. Although their sample does not reach into the substellar regime, a few of their targets have spectral types corresponding to low masses of ∼0.3 M . For these objects, they
find a typical inner radius between 0.02 and 0.1 AU and a flaring index between 1.1 and 1.2. These results are consistent with our findings, and suggest that disk properties change smoothly from brown dwarfs to low mass stars.
An attempt by Riaz & Gizis(2012) to detect brown dwarf disks with Herschel in the TW Hydrae association (∼10 Myr) has not been successful. Based on the derived upper limits at far-IR wavelengths and radiative transfer modelling, they esti-mate that the TW Hydrae brown dwarf disks have a lower mass than younger counterparts. Given that our longest wavelength observations are probably not sensitive to the outer part of the disk, we cannot test this result.
Finally, it is relevant to compare our results to the brown
dwarf 2MASS J04442713+2512164, a member of Taurus
(M7.25, 1−3 Myr) with an extensive SED coverage that was studied thoroughly byBouy et al.(2008) using MCFOST. They find that the well-constrained disk structural properties are the inner disk radius with values between 0.02 and 0.1 AU and a peak probability at approximately 0.04 AU, the flaring index with a value between 1.1 and 1.2, and the scale height which is found to be in the range of 30 to 60 AU, with a most proba-ble value around 45 AU. The high value derived for the scale height is interpreted as being consistent with the hydrostatic scale height predicted for brown dwarfs byWalker et al.(2004). The result for this young brown dwarf is in good agreement with results in ρ Ophiuchi. Although we cannot constrain the scale height of our brown dwarf disks, we have excluded values below 10 AU. Together, these findings seem to contradict the in-dications that disks around brown dwarfs are significantly flatter
C. Alves de Oliveira et al.: Herschel survey of brown dwarf disks in ρ Ophiuchi than for disks surrounding T Tauri stars (e.g.Sz˝ucs et al. 2010).
This interpretation has recently been revisited by Mulders & Dominik (2012). Using radiative transfer modelling of median SEDs of T Tauri stars and brown dwarfs separately, they con-clude that the reduction in the degree of flaring observed in brown dwarf disks does not imply a structural difference in the disks but instead can be explained by the fact that for lower mass objects, the disk emission at a particular wavelength corresponds to different radii, giving rise to the differences in the measured scale heights (see also Apai 2013). Our observations seem to corroborate these findings.
4.3. Combining Herschel and ALMA observations: GY92 204 We compared the results of our SED modelling of GY92 204 (ISO−Oph 102) combining the Herschel and ALMA observa-tions, with those presented byRicci et al.(2012). We adopt for this object a spectral type of M6 (Natta et al. 2002), although this classification has been contested by Wilking et al.(2005) who classify it as an M5.5. We converted the spectral type to temperature using the empirical relation from Luhman et al.
(2003), and used the Dusty evolutionary models (Chabrier et al. 2000) to derive the expected mass from its effective temperature.
Taking into account an error in spectral classification of half a sub-spectral type, the mass range predicted by the evolutionary models is between 75 and 121 MJup, placing this object at the
substellar limit.
The most probable fit from our model grid gives an incli-nation around 63◦, an inner radius of 0.035 AU, a scale height
of 15 AU with a flaring index β ∼ 1.15, an exponent for dust settling of −1.5, and a dust mass of 1 × 10⁻⁵ M . If we
as-sume a gas-to-dust mass ratio of 100, this corresponds to a disk mass of 0.001 M (∼1 MJup), and a fraction of 0.8 to 1.3%
of the mass of the central object (75 to 121 MJup).Ricci et al.
(2012) find a disk mass that varies between ∼2 to 6 × 10⁻⁶ M
or ∼2 to 6 × 10⁻⁴ M
depending on the assumed dust opacity,
which is their most uncertain parameter. In MCFOST, the opac-ity law is not assumed directly, and opacities are calculated using Mie theory from the grain size distribution and dust composi-tion. For reference, for the modelling of GY92 204 we calculate κdust
0.89 mm= 0.37 cm
2/g for amax = 1 µm and κdust
0.89 mm = 3.6 cm
2/g
for amax= 1 mm.
The comparison between results achieved with different modelling approaches is not straightforward. We conclude that our disk mass estimate is approximately in agreement with that derived byRicci et al.(2012), assuming higher dust opacity val-ues. Furthermore, the disk-to-central object mass ratio is consis-tent with what is found for other T Tauri stars in ρ Oph (Andrews et al. 2009,2010) and other regions (e.g.Williams & Cieza 2011;
Andrews et al. 2013).
5. Conclusions
We present the first Herschel survey of disks around brown dwarfs of an entire star forming region, ρ Ophiuchi. We detected 12 brown dwarf disks at 70 µm, out of which 11/3 are also de-tected at 100/160 µm. Combining the new far-IR data with in-formation from the literature, we constructed SEDs and used the MCFOST radiative transfer code to investigate the likely range of parameters that reproduce the structural properties of the disks of 11 sources.
We find that the brown dwarfs in the ∼1 Myr old ρ Ophiuchi cluster are surrounded by disks well described by an inner radius
between 0.01 and 0.07 AU. Furthermore, the Herschel measure-ments at 70 µm can constrain the degree of flaring of the disks. We find that they are well described by a flaring index between 1.05 and 1.2, and we can exclude values of the scale height lower than 10 AU (measured at a fiducial radius of 100 AU). This sug-gests that brown dwarf disks share a similar degree of flaring as T Tauri stars. Furthermore, the disk parameters constrained by our SED coverage (inner radius and flaring index) describe well all 11 brown dwarf disks, indicating that for this coeval sample of a small range in masses, objects have a similar disk evolu-tion and, perhaps, formaevolu-tion. We note, however, that because of the Herschel sensitivity limit, our observations are incomplete, and biased towards detecting the brighter disks. Thus, our find-ings on the disk parameters cannot be extrapolated to the entire substellar population of this cluster.
We combined the new Herschel photometry with recently published ALMA submillimetre observations for one of the brown dwarfs with an estimated mass at the substellar limit (GY92-204), and derived the most probable parameters by com-paring it to the same grid of models produced with MCFOST. We estimate a disk mass of 0.001 M (∼1 MJup). According to the
evolutionary models, this brown dwarf has a mass between 75 and 121 MJup, meaning that the disk mass is 0.8 to 1.3% of the
mass of the central object. This result is consistent with the find-ings from ALMA observations, and also with the disk-to-star mass ratio found for T Tauri stars.
Future ALMA measurements of more brown dwarfs disks, combined with Herschel data, which we have shown can con-strain parameters of the structure geometry, will certainly pro-vide a better understanding of disks around brown dwarfs.
Acknowledgements. We thank the referee for a helpful review. This work was partly supported by the Hungarian national Research Fund OTKA K101393. C.K.’s work has been supported by the PECS-98073 grant of the European Space Agency and the Hungarian Space Office, the K-104607 grant of the Hungarian Research Fund, and the Bolyai Fellowship of the Hungarian Academy of Sciences. C. Pinte acknowledges funding from the European Commission’s 7th Framework Program (contract PERG06-GA-2009-256513) and from Agence Nationale pour la Recherche (ANR) of France under contract ANR-2010-JCJC-0504-01. Calculations were performed at Service Commun de Calcul Intensif de l’Observatoire de Grenoble (SCCI) on the Fostino super-computer funded by ANR (contracts ANR-07-BLAN-0221, ANR-2010-JCJC-0504-01 and ANR-2010-JCJC-0501-01) and the European Commission’s FP7 (con-tract PERG06-GA-2009-256513). PACS has been developed by a consor-tium of institutes led by MPE (Germany) and includes UVIE (Austria); KU Leuven, CSL, IMEC (Belgium); CEA, LAM (France); MPIA (Germany); INAF- IFSI/OAA/OAP/OAT, LENS, SISSA (Italy); IAC (Spain). This devel-opment has been supported by the funding agencies BMVIT (Austria), ESA-PRODEX (Belgium), CEA/CNES (France), DLR (Germany), ASI/INAF (Italy), and CICYT/MCYT (Spain).
References
Alves de Oliveira, C., & Casali, M. 2008, A&A, 485, 155
Alves de Oliveira, C., Moraux, E., Bouvier, J., et al. 2010, A&A, 515, A75 Alves de Oliveira, C., Moraux, E., Bouvier, J., & Bouy, H. 2012, A&A, 539,
A151
André, P., Men’shchikov, A., Bontemps, S., et al. 2010, A&A, 518, L102 André, P., Ward-Thompson, D., & Greaves, J. 2012, Science, 337, 69
Andrews, S. M., Wilner, D. J., Hughes, A. M., Qi, C., & Dullemond, C. P. 2009, ApJ, 700, 1502
Andrews, S. M., Wilner, D. J., Hughes, A. M., Qi, C., & Dullemond, C. P. 2010, ApJ, 723, 1241
Andrews, S. M., Rosenfeld, K. A., Kraus, A. L., & Wilner, D. J. 2013, ApJ, 771, 129
Apai, D. 2013, Astron. Nachr., 334, 57
Baraffe, I., Chabrier, G., Allard, F., & Hauschildt, P. H. 1998, A&A, 337, 403 Barsony, M., Ressler, M. E., & Marsh, K. A. 2005, ApJ, 630, 381
Basu, S., & Vorobyov, E. I. 2012, ApJ, 750, 30
Bontemps, S., André, P., Kaas, A. A., et al. 2001, A&A, 372, 173
Bouy, H., Huélamo, N., Pinte, C., et al. 2008, A&A, 486, 877
Chabrier, G., Baraffe, I., Allard, F., & Hauschildt, P. 2000, ApJ, 542, 464 Comerón, F., Testi, L., & Natta, A. 2010, A&A, 522, A47
Cushing, M. C., Tokunaga, A. T., & Kobayashi, N. 2000, AJ, 119, 3019 Cutri, R. M., Skrutskie, M. F., van Dyk, S., et al. 2003, VizieR Online Data
Catalog, II/246
Evans, II, N. J., Dunham, M. M., Jørgensen, J. K., et al. 2009, ApJS, 181, 321 Geers, V., Scholz, A., Jayawardhana, R., et al. 2011, ApJ, 726, 23
Greene, T. P., & Young, E. T. 1992, ApJ, 395, 516
Griffin, M. J., Abergel, A., Abreu, A., et al. 2010, A&A, 518, L3 Han, C., Jung, Y. K., Udalski, A., et al. 2013, ApJ, submitted
[arXiv:1307.6335]
Harvey, P. M., Henning, T., Liu, Y., et al. 2012a, ApJ, 755, 67 Harvey, P. M., Henning, T., Ménard, F., et al. 2012b, ApJ, 744, L1 Hauschildt, P. H., Allard, F., & Baron, E. 1999, ApJ, 512, 377 Hayashi, C., & Nakano, T. 1963, Prog. Theor. Phys., 30, 460 Hennebelle, P., & Chabrier, G. 2008, ApJ, 684, 395
Hodapp, K. W., Walker, C. H., Reipurth, B., et al. 2004, ApJ, 601, L79 Joergens, V., Pohl, A., Sicilia-Aguilar, A., & Henning, T. 2012, A&A, 543, A151 Kroupa, P., & Bouvier, J. 2003, MNRAS, 346, 369
Kubas, D., Beaulieu, J. P., Bennett, D. P., et al. 2012, A&A, 540, A78 Kumar, S. S. 1963, ApJ, 137, 1121
Luhman, K. L., & Rieke, G. H. 1999, ApJ, 525, 440
Luhman, K. L., Liebert, J., & Rieke, G. H. 1997, ApJ, 489, L165 Luhman, K. L., Stauffer, J. R., Muench, A. A., et al. 2003, ApJ, 593, 1093 Luhman, K. L., Joergens, V., Lada, C., et al. 2007, Protostars and Planets V
(Tucson: University of Arizona Press), 443
McClure, M. K., Furlan, E., Manoj, P., et al. 2010, ApJS, 188, 75 Men’shchikov, A., André, P., Didelon, P., et al. 2012, A&A, 542, A81 Millan-Gabet, R., Malbet, F., Akeson, R., et al. 2007, Protostars and Planets
V(Tucson: University of Arizona Press), 539
Mohanty, S., Jayawardhana, R., & Basri, G. 2005, ApJ, 626, 498 Muench, A. A., Alves, J., Lada, C. J., & Lada, E. A. 2001, ApJ, 558, L51 Muirhead, P. S., Johnson, J. A., Apps, K., et al. 2012, ApJ, 747, 144 Mulders, G. D., & Dominik, C. 2012, A&A, 539, A9
Muži´c, K., Scholz, A., Geers, V., Jayawardhana, R., & Tamura, M. 2012, ApJ, 744, 134
Nakajima, T., Oppenheimer, B. R., Kulkarni, S. R., et al. 1995, Nature, 378, 463 Natta, A., Testi, L., Comerón, F., et al. 2002, A&A, 393, 597
Oppenheimer, B. R., Kulkarni, S. R., Matthews, K., & Nakajima, T. 1995, Science, 270, 1478
Ott, S. 2010, in Astronomical Data Analysis Software and Systems XIX, eds. Y. Mizumoto, K.-I. Morita, & M. Ohishi, ASP Conf. Ser., 434, 139 Padgett, D. L., Rebull, L. M., Stapelfeldt, K. R., et al. 2008, ApJ, 672, 1013 Padoan, P., & Nordlund, Å. 2002, ApJ, 576, 870
Pilbratt, G. L., Riedinger, J. R., Passvogel, T., et al. 2010, A&A, 518, L1 Pinte, C., Ménard, F., Duchêne, G., & Bastien, P. 2006, A&A, 459, 797 Pinte, C., Harries, T. J., Min, M., et al. 2009, A&A, 498, 967 Poglitsch, A., Waelkens, C., Geis, N., et al. 2010, A&A, 518, L2 Pontoppidan, K. M., & Dullemond, C. P. 2005, A&A, 435, 595 Ratzka, T., Köhler, R., & Leinert, C. 2005, A&A, 437, 611
Rebolo, R., Zapatero Osorio, M. R., & Martín, E. L. 1995, Nature, 377, 129 Reipurth, B., & Clarke, C. 2001, AJ, 122, 432
Riaz, B., & Gizis, J. E. 2012, A&A, 548, A54
Ricci, L., Testi, L., Natta, A., Scholz, A., & de Gregorio-Monsalvo, I. 2012, ApJ, 761, L20
Rodríguez-Ledesma, M. V., Mundt, R., & Eislöffel, J. 2009, A&A, 502, 883 Scholz, A., Jayawardhana, R., & Wood, K. 2006, ApJ, 645, 1498
Spezzi, L., Cox, N. L. J., Prusti, T., et al. 2013, A&A, 555, A71 Stamatellos, D., & Whitworth, A. P. 2009, MNRAS, 392, 413
Sz˝ucs, L., Apai, D., Pascucci, I., & Dullemond, C. P. 2010, ApJ, 720, 1668
Testi, L., Natta, A., Oliva, E., et al. 2002, ApJ, 571, L155 Walker, C., Wood, K., Lada, C. J., et al. 2004, MNRAS, 351, 607 Weingartner, J. C., & Draine, B. T. 2001, ApJ, 548, 296
Whelan, E. T., Ray, T. P., Podio, L., Bacciotti, F., & Randich, S. 2009, ApJ, 706, 1054
Wilking, B. A., Greene, T. P., & Meyer, M. R. 1999, AJ, 117, 469
Wilking, B. A., Bontemps, S., Schuler, R. E., Greene, T. P., & André, P. 2001, ApJ, 551, 357
Wilking, B. A., Meyer, M. R., Robinson, J. G., & Greene, T. P. 2005, AJ, 130, 1733
Williams, J. P., & Cieza, L. A. 2011, ARA&A, 49, 67 Young, E. T., Lada, C. J., & Wilking, B. A. 1986, ApJ, 304, L45
C. Alves de Oliveira et al.: Herschel survey of brown dwarf disks in ρ Ophiuchi Appendix A: 1
σ
upper limits for brown dwarfs not detected with Herschel/PACS Table A.1. 1σ upper limits for brown dwarfs in ρ Ophiuchi not detected in Herschel/PACS images.Identifier RA Dec SpT AV Ref. 70 µm 100 µm 160 µm
(mag) (mJy) (mJy) (mJy)
Class II GY92 15 16:26:22.98 −24:28:46.1 M6 10.7 7 <47.5 <324.9 <579.8 GY92 109 16:26:42.89 −24:22:59.1 M6 13.5 7 <10.5 <91.5 <266.1 WL21 16:26:57.33 −24:35:38.7 M6 23.8 7 <120.9 <223.1 <631.4 GY92 350 16:27:46.29 −24:31:41.2 M6 7.0 5 <10.8 <16.8 <121.0 CFHTWIR-Oph 107 16:28:48.71 −24:26:31.8 M6.25 2.3 10 <4.4 <10.0 <46.4 CFHTWIR-Oph 106 16:28:29.93 −24:54:06.4 M6.5 4.9 6 <4.6 <13.1 <73.0 CRBR 2322.3-1143 16:26:23.78 −24:18:31.4 M6.7 8.6 4 <11.2 <38.9 <202.5 CFHTWIR-Oph 16 16:26:18.58 −24:29:51.6 M6.75 18.8 10 <30.3 <50.4 <227.5 GY92 202 16:27:05.98 −24:28:36.3 M7(M6.5) 13.0 2,3 <39.7 <50.2 <227.5 CRBR 2317.3-1925 16:26:18.82 −24:26:10.5 M7.5(M5.5,M7) 10.0 2,3,5 <89.3 <119.9 <449.7 CFHTWIR-Oph 78 16:27:26.23 −24:19:23.1 M7.75 16.4 10 <8.1 <28.1 <117.4 CFHTWIR-Oph 96a 16:27:40.84 −24:29:00.8 M7.75 2.4 10 <23.5 <113.6 <396.3 GY92 64 16:26:32.53 −24:26:35.4 M8 11.0 2 <35.5 <379.7 <2414.2 CFHTWIR-Oph 34 16:26:39.92 −24:22:33.6 M8.25 9.7 6 <78.5 <63.5 <270.2 GY92 11 16:26:22.27 −24:24:07.1 M8.5(M6.5,M8.5) 8.0 8,2,5 <10.4 <50.1 <361.5 GY92 141 16:26:51.28 −24:32:42.0 M8.5(M8) 0.7 1,4 <8.6 <36.2 <133.0 CFHTWIR-Oph 98 16:27:44.20 −23:58:52.4 M9.75 3.0 10 <5.9 <13.0 <46.3 CFHTWIR-Oph 90 16:27:36.59 −24:51:36.1 L0 2.4 10 <4.5 <12.8 <48.7 Class III GY92 450 16:28:03.56 −24:34:38.6 M6 20.5 7 <4.4 <14.7 <93.6 CFHTWIR-Oph 4 16:25:32.41 −24:34:05.2 M6.5 2.5 6 <10.9 <29.8 <67.2 CFHTWIR-Oph 101 16:27:47.25 −24:46:45.9 M7 25.8 10 <4.9 <11.9 <102.9 CFHTWIR-Oph 57 16:27:04.02 −24:02:46.9 M7.25 6.1 6 <7.8 <18.4 <66.8 CFHTWIR-Oph 47 16:26:52.26 −24:01:46.8 M7.5 5.6 6 <6.8 <19.8 <68.4 CFHTWIR-Oph 77 16:27:25.64 −24:37:28.6 M9.75 10.0 10 <6.1 <22.1 <148.7 CFHTWIR-Oph 103 16:28:10.46 −24:24:20.4 L0 7.5 10 <5.5 <13.8 <116.1
No SED classification available
SONYC-RhoOph-6 16:27:05.93 −24:18:40.2 M7 8.0 11 <8.5 <28.4 <133.8 SONYC-RhoOph-1 16:26:56.33 −24:42:37.8 M9 5.0 9 <5.5 <16.5 <73.1 CFHTWIR-Oph 9 16:26:03.28 −24:30:25.9 L0 6.6 10 <36.9 <28.5 <476.0 CFHTWIR-Oph 18 16:26:19.41 −24:27:43.9 L0 7.8 10 <11.7 <56.1 <398.9 CFHTWIR-Oph 100 16:27:46.54 −24:05:59.2 L0 8.0 10 <5.5 <15.2 <58.5 CFHTWIR-Oph 33 16:26:39.69 −24:22:06.2 L4 3.6 10 <165.2 <34.4 <285.3 Pre-brown dwarf Oph B-11 16:27:13.96 −24:28:29.3 ∼30 12 <15.4 <32.0 <63.1
Notes. (a) Harvey et al. (2012b) measured from their Herschel/PACS “mini-scan-map” of this object F
ν (70 µm) = 5 ± 20 mJy and
Fν(160 µm)= 130 ± 200 mJy. These values are consistent with our upper limits.
References. (1)Luhman et al.(1997); (2)Wilking et al.(1999); (3)Luhman & Rieke(1999); (4)Cushing et al.(2000); (5)Natta et al.(2002);
(6)Alves de Oliveira et al.(2010); (7)McClure et al.(2010); (8)Comerón et al.(2010); (9)Geers et al.(2011); (10)Alves de Oliveira et al.
(2012); (11)Muži´c et al.(2012); (12)André et al.(2012).
Appendix B: Near-IR colour composite of GY92 344 16h27m42.00s 44.00s 46.00s 48.00s 50.00s RA (J2000) 40.0" 20.0" 45'00.0" 40.0" 20.0" -24°44'00.0" Dec (J2000)