HAL Id: hal-00453259
https://hal.archives-ouvertes.fr/hal-00453259
Preprint submitted on 4 Feb 2010
HAL is a multi-disciplinary open access archive for the deposit and dissemination of sci-entific research documents, whether they are pub-lished or not. The documents may come from teaching and research institutions in France or abroad, or from public or private research centers.
L’archive ouverte pluridisciplinaire HAL, est destinée au dépôt et à la diffusion de documents scientifiques de niveau recherche, publiés ou non, émanant des établissements d’enseignement et de recherche français ou étrangers, des laboratoires publics ou privés.
MRI Superresolution Using Self Similarity and Image
Priors
Jose Vicente Manjon, Pierrick Coupé, Antoni Buades, D. Louis Collins,
Montserrat Robles
To cite this version:
Jose Vicente Manjon, Pierrick Coupé, Antoni Buades, D. Louis Collins, Montserrat Robles. MRI Superresolution Using Self Similarity and Image Priors. 2010. �hal-00453259�
MRI Superresolution Using
Self Similarity and Image Priors
José V. Manjóna, Pierrick Coupéb, Antonio Buadesc,
D. Louis Collinsb, Montserrat Roblesa
a Instituto de Aplicaciones de las Tecnologías de la Información y de las
Comunicaciones Avanzadas (ITACA), Universidad Politécnica de Valencia, Camino de Vera s/n, 46022 Valencia, Spain.
b McConnell Brain Imaging Centre, Montreal Neurological Institute, McGill
University, Montreal, Canada.
c Université Paris Descartes, 45 rue des Saints Pères, 75270 Paris Cedex 06,
France.
*Corresponding author. José V. Manjón
Instituto de Aplicaciones de las Tecnologías de la Información y de las Comunicaciones Avanzadas (ITACA), Universidad Politécnica de Valencia, Camino de Vera s/n, 46022 Valencia, Spain.
Tel.: (+34) 96 387 70 00 Ext. 75275 Fax: (+34) 96 387 90 09. E-mail address: [email protected]
Abstract
In Magnetic Resonance Imaging low-resolution images are routinely interpolated to decrease voxel size and improve apparent resolution. However, classical interpolation techniques are not able to recover the high frequency information lost during the acquisition process. In the present paper a new superresolution method is proposed to recover such information using coplanar high resolution images. The proposed methodology takes benefit from the fact that in typical clinical settings both high and low-resolution images of different types are taken from the same subject. These available high resolution images can be used to improve effectively the resolution of other coplanar lower resolution images. Experiments on synthetic and real data are supplied to show the effectiveness of the proposed approach. A comparison with classical interpolation techniques is presented to demonstrate the improved performance of the proposed methodology over previous State-of-the-art methods.
1. Introduction
In Magnetic Resonance Imaging (MRI), data is acquired with a finite resolution that is limited by several factors like the SNR, hardware, time limitations or patient´s comfort. In typical clinical settings several types of images are obtained with different voxel resolutions. Traditionally, in-plane resolution has been higher than resolution in the slice direction yielding non isotropic voxel sizes.
In many applications such as segmentation or registration, data has to be upsampled to decrease its voxel size to make it compatible with a higher resolution dataset. In such cases, interpolation techniques (Thévenaz et al., 2000; Lehmann et al., 1999) have been traditionally applied. Techniques like linear interpolation or spline-based methods have been used extensively in the past to decrease voxel size and increase apparent data resolution. However, such techniques invent new points assuming that the existing ones (in the low resolution (LR) image) have the same value in the high resolution (HR) images which is only valid within homogeneous regions. As a result interpolated images are typically blurred versions of the corresponding high frequency reference images.
A better approach to increase effectively the resolution of the reconstructed data is to use SuperResolution (SR) techniques (Carmi et al., 2006). In MRI, superresolution techniques have been previously applied to increase image resolution in functional MRI (fMRI) (Kornprobst et al, 2003)and Diffusion Tensor
Imaging (DTI) studies (Peled and Yeshurun, 2001). Unfortunately, most of such techniques are based on the acquisition of multiple low-resolution images with small shifts; a process which is time consuming and therefore not adequate for typical clinical settings.
Fortunately, if HR images of the same subject within the same or other image modality are available, it is possible to recover some of the lost high frequency information within the LR image. This idea was recently applied in a method proposed by Rousseau et al. (2008) where a low-resolution volume is reconstructed using information of a HR reference volume while taking into account an expected degradation model. In Rousseau´s method the HR data is used to regularize a deconvolution based reconstruction using a Non-Local Means denoising method (Buades et al., 2005). The method proposed in this paper is related to Rousseau´s work in the sense that we also use HR data to constrain the reconstruction process but our method is based on a totally different strategy to compute the image reconstruction.
2. Material and methods
Image voxels in LR data y can be related to the corresponding underlying HR voxels x through a simple degradation model.
where D is a decimation operator (defined as taking each Lth value starting from zero in each dimension), H is the convolution matrix , x is the underlying HR data and n is a random Gaussian noise. In MRI H can be roughly approximated by a 3D boxcar function since the values on LR data can be well modeled as an average of the corresponding HR voxel values. Therefore, the value yj of any voxel in the LR image can be expressed as follows:
(2)
where the value of the LR voxel yj is the average of the corresponding N xi
voxels in the HR image plus some additive noise from the measurement process. While noise in MRI is Rician, the noise here can be approximated as Gaussian distributed in the imaged object for typical clinical SNR values.
Therefore, the aim of any superresolution method is to find the xi values from
the yj values, a very ill posed problem as there are infinite xi values that meet
such a condition. A common approach to solve this problem is to minimize a merit function such as:
(3)
Due to the non-uniqueness of the solution for this problem, some extra information is needed to constrain the possible solutions of equation 3 to obtain
plausible results. This has been traditionally done using smoothness constrains which are based on the assumption of smoothness of the reconstructed data.
(4)
where R(x) is a regularization term and λ is a weight that balances the contribution of smoothness and data fidelity terms. However, such smoothness assumption penalizes high frequency content of the reconstructed image that is precisely what we want to obtain.
In contrast to this optimization approaches, we propose to estimate using a
direct iterative method using coplanar HR data to control the reconstruction process.
Proposed method
The proposed method in this paper is not based on the smoothness assumption but on the assumption that if a registered HR image/volume of the same subject from the same or other modality is available then anatomical information from this HR data can be used to recover additional structure in the superresolution reconstructed LR data. Furthermore, if noise present in the LR data is minimized by applying a specific filter, we can impose as an additional constraint the fact that the down-sampled version of the reconstructed data has to be exactly the same as the original LR data. This constraint has been
previously applied in the SR context and referred as sub-sampling consistency (Banerjee and Jawahar, 2008).
(5)
To apply the proposed method, two preprocessing steps have to be accomplished:
• Data registration: In order to extrapolate voxel local similarities from the
HR reference data to the LR reconstructed data both reference and LR data have to be in the same geometrical space.
• Image denoising: Due to the presence of noise, equation 5 cannot be
used directly. To simplify the problem, the HR and LR data are first denoised using a recently proposed robust denoising method for 3D MR images (Coupé et al., 2008) based in the well-known Non-local Means filter early proposed by Buades et al. (2005). It has been demonstrated that such filter (i.e., the BNLM3D filter) is able to remove noise effectively while minimally affecting the image structure.
The proposed method uses as input data a HR reference data and a pre-interpolated version of the LR data. It is an iterative procedure based on two steps that corresponds to the two assumptions used which are:
1) Regularization: Locally, similar voxels in the HR data tends to be similar in the reconstructed LR data. Therefore, regularizing an interpolated version of the LR data using the reference HR data similarities will enforce this condition. This is the key contribution of the proposed procedure. First, the LR data is interpolated in order to obtain a volume with the same voxel size as the HR reference data. To Regularize the interpolated data a 3D Neighborhood filter (Yaroslavsky, 1985) can be used, however the weights are calculated using the reference HR data information instead of the LR data.
(6)
where z is the HR reference data, p and q are data indexes, xt is the current
reconstructed data at iteration t, h controls the intensity similarity and Cp is the
normalization factor.
This approach gives very good results if LR and HR data are in perfect geometric match but it is very sensible to misregistration between LR and HR data. A more robust approach can be used if using also information from the LR data to constrain the process.
(7)
here, is a 3D window surrounding voxel i at iteration t and k is parameter
controlling the influence of the LR data in the reconstruction process.
2) Mean correction: Since the down-sampled version of the reconstructed LR data must be equal to the original LR data, the mean value of the reconstructed HR voxels need to be corrected to fit the value of the original LR voxel. This is accomplished by adding a corresponding offset to each reconstructed voxel.
(8)
where NN is the Nearest neighbor interpolation operation.
These two steps are iteratively repeated, using the current reconstructed data in the next regularization step (instead of the initial interpolated data) until no significant difference is found between two consecutive iterations (mean absolute difference between two iterations is inferior to a given tolerance, tol). A block diagram of the proposed method can be observed in figure 1.
3. Experiments and results
3.1. Experimental data
To validate the proposed method a synthetic dataset was used. High resolution T1 and T2 data with both normal and pathology (multiple sclerosis) from the publicly available Brainweb database was used (Cocosco et al.,1997). The HR T1 and T2 volumes had 181x217x180 voxels with a resolution of 1 mm3). The
Peak Signal to Noise Ratio (PSNR) measure was used to compare the reconstructed data and the original HR data. All the experiments were performed using Matlab 7.4 (Mathwork inc.). The source code of the proposed method can be downloaded from http:/site/webpage.html to ease the reproducibility of this work.
3.2. Implementation details
As the proposed methodology can be implemented in a number of different manners we will discuss here how these different alternatives were selected prior the comparison of the proposed methodology with other reconstruction methods.
Initial interpolation
To find out how the initial interpolation affects the reconstruction results of the proposed method, different interpolation methods (Nearest Neighbor, Trilinear, Cubic and B-spline interpolation) were compared for the initial step. Results can
be seen in left of Fig. 2. As can be noted, the proposed method obtained nearly the same stable solution in all the cases independently of the initial interpolation method used in approximately the same number of iterations. The only differences found were starting PSNR values, as expected. Thus, a Nearest Neighbor interpolation seems to be the better option because it is the simpler and it hast the fastest implementation.
Size of search area
The proposed methodology was applied with different search area sizes and the results were analyzed (see Fig. 2). From this experiment, we found that a good option for the size of the search area Ω was 7x7x7 voxels (3D window radius=3). Increasing the search area beyond this size provides only a slight improvement while considerably increasing the computation time.
Value of h and k parameters
Finally, the value of h parameter plays a major role in the reconstruction process, so its correct adjustment is very important. In the present method, an iterative decremental assignment of its value is proposed. This approach enables a stable coarse to fine reconstruction in a similar manner as done for Non local demosaicing (Buades et al, 2007). In this approach, the use of high values of h produces the averaging of different parts of the image while small values directly copy similar values. For 8 bit quantization input data, decreasing values of h (32,16,8,4 and 2) were used in all experiments. Each value is used
once and then decreased until the last h value (2 in our case) and then the process is iterated with h=2 until the mean absolute value of the difference between two consecutive reconstructions falls below a given tolerance. For other quantization levels h values can be linearly adjusted.
Regarding the k parameter, if this parameter is too small the method will be very robust to misregistration but few improvement in the reconstruction will be achieved since almost not information from HR data will be used. In contrast, if
k is too high only HR information will be used which will lead in a good
reconstruction when data is perfectly registered but the robustness of the method can be seriously affected when LR and HR data is geometrically incoherent. We have found experimentally that a factor k=256 allows to obtain good reconstructions while maintaining the robustness of the method.
Figure 2. Left: Effect of initial interpolation method in the proposed method (All methods
compared reached a similar stable result after 11 iterations). Right: PSNR values of the proposed method as a function of the radius of the search area. As can be noted the no significant improvement is found beyond that using a radius equal to 3.
Computational complexity
Since the proposed approach is an iterative process, the computational burden of the method is high (being the filtering step the heaviest part). To reduce the processing time, we have implemented the proposed method using symmetric weight computation on the filtering step which reduces the computational burden a factor 2. Besides, a multithreading implementation was used which allowed to reduce the processing time another factor 4 in the Quad Core 2.4 GHz Pentium machine used in the experiments. This lets an average time of around 8 minutes per iteration. This makes the required time for reconstructing a typical MR volume to be approximately 1 hour. Further time reduction can be achieved by processing only object voxels avoiding useless computations at background voxels.
To summarize, in all the experiments the search area Ω in the HR volume was set to have a radius equal to 3 (i.e. a 3D region of 7x7x7 voxels) and h = [32, 16, 8, 4, 2]. The parameter k was set to 256 and the tolerance was set to 0.01 (0.005% of the range).
3.3. Comparison on Normal Brain anatomy
The first comparison consisted in reconstructing downsampled versions of the Brainweb HR T2 volume. This HR volume was downsampled in the z direction to have different slice thickness (2, 3, 5, 7 and 9 mm). The proposed method
used T1 data (1 mm3) as HR reference data. The resulting reconstructed data
was compared to the standard NN and B-Spline interpolation as implemented on MATLAB 7.4. In addition, the authors of the method recently proposed in Rousseau et al (2008) provided results for the 3 mm case for comparison. In these experiments, no noise was added to simplify the analysis of the results. It has to be also noted that the proposed method is always applied after a denoising step so zero noise condition can be nearly met. The results can be observed in Table 1 and Fig. 3. As can be noticed the proposed method drastically improved the results in all the cases.
Table 1. PSNR values (larger values are better) of the different methods compared for several
slices thicknesses for the normal brain anatomy case.
Slice Thickness (mm) 2 3 5 7 9
NN 25.13 21.91 19.04 17.68 16.70
B-Spline 28.09 23.77 20.20 18.44 17.18
Rousseau - 26.71 - -
-Proposed 40.65 37.64 34.37 32.24 30.64
3.4. Comparison on Pathological Brain anatomy (Multiple Sclerosis)
In this case, the same experiment was repeated as above, but this time using the MS T2 HR and MS T1 HR phantoms also available from the Brainweb website. The proposed method was also compared to the standard NN and B-Spline interpolation. Again, Rousseau´s method results for 3 mm slice thickness were supplied by the authors. The results can be observed in Table 2. In Fig. 4, a visual comparison of the results for 3 mm slice thickness can be done. Again, the proposed method drastically improved the results in all the cases.
Table 2. PSNR values of the different methods compared for several slices thicknesses for the
multiple sclerosis anatomy case.
Slice Thickness (mm) 2 3 5 7 9
NN 26.21 22.99 20.09 18.72 17.73
B-Spline 29.33 24.99 21.29 19.59 18.33
Rousseau - 27.33 - -
-Proposed 41.04 38.08 34.81 32.64 30.96
We were curious about the effect of the proposed method in the MS lesions, since lesions appearing as T2 hyperintensities are not often clearly visible in T1. We observed that MS lesions were well reconstructed, even though the T1 regularization information did not help much to recover such structures. The appearance of the lesions in the reconstructed images is due to the mean correction step which ensures that the reconstructed data maintains correct intensity levels in the reconstructed data. In Fig. 5, a transverse slice with MS lesions is displayed for the original and reconstructed volumes. The differences of the different reconstruction methods are clearly visible.
Figure 3. A parasagittal slice for the normal anatomy case. From top to bottom, results with
different slice thicknesses (2,3,5,7,9 mm) and from left to right, the original HR T2 data, the NN reconstruction, the B-Spline reconstruction and the proposed method.
Figure 4. From top to bottom: Original Axial, Saggital and Coronal sections of the HR T2 data,
NN interpolation, B-Spline interpolation, Rousseau's method and proposed reconstruction. Results for 3 mm slice thickness reconstruction. Note that MS lesions are better reconstructed using the proposed method.
Figure 5. Example of reconstruction of a transverse slice with MS lesions. Top-left: Original HR
data, Top-right: B-Spline interpolation. Bottom-left: Rousseau´s reconstruction. Bottom-right: Proposed reconstruction.
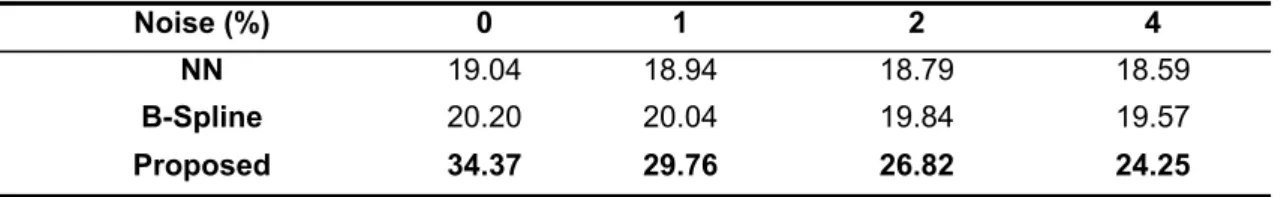
3.5. Noise sensitivity
It is clear that the zero noise case is an idealization of the real MR image conditions. To address this issue, another experiment was performed on the Brainweb data, but this time adding noise. A LR T2 volume of voxel resolution 1x1x5 mm was reconstructed to 1 mm3. Both HR reference T1 and LR T2 data
were corrupted with several levels of Gaussian noise (0, 1, 2, and 4% of the maximum intensity). In this case, the reconstruction was performed after denoising the noisy data using the BNLM3D filter. To assure a fair comparison, NN and B-Spline interpolation methods used also the denoised data to compute the HR T2 volume. Qualitative results are shown in Fig. 6. Quantitative results are displayed in Table 3.
Table 3. PSNR values of the different methods compared for several noise levels.
Noise (%) 0 1 2 4
NN 19.04 18.94 18.79 18.59
B-Spline 20.20 20.04 19.84 19.57
Proposed 34.37 29.76 26.82 24.25
Again, the proposed method outperformed the other methods in all noise levels. One can notice that performance of the proposed method decreases with the noise amplitude as the denoising process inevitably erases some high frequency information in the images. It is also important note that in this experiment we have added the same level of noise to LR and HR data as it is supposed to be machine dependent, but in many cases HR data are acquired with 3D acquisitions and therefore can be less noisy than a LR multislice acquisition (for example a typical T1 volume compared to DWI). In such cases,
the reconstruction of the LR data is highly improved due to the fact that the HR data does maintains its high frequency information.
Figure 6. From Top to Bottom, 0 ,1, 2 and 4% noise case. From left to right, HR T2 data, LR
noisy T2 data, LR denoised T2 data, B-spline interpolation and proposed reconstruction.
3.6. Registration sensitivity
As it has been pointed out previously, the accuracy of the proposed method highly depends on the correct registration of the LR and HR images. To evaluate how the misalignment affects the accuracy of the proposed method, the HR T1-w reference volume was shifted in the 3 directions (x, y and z). In this experiment, a 1x1x5 mm voxel resolution LR T2-w volume was
reconstructed to 1 mm3 voxel resolution using as reference a shifted HR T1
volume. Results are showed on table 4. Differences in the results of x and y axis compared to z axis are due the axial acquisition of the images.
Table 4. PSNR enhancement values of the proposed referred to B-Spline method in function of misregistration.
Shift (mm) 0 1 2 3
x-axis 13.92 5.35 1.61 0.47
y-axis 13.92 5.61 1.83 0.37
z-axis 13.92 2.98 -0.42 -1.67
From this results, it can be concluded that the proposed method is able to tolerate a small misregistration (up to 1 or 2 mm) while maintaining an improved performance over the reference B-Spline interpolation mainly due to the inclusion of information of LR data during reconstruction. This is important since in real world conditions small misalignments can be present after registration. However, most of current linear registration methods are able to obtain a sub-millimeter accuracy which enables the application of the proposed methodology (Hajnal et al.,2001; Vandermeulen et al,1999).
3.7. Real clinical data
To evaluate quantitatively and qualitatively the proposed approach on real clinical data, three real datasets were used. In the three cases, the 3D search region was set to 7x7x7 voxels, the h values used were consecutively (12%, 6%, 3%, 1.5 % and 0.7% of the image range) of the HR image range and the tolerance was set to the 0.0005% of the same range.
The first case consisted in a dual PD-w/T2-w study. In this way, we were sure that PD-w and T2-w data were perfectly registered as they are acquired at the same time. This dataset was obtained with a PD-w/T2-w volumetric sequence (256x256x56 voxels with a voxels resolution of 0.94x0.94x3 mm) in a Philips Gyroscan 1.5 Tesla scanner (The Netherlands). In this case, the T2 weighted volume was downsampled to a voxel resolution of 0.94x0.94x6 mm (i.e. a reduction factor 2 in z direction). Both, reference PD-w and T2-w volumes were filtered using the BNLM3D method and PSNR values were computed using as reference the denoised version of the HR T2-w volume. The NN interpolation method obtained a PSNR equal to 27.68 dB, the B-Spline method 28.90 dB and the proposed method 32.51 dB. In Fig. 7, the different results can be visually compared. One can see that the reconstruction using the proposed approach not only obtained a better PSNR value than the other methods but also showed a better anatomical content.
Figure 7. Comparison of real clinical data experiment. Top-Left: HR T2 volume. Top-Right:
downsampled version of the HR T2 volume. Bottom-Left: B-spline reconstruction. Bottom-right: Reconstruction using the proposed method. Note that the proposed methodology yields a significantly less blurred reconstruction than other methods compared. A close up of the cerebellum area clearly shows the improved reconstruction.
The second dataset consisted in a HR T1-w (170x256x256 voxels) and a LR T2-w (85x256x256 voxels) images acquired on a 3T Siemens TimeTrio (Erlangen, Germany) machine. The resolution of the T1-w data was 1 mm3
while the resolution of the T2-w data was 2x1x1 mm3. In this case, the LR data
shows the reconstruction results using the compared methods. As in this case, we had not HR to compare the results were judged visually. Such qualitative analysis showed that the reconstruction using the proposed approach was less blurry than B-Spline interpolation. To apply the proposed method the LR and HR were first filtered using the BMNLM3D filter and then the LR T2-w data was registered to the HR T1-w data using SPM5 software (Friston et al., 1999) with a 3D rigid transformation.
Figure 8. Comparison of real clinical data experiment. Top-Left: HR T1 volume. Top-Right: LR
proposed method. In the each case a close-up is presented to better show how the proposed method provides a more consistent and less blurry reconstruction.
Finally, the third dataset consisted of a pathological dataset containing a brain tumor. In this case, a HR T1-w volume (224x256x174 voxels) and a LR FLAIR-w volume (224x256x29 voxels) FLAIR-were used. The resolution of the T1-FLAIR-w data FLAIR-was 1 mm3 while the resolution of the FLAIR data was 1x1x6 mm3. This dataset
(named CEREBRIX) was downloaded from a public MR DICOM data repository (http://pubimage.hcuge.ch:8080/). Again, the LR data was upsampled to 1 mm3
using the B-Spline interpolation and the proposed method and the results were qualitatively evaluated. In Fig. 9, the reconstruction results are compared to B-Spline reconstruction. Again, the visual inspection of the results showed a less blurry reconstruction when using our proposed approach showing consistent anatomical information. To apply the proposed method, the data was filtered using the BNLM3D filter and the LR FLAIR data was registered to the HR T1 data using also the SPM5 software with a 3D rigid transformation.
Figure 9. Comparison of real clinical data experiment. Top-Left: HR T1 data. Top-Right: LR
FLAIR volume. Bottom-left: B-Spline reconstruction. Bottom-right: Reconstruction using the proposed method. In the each case a close-up of the coronal slice is presented to better show how the proposed method provides a less blurry reconstruction.
4. Conclusion
We have presented a new superresolution method that enables recovery of HR data information from LR data when a coplanar HR data volume of the same subject from the same or other modality is available. The proposed method has been validated, using synthetic and real data. Our experiments demonstrated that the proposed method outperforms classical interpolation methods.
Experiments presented here show how images with highly anisotropic voxels can be reconstructed to have isotropic voxels (e.g. 1x1x9 mm3 to 1 mm3) when
HR data of such resolution is available. However, it is worth to note here that the reconstruction can be performed in any dimension when suitable data is available (e.g. 3x3x3 mm3 to 1x1x1 mm3).
The iterative approach here described relies on a correct registration of LR and HR data to assure that HR similarities can be extrapolated to the reconstruction of LR data. Moreover, a proper denoising step is mandatory prior to the reconstruction process. In this sense, we have used a BNLM3D method that performed very well in all cases.
The use of a 3D boxcar function as convolution matrix is supported by the concept of partial volume on MRI where voxel intensity can be modeled as a linear combination of the voxel intensities of the adjacent HR data. Our experiments on real data seems to confirm this assumption yielding plausible results when using this model.
It is important to note that no special hardware nor specific imaging sequences are needed to apply the proposed approach. The proposed methodology can be applied to increase the resolution of multimodal studies after data registration. Other specially interesting field could be the application of the proposed technique to artificially increase the resolution of fMRI studies where typically a HR reference volume is acquired with LR EPI data.
Further work has to be addressed to assess the value of the proposed methodology on clinical and research frameworks.
Acknowledgments
The authors want to thank Dr. Vladimir Fonov for supplying some of the MR images used in this paper. We are also grateful to Dr. Rousseau for providing the results of his method for the comparisons and for his useful comments. This work has been partially supported by the Spanish Health Institute Carlos III through the RETICS Combiomed RD07/0067/2001, the Ministerio de Ciencia e Innovación though the grant TIN2008-04752 and by the Canadian grant Industry Cda (CECR)-Gevas-OE016.
References
Buades, A., Coll, B., Morel, J.M., 2005. A non local algorithm for image denoising. IEEE Int. Conf. on Computer Vision and Pattern Recognition 2, 60-65.
Buades, A., Coll, B., Morel, J.M., Sbert, C., 2008. Non local demosaicing. International Workshop on Local and Non-Local Approximation in Image Processing.
Carmi, E., Liu, S., Alon, N., Fiat, A., Fiat, D. 2006. Resolution enhancement in MRI. Magnetic Resonance Imaging, 24, 133-154.
Cocosco, C.A., Kollokian, V., Kwan, R.K.-S,.Evans, A.C. 1997. BrainWeb: Online Interface to a 3D MRI Simulated Brain Database. Proceedings of 3-rd International Conference on Functional Mapping of the Human Brain, 5(4).
Collins D.L., Zijdenbos A.P., Kollokian V., Sled J.G., Kabani N.J., Holmes C.J., Evans A.C.. 1998. Design and construction of a realistic digital brain phantom. IEEE Transactions on Medical Imaging, 17(3):463–468.
Coupé, P., Yger, P., Prima, S., Hellier, P., Kervrann, C., Barillot. C. 2008. An Optimized Blockwise Non Local Means Denoising Filter for 3D Magnetic Resonance Images. IEEE Transactions on Medical Imaging, 27(4), 425-441.
Hajnal J., Hill D. L. G., and Hawkes, D. J. 2001. Medical Image Registration. CRC Press, London.
Kornprobst P., Peeters R., Nikolova M., Deriche R. , Van Hecke M. Ng and P. 2003. A Superresolution Framework for fMRI Sequences and Its Impact on Resulting Activation Maps. MICCAI 2003, 2879:117-125.
Lehmann, T. M., Gonner, C. and Spitzer, K. 1999. Survey: Interpolation Methods in Medical Image Processing. IEEE Transaction on Medical imaging, 18(11), 1049-1075.
Rousseau, F. 2008. Brain Hallucination. European Conference on Computer Vision (ECCV), Springer, LNCS Series.
Sharon Peled and Yehezkel Yeshurun. 2001. Superresolution in MRI: Application to Human White Matter Fiber Tract Visualization by Diffusion Tensor Imaging. Magnetic Resonance in Medicine, 45:29-35.
Thévenaz, P., Blu, T., Unser, M. 2000. Interpolation Revisited. IEEE Transactions on Medical Imaging, 19(7), 739-758.
Vandermeulen D., Maes F., and Suetens P. 1999. Comparative evaluation of multiresolution optimization strategies for multimodality image registration by maximization of mutual information. Medical Image Analysis, 3(4):373.386.
Yaroslavsky L. P. 1985. Digital Picture Processing. An Introduction, Springer-Verlag, Berlin.