Publisher’s version / Version de l'éditeur:
Vous avez des questions? Nous pouvons vous aider. Pour communiquer directement avec un auteur, consultez la
première page de la revue dans laquelle son article a été publié afin de trouver ses coordonnées. Si vous n’arrivez pas à les repérer, communiquez avec nous à [email protected].
Questions? Contact the NRC Publications Archive team at
[email protected]. If you wish to email the authors directly, please see the first page of the publication for their contact information.
https://publications-cnrc.canada.ca/fra/droits
L’accès à ce site Web et l’utilisation de son contenu sont assujettis aux conditions présentées dans le site
LISEZ CES CONDITIONS ATTENTIVEMENT AVANT D’UTILISER CE SITE WEB.
Research Report (National Research Council of Canada. Institute for Research in
Construction), 2004-04-01
READ THESE TERMS AND CONDITIONS CAREFULLY BEFORE USING THIS WEBSITE.
https://nrc-publications.canada.ca/eng/copyright
NRC Publications Archive Record / Notice des Archives des publications du CNRC :
https://nrc-publications.canada.ca/eng/view/object/?id=eb538b9e-774c-4e5c-85ca-e885362a05b0 https://publications-cnrc.canada.ca/fra/voir/objet/?id=eb538b9e-774c-4e5c-85ca-e885362a05b0
NRC Publications Archive
Archives des publications du CNRC
For the publisher’s version, please access the DOI link below./ Pour consulter la version de l’éditeur, utilisez le lien DOI ci-dessous.
https://doi.org/10.4224/20377434
Access and use of this website and the material on it are subject to the Terms and Conditions set forth at
Human Behavior Study, Cook County Administration Building Fire,
October 17, 2003 Chicago, IL
Human Behavior Study
Cook County Administration Building Fire
October 17, 2003 – Chicago, IL
Research Report No. 181
Authors: Guylène
Proulx,
Ph.D.
Irene M.A. Reid
Neil R. Cavan
Published by
Institute for Research in Construction National Research Council Canada Ottawa, Canada
HUMAN BEHAVIOR STUDY
COOK COUNTY ADMINISTRATION BUILDING FIRE OCTOBER 17, 2003 CHICAGO IL
by
Guylène Proulx, Irene M.A. Reid and Neil R. Cavan Fire Research Program
Institute for Research in Construction National Research Council Canada
Client Report B4536 for
James Lee Witt Associates
TABLE OF CONTENTS TABLE OF CONTENTS ... ii LIST OF FIGURES...iii LIST OF TABLES ... iv EXECUTIVE SUMMARY... v ABOUT THE NRC ... vi 1.0 INTRODUCTION ... 1 2.0 STUDY OBJECTIVES ... 1
3.0 THE FIRE INCIDENT ... 2
4.0 BUILDING AND OCCUPANT DESCRIPTION ... 4
5.0 RESEARCH STRATEGY ... 5
6.0 SURVEY ANALYSIS ... 7
6.1 Respondent Distribution... 7
6.2 Past Experience and Training... 8
6.2.1 Experience in the Building... 8
6.2.2 Fire Drills and Fire Safety Training... 11
6.2.3 Aware That the Stairwell Doors Would Lock ... 13
6.2.4 Received Fire Safety Training ... 15
6.2.5 Description of the Evacuation Procedure ... 16
6.3 Respondents on Location at the Time of the Fire ... 19
6.4 Initial Awareness... 19
6.4.1 Respondent Location ... 19
6.4.2 Cues Received ... 20
6.4.3 Activity at Time of Initial Awareness... 25
6.4.4 Floor Conditions ... 25
6.5 Pre-Evacuation Movement... 26
6.5.1 Attempt to Obtain Information ... 26
6.5.2 Alarm and P.A. Messages... 27
6.5.3 Motivation to Start Evacuation ... 30
6.5.4 Time to Start Evacuation ... 32
6.5.5 Social Interactions ... 33 6.5.6 Belongings Gathered ... 34 6.6 Evacuation Movement ... 35 6.6.1 Elevator ... 35 6.6.2 Stairwell... 38 6.6.3 Phone Calls... 43 6.6.4 People Encountered... 43 6.6.5 Travel Time ... 43
6.7 Total Evacuation Time ... 46
6.8 Rescue Personnel... 46
6.9 Help Received and Obstruction ... 47
7.0 CONCLUSIONS ... 48
8.0 RECOMMENDATIONS ... 51
8.1 Stairwell ... 51
8.2 P.A. Messages... 51
8.3 Occupant Evacuation and Firefighting Activity... 52
8.4 Building Emergency Action Plan... 52
8.5 Occupant Training and Education... 53
10.0 APPENDICES ... 55
10.1 Appendix 1 – Author’s Information... 55
10.2 Appendix 2 - Floor Plan for 12th Floor ... 67
10.3 Appendix 3 - Lobby Floor Plan... 68
10.4 Appendix 4 - Survey... 69
10.5 Appendix 5 - Code Book ... 76
LIST OF FIGURES Figure 1- Photograph of Cook County Administration Building... 4
Figure 2 - Division of the Building into Levels ... 8
Figure 3 - Number of Times Alarm Heard in Past Year ... 9
Figure 4 - Frequency of P.A. Messages... 10
Figure 5 - Clarity of P.A. Messages ... 10
Figure 6 - Number of Drills ... 11
Figure 7 - Evacuation Procedure During Drill... 12
Figure 8 - Type of Impairment... 12
Figure 9 - Respondents Who Had Used the Stairs Before ... 13
Figure 10 - Photograph of Sign on all Stairwell Doors ... 14
Figure 11 - Respondents Not Aware That Stairwell Doors Would Lock... 14
Figure 12 - Training Received by Respondents... 15
Figure 13 - How Often Trained... 16
Figure 14 - Division of the Building into Levels ... 20
Figure 15 - Initial Awareness... 20
Figure 16 - Time of Initial Awareness ... 22
Figure 17 - Time of Initial Awareness Compared to Method of Initial Awareness... 22
Figure 18 - Initial Interpretation of Event ... 23
Figure 19 - Initial Assessment of Situation Seriousness ... 23
Figure 20 - Initial Feelings about the Situation... 24
Figure 21 - Seriousness of the Situation by Floor Level ... 24
Figure 22 - Activities at the Time of Initial Awareness ... 25
Figure 23 - Respondents Smelling Smoke by Floor Level ... 26
Figure 24 - Respondents Who Saw Smoke by Floor Level ... 26
Figure 25 - Heard Messages by Floor Level ... 28
Figure 26 - 1st Message Heard... 28
Figure 27 - 2nd Message Heard ... 29
Figure 28 - Compliance of Respondents Who Heard ‘Evacuate 12th Floor’... 30
Figure 29 - Motivation to Evacuate ... 31
Figure 30 - Motivation to Evacuate by Floor Level... 32
Figure 31 - Pre-Movement Time Reported ... 33
Figure 32 - Social Interactions when Starting Evacuation... 34
Figure 33 - Who Told Respondent to Leave ... 34
Figure 34 - Photograph of Elevator Sign... 35
Figure 35 - Attempts to Use the Elevator and Motivation to Evacuate... 36
Figure 36 - Attempts to Use the Elevator Based on Activities during Initial Awareness . 37 Figure 37 - Attempts to Use the Elevator by Floor Level ... 37
Figure 38 - Choice of Stairwell ... 38
Figure 39 - Reason for Choice of Stairwell ... 39
Figure 40 - Perception of Smoke When Entering Stairwell ... 39
Figure 42 - Crowd Level Upon Entering the Stairwell ... 41
Figure 43 - Smoke in the Stairwell on the Way Down... 41
Figure 44 - Floors Where Smoke Was Noticed... 42
Figure 45 - Reported Times to Travel to the Lobby when using the Elevator ... 44
Figure 46 - Reported Times to Travel to the Lobby when using the Stairwell... 45
Figure 47 - Destination Once in the Lobby... 45
Figure 48 - Total Evacuation Time ... 46
LIST OF TABLES Table 1 - Evacuation Procedures As Understood by Respondents ... 17
EXECUTIVE SUMMARY
The fire in the 36-story Cook County Administration Building on Friday, October 17, 2003, resulted in 6 fatalities and a dozen people injured. Although such a
catastrophic fire is rare in a high rise office building, it is essential to study this event in great detail to learn from this tragedy and make appropriate recommendations to minimise the likelihood that such an event should ever recur.
This human behavior study examines accounts given by building occupants in order to enhance our understanding of the existing conditions in the building prior to the fire, past training and occupant awareness of the evacuation procedure. The study has two main objectives: first, to document the occupants’ behavior and evacuation on the day of the fire, and second, to obtain information from all building occupants on their training and fire safety experience prior to the fire.
To accomplish these objectives, a mailed survey was used to interview the building occupants. The survey was developed in two parts: the first section questioned occupants on their past evacuation drills and training received at the building, and the second section, to be completed only by occupants who were on location at the time of the fire, dealt specifically with the occupant’s experiences during the event. In total, 1,862 surveys were distributed; 551 were received and analyzed, including 89 responses from occupants who were in the building at the time of the fire.
The results of this human behavior study show that although 85% of the overall respondents to the survey had received fire safety training, through drills or other means, they were ill prepared to face an actual fire. The official evacuation plan, which involved the staged evacuation of an 8-floor region surrounding the fire, was poorly understood; only approximately 20% of occupants indicated awareness of this plan. Further, a full 48% of the respondents were not aware that stairwell doors would lock behind them upon entering the stairwell. This finding implies that despite signage and training, respondents did not have the vital knowledge required for effective decision-making during an emergency in the building.
Respondent behavior during the evacuation was strongly influenced by their activities at the time of the event. Since the fire began on a Friday at nearly 5:00 p.m., only approximately 250 occupants were in the building at the time, and many were already on their way out of the building or were preparing to leave for the weekend. These individuals tended to continue the activities to which they were committed, and left the building normally. Half of the respondents who were in the building at the time of the fire used the elevators despite warnings on the call buttons, in the P.A. messages, and in their fire safety training, that elevators should be avoided during a fire. Those who were still working were much more likely to evacuate using the stairwells.
Three main contributing factors can be identified to explain the loss of life in this fire: 1) the P.A. messages to evacuate the building, 2) the locked doors inside the stairwells, and 3) the firefighting activities. Each of these factors taken individually would probably not have led to the loss of life, but their combination was fatal. The P.A.
messages were the least important of these factors; calling for an entire building evacuation sped up the times to start evacuation, but occupants would eventually have left the building had no announcements been made. The combination of locked doors and firefighting activity taking place from the stairwell were, unfortunately, the perfect
conditions for a tragedy. Although stairwell-based firefighting is common, and generally an effective and expedient firefighting method, it requires that the door from stairwell to fire floor be left open for extended periods of time. Under these conditions, a
considerable quantity of smoke immediately gathers in the stairwell shaft, which acts as a chimney. If occupants are also using the stairwell as a means of egress, those
occupants are at great risk of injury due to smoke inhalation. The addition of locked stairwell doors to this scenario puts occupants at unacceptable risk.
This study makes several recommendations based on these conclusions. First, stairwell doors should be permanently unlocked at least every 5 floors. Second, P.A. messages should be provided in real time including the following information: 1) what is happening, 2) where it is happening, 3) what is the best course of action. Third, a procedure needs to be developed whereby stairwells are cleared of occupants prior to and kept clear during stairwell-based firefighting activities. Fourth, every building should develop a Building Emergency Action Plan (BEAP), which outlines various possible emergencies and provides alternative procedures for occupant’s safety. Finally, building occupants should be trained on the BEAP, including full evacuation drills during which occupants physically experience going down the stairs.
The complete report on this fire can be found on the James Lee Witt Associates website at http://www.wittassociates.com Cook County Administration Building Fire Review – State of Illinois.
ABOUT THE NRC
The National Research Council of Canada (NRC) is the Government of Canada’s premier organization for research and development. NRC has laboratories across Canada with over 4000 scientists, technicians and support staff conducting world leading research. The research strengths of NRC are organized around several key sectors such as biotechnology, information technologies, nanotechnology, molecular sciences, aerospace, manufacturing, and construction research, among others. The Fire
Research Program, which is part of NRC’s Institute for Research in Construction, is a world-renowned fire research laboratory supporting industry and public fire safety. The Program conducts fire research on active and passive fire protection systems, risk assessment and human behavior in fire.
The principal author of this report, Dr. Guylène Proulx, is an expert in the field of human behavior in fire recognized internationally for her work in this field. She has conducted several investigations on human behavior and evacuation following major events such as the World Trade Center bombing of 1993, the World Trade Center attack of 2001 and the Forest Laneway Fire of 1995. Complete resume and list of publications for Dr. Proulx, as well as the co-authors of this report, can be found in Appendix 1.
HUMAN BEHAVIOR STUDY
COOK COUNTY ADMINISTRATION BUILDING FIRE OCTOBER 17, 2003 CHICAGO IL
by
Guylène Proulx, Irene M.A. Reid and Neil R. Cavan
1.0 INTRODUCTION
Studying occupant behavior during a fire incident is one of the best ways to learn about the impact of human factors on the circumstances and outcome of a fire. The victims of a fire are prime witnesses; they can easily describe their perception of the event, their interpretation and their reactions during the fire. A human behavior study was conducted following the Cook County Administration Building Fire to enhance our understanding of the existing conditions in the building prior to the fire, past training and occupant awareness of the evacuation procedure. Further, information on the conditions encountered in the building at the time of the fire, the response of different occupants during the event and the rationale behind their decision will help develop a complete picture of the occupant experience. The data obtained through this human behavior study can provide extremely valuable and unique information to building code developers, enforcement officials and public safety representatives.
The Cook County Administration Building fire on Friday, October 17, 2003, resulted in 6 fatalities and a dozen people injured. Although such a catastrophic fire is rare in a high rise office building, it is essential to study this event in great detail to learn from this tragedy and make appropriate recommendations to minimise the likelihood that such an event should ever recur.
James Lee Witt Associates (JLWA) was retained by the State of Illinois to conduct a review of this fire. This human behavior study conducted by the National Research Council Canada (NRC) is part of the JLWA investigation and evaluation effort.
2.0 STUDY OBJECTIVES
This study had two main objectives. The first objective was to document the occupants’ behavior and evacuation on the day of the fire. Occupants who were in the building at the time of the fire can provide information on the cues they perceived, their responses, evacuation movement and their estimated time at key moments. A
comprehensive understanding of the conditions in the building at the time of the fire, as perceived by the occupants, should help clarify some of the decisions made by the occupants and help understand the outcome of this fire.
The second objective of this human behavior study was to obtain information from all building occupants on their training and fire safety experience prior to the fire. Information was gathered on past drills and exposure to the fire alarm system and Public Address (P.A.) system. Particularly interesting were the occupant’s perceptions of the
building’s evacuation procedure, and how these perceptions differed from the official evacuation plan.
To obtain this information, a questionnaire survey was developed and distributed to the building occupants. Results from the survey analysis identify the elements that might have contributed to the loss of life as well as the successful evacuation of occupants. Recommendations will be made in relation to the findings.
3.0 THE FIRE INCIDENT
Details of the events that took place on the day of the fire were collected from different sources to provide the most complete description of the fire incident. The sources of the information used included the face-to-face interviews conducted by the JLWA team, a review of testimony transcripts, analysis of security video recordings as well as media documents. Facts and times reported may sometimes vary from one source to another; this report is the most accurate description of the event possible at the time of publication.
On Friday, October 17, 2003 at approximately 5 p.m., there were four employees and a client in the Office of the Secretary of State, Business Services Division located in Suite 1240 on the 12th Floor of the Cook County Administration Building (see Appendix 2 - Floor Plan for 12th Floor). One of the female employees smelled smoke and mentioned it to her co-workers; according to her watch, it was 4:57 p.m. She moved around to investigate and discovered a yellow-orange flame on the top shelf of a bookcase located inside a storage room that always had its door open. This employee told others “there is a fire in there”. She gathered her personal belongings and left by the exit door next to the storage room. She then took the elevator down to the first floor lobby with 5 other people from other offices on the 12th Floor who were leaving for the day.
Meanwhile, other employees in Suite 1240 had a quick look in the storage room. Without entering the storage room, they could see flames at the ceiling and smoke. One employee called the building emergency number to report the fire. The 3 remaining employees secured files and money in a safe, took their personal belongings and left the office by the main door with the client. By that time, the smoke was down to head-level in the office. They took the elevator to the lobby with another employee from another office on the 12th Floor.
At the same time, in the first floor lobby, at the Security Desk, one of the security officers heard an alarm from the Fire Alarm Control Panel; he opened the panel at 5:00:19 p.m. Using a portable radio he contacted the building engineer and advised him of a 5-star alarm and its location. Another security officer in the lobby answered the call from a female occupant on the 12th Floor about the fire at 5:01:45 p.m.
A moment later, the building engineer arrived by the stairwell on the 12th Floor to investigate the alarm. Using his key he unlocked the main door of Suite 1240. Upon opening the door, he was knocked down by a backdraft.
Stumbling down the corridor in thick black smoke, he instructed the front desk by radio to call 911 and to evacuate the 12th Floor using the P.A. system. A security officer placed the call to 911 at 5:02:29 p.m.
The female occupant who first discovered the fire exited the elevator and spoke to the two security officers that were now at the desk, advising them of the fire.
The first P.A. message was issued to “evacuate the 12th floor” at 5:03:15 p.m. The building engineer radioed in shortly thereafter, giving instructions to evacuate the two floors above the fire floor and the five floors below. Almost immediately after this message he then gave orders to evacuate the whole building. At that time, a female guard, who worked in another area of the building, came over to the Security Desk and began making P.A. messages at 5:05:05 p.m. advising occupants to evacuate the entire building by using stairs not the elevator. Similar messages were repeated every 15 seconds over a period of 2 hours.
The Chicago Fire Department (CFD) arrived at the building at 5:06:29 p.m. According to fire department personnel, fire fighters took the elevators to the 9th Floor and then walked up the Southeast stairwell to investigate; they soon found the fire on the 12th Floor. Fire fighters then connected a hose line to the building’s standpipe system on the 11th and 9th Floors and advanced up to the 12th Floor using the Southeast stairwell. They attacked the fire from the stairwell but were unable to advance further than the door from the stairwell vestibule because of the quantity of heat and smoke.
During that period occupants began evacuating the building using the stairwells and elevators. An undetermined number of people used the Southeast stairwell. According to some accounts, there was no smoke or only light smoke when occupants initially entered that stairwell. As they moved downward, however, the smoke became heavier. When some people reached the 12th Floor they reported that they met fire fighters who were preparing to advance hose lines into the 12th Floor; according to their accounts, these fire fighters instructed them to go back up the stairwell.
Descending occupants from above the 12th Floor turned around to go back up the stairs. As they moved upward, the smoke conditions deteriorated and they attempted to re-enter the building. However, the doors from the stairwell were locked and they were unable to re-enter. In trying every door on the way up, one of the evacuees found a door, which had not latched in the locked position on the 27th Floor. He opened the door and forced a wooden wedge under the door to hold it open. He then yelled down the stairwell to the other occupants that he had found an open door on the 27th Floor. Several occupants managed the climb up the stairs to the 27th Floor and transfer to the Northwest stairwell; however, some were unable to continue and lay down with their faces near the cracks of the doors, attempting to breathe clean air. There were several cell phone calls made to 911 by trapped occupants in the stairwell.
At 6:39:30 p.m., a progress report was provided by the fire department stating that the fire was out. Primary and secondary searches were completed and a final top to bottom search was initiated. During this search, fire fighters found six fatalities in the Southeast stairwell near the 20th to 24th Floors as well as several injured occupants.
A more detailed description of the fire fighting operations is contained in the main report prepared by James Lee Witt Associates.
4.0 BUILDING AND OCCUPANT DESCRIPTION
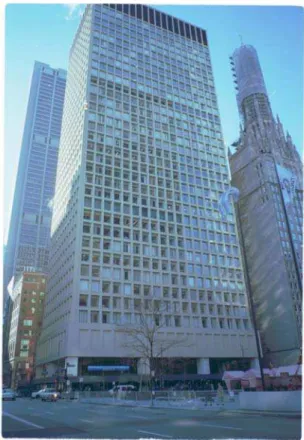
The Cook County Administration Building located at 69 West Washington, Chicago IL, was built in 1964. It is a 36-story high office building that housed essentially Cook County Offices as well as a few other organizations. A photograph of the building exterior, taken on December 10th 2003, is shown in Figure 1. There were very few occupants on the first 4 floors of the building as these floors contained the lobby-entrance area and mechanical rooms. The two top floors, the 36th and 37th, were also used for storage and mechanical equipment, and were similarly unoccupied. There was no 13th Floor in this building and, at the time of the fire, the 25th Floor was vacant. The majority of occupants were therefore located on Floors 5 to 12, 14 to 24 and 26 to 35. Each floor had a different floor plan design organized around a common central core (see Appendix 2 - Floor Plan for 12th Floor and Appendix 3 - Lobby Floor Plan). Most floors had a few enclosed large office spaces that had an open concept design with partition walls and small single offices. Some tenants had interior stairwells to allow movement between 2 floors. The floor area was approximately 17,000 ft2 (1,579m2).
Figure 1- Photograph of Cook County Administration Building
The central core common to all floors contained 16 passenger elevators as well as the 2 stairwells called Southeast and Northwest, which travelled the full length of the building. The Southeast stairwell was equipped with a smoke tower. To gain access to the stairwell the occupants would have to pass through a door to leave the tenant space, cross a small vestibule and pass through another door into the stairwell. The doors between the stairwell and the vestibule in the Southeast stairwell and between the
stairwell and the tenant space in the Northwest stairwell were permanently locked from the inside; once a person entered the stairwell they had to travel the full length of the stairwell to the lobby to exit. Re-entry was not possible on any floor and no access to the roof was available. The locked doors in the stairwells did not unlock upon alarm
activation or power failure; these doors could be unlocked only with a master key. The building engineer held one master key and another was kept in the security office on the 3rd floor.
There was a structure adjacent to the main building, called the Bustle, which ran from the lobby area to the 9th Floor. The Day Care Center, which occupied the two lower floors of the Bustle, had 22 staff and 103 children registered. At the time of the fire, there were 14 staff and approximately 30 children present. Floors 3 and 4 of the Bustle contained a few offices, while Cook County offices occupied Floors 5 through 9. This structure added 6,000 ft2 (557m2) of office space. The Bustle had a stairwell running from the 9th Floor to the lobby, which also had doors locked in the same fashion as those in the main structure.
In October 2003, there was no sprinkler system in this building except for the Day Care Center and the lobby area. The building was equipped with smoke and heat detectors that were connected to the Fire Alarm Control Panel located in the lobby. The building fire alarm could only be manually activated from the Fire Alarm Control Panel. There were no pull-stations in the building. P.A. messages could be broadcast in
specific areas or throughout the building using a handset in the Fire Alarm Control Panel located in the lobby.
The overall occupancy of the Cook County Administration Building was
approximately 2,000 occupants during office hours. Except for the children of the Day Care Center, the building was occupied by office workers aged between 18 and 65 years old. A few occupants had visible disabilities, such as using a wheelchair or a cane, and it is expected that some might have had visual or hearing impairments as well as health conditions that could impede their safe evacuation during an emergency. The exact number of occupants with limitations is unknown.
At the time of the fire, because it occurred at approximately 5:00 p.m. on a Friday (many County employees typically finished work between 3:30 and 5:00 p.m.), the building was not at its full capacity of 2,000 occupants. It is estimated that around 250 occupants were in the building at the time the evacuation order was issued through the P.A. system. This estimate is based on security video recordings from cameras located on the first floor lobby.
5.0 RESEARCH STRATEGY
Following a building visit a few days after the fire, it was decided that it would be very difficult to specifically identify the individuals who were in the building at the time of the fire and arrange to meet with them all for a face-to-face interview. Therefore, the study was conducted through a mailed survey to assess previous fire safety training as well as human behavior and evacuation during the fire at the Cook County
Since the objective of this study is to develop recommendations related to the fire safety education and training received by occupants prior to this fire, it was appropriate to survey the whole population of the Cook County Administration Building and not only the occupants who were in the building at the time of the fire. By sampling the whole population, information could be gathered from a much larger pool of respondents, allowing general conclusions to be drawn regarding the state of the respondents training and experience. Consequently, the survey was developed in two parts: the first section questioned occupants on their past evacuation drills and training received at the
building, and the second section, to be completed only by occupants who were on location at the time of the fire, dealt specifically with the occupant’s experiences during the event. A copy of the survey used is presented in Appendix 4 - Survey.
Using a mailed survey, instead of another data gathering technique such as face-to-face interviews, provided the advantage of surveying a large number of occupants within a short time period. A mailed survey also offered the important advantage of providing complete confidentiality to the respondent, who may then be more comfortable answering candidly. There is also no bias related to the potential influence of the
interviewer and since the phrasing and ordering of the questions is the same for all, answers can be compared among respondents. A disadvantage of the mailed survey is that respondents are self-selected and do not represent a random sample of the overall population of the building. Only those who feel inclined to fill out the survey will take the time to reply. Their views may not represent the views of the general population of the building. Despite these limitations, mailed surveys have been successfully used
regularly in human behavior research into fires since the study of the MGM Grand Hotel Fire in Las Vegas in 1980 (Bryan, 1983).
Due to the extensive building damage created by the fire and firefighting operation, all occupants of the Cook County Administration Building were relocated to different office buildings around the city following the fire. By the end of November 2003, 6 weeks after the fire, the survey was ready for distribution; the building occupants, however, were still scattered around the city. It was decided to rely on the County’s department directors and some other employers in the building to distribute the survey to their staff. In total, 1,862 surveys were given to directors and managers on December 10, 2003, who in turn were asked to distribute them to their staff within the next 2 days. Attached to the survey was a pre-addressed, stamped envelope to return the survey directly to the JLWA team.
The data obtained through the survey was compared to information obtained during interviews by the JLWA team with key persons involved in this fire. The video recordings from the security cameras located in the lobby area provided considerable information on timing of different events and the exiting movement of building occupants. Several documents and other sources were also consulted such as the Aargus Security Manual, the Evacuation Procedure Manual, the Building/Tenant Fire Safety Plan or the Massey Pre-Fire Plan.
6.0 SURVEY ANALYSIS
The survey was distributed to most occupants during the week of December 15, 2003, although some respondents mentioned on their copy that they received the survey only after the Christmas holidays. By January 9, 2004, 85% of the surveys to be
returned were received. There were 551 surveys analyzed in total, which represents a return rate of 30% assuming that all 1,862 surveys were actually distributed by
managers. This level of return is consistent with mailed surveys in general and reflects very well the return rate obtained in other fire studies such as the MGM Grand Hotel Fire which had a return of 28% (Bryan, 1983) or the World Trade Center Bombing of 1993 with a return rate of 25% (Fahy & Proulx, 1996). This survey return rate is sufficient to provide a valid sample for analysis.
Among the returned 551 surveys, 462 were from occupants who worked at the Cook County Administration Building but were not in the building at the time of the fire. The remaining 89 responses were from occupants who were in the building at the time of the fire and provided information on their evacuation experience on Friday October 17, 2003. This rate of return is excellent considering that approximately 223 occupants were observed exiting the building through the security camera from 5:05 p.m., the time at which the first message to evacuate the whole building was made. Assuming that all these exiting occupants received a copy of the survey, this represents a return rate of 40%.
The first 11 questions of the survey were addressed to all respondents irrespective of their presence or absence in the building at the time of the fire. The results of the analysis of these 551 returned surveys are presented in Sections 6.1 and 6.2. The results of the analysis of the 89 surveys returned by building occupants who were in the building at the time of the fire are presented in Sections 6.3 to 6.9.
The Coding Book developed to score and input data in a database is presented in Appendix 5 - Code Book. The data was analyzed using the statistical software package SPSS 11.1. Descriptive statistics were calculated to summarize the results. Cross tabulations and Chi-Square (Χ2
) tests were used to determine any correlation or relationship between nominal or scale variables. All statistical tests were judged significant at the 0.05 level or when
p
≤
.
05
which is the accepted convention for testing hypothesis in the social sciences.6.1 Respondent Distribution
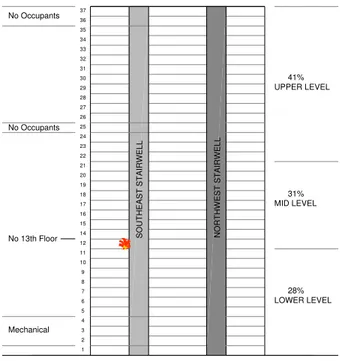
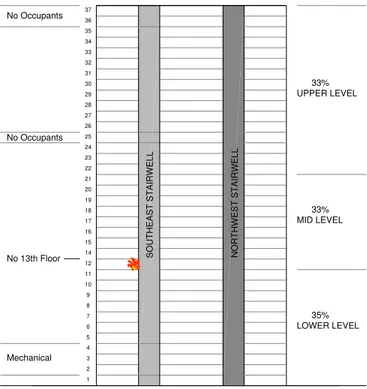
Of 551 surveys received, 99% (544) provided their working floor in response to the question ‘On which floor of the Cook County Administration Building do you normally work?’ Every floor was represented except for the 3rd and the 25th. The third floor is a mechanical floor, and the 25th was totally vacant at the time of the fire. Security officers and maintenance staff occupied the first four floors; the mean number of respondents per floor above the fourth was 19.18 (standard deviation = 9.21). The number of respondents per floor above the fourth ranged from 8 to 39. This representation is very satisfactory, as every occupied floor has a good number of respondents. For analysis purposes, the building has been divided into 3 Levels: a ‘Lower Level’ including the lobby through the 11th Floor, a ‘Mid Level’ from the 12th to the 21st Floor, and an ‘Upper Level’ from the 22nd to the 37th Floor. These division points were chosen due to the fire
location (12th Floor) and the location of the sky lobby (the 22nd Floor). The building had 6 “high rise” elevators that served the 22nd Floor sky lobby and those floors above it. This distribution also divides the building into three roughly equal segments, as shown in Figure 2. The Lower Level included 28% of respondents, 31% were from the Mid Level, and 41% were from the Upper Level.
1 2 3 4 5 6 7 8 9 10 11 12 14 15 16 17 18 19 20 21 22 23 24 25 26 27 28 29 30 31 32 33 34 35 36 37 No Occupants No Occupants No 13th Floor Mechanical UPPER LEVEL MID LEVEL LOWER LEVEL S O U T H E A S T S T A IR W E L L N O R T H W E S T S T A IR W E L L 41% 31% 28% NOT TO SCALE
Figure 2 - Division of the Building into Levels 6.2 Past Experience and Training
Respondents were asked questions regarding any previous fire safety training they had received, as well as what they perceived to be the building’s evacuation procedure.
6.2.1 Experience in the Building
The length of time respondents had worked in the building up to October 2003 ranged from 1 month to 8 years, when the building first began to be used by Cook County. The mean time spent in the building was 4.1 years (standard deviation = 2.1).
Those surveyed were asked if they had ever heard the fire alarm signal in the building prior to the day of the fire. Of the 541 (98.2%) subjects who answered, 74% had heard the building’s fire alarm before while 26% had not. This factor was strongly associated with the length of time employees had worked in the building (Χ2
=94.654, df=7, p=0.000). Those who had spent more time in the building were more likely to have heard the alarm.
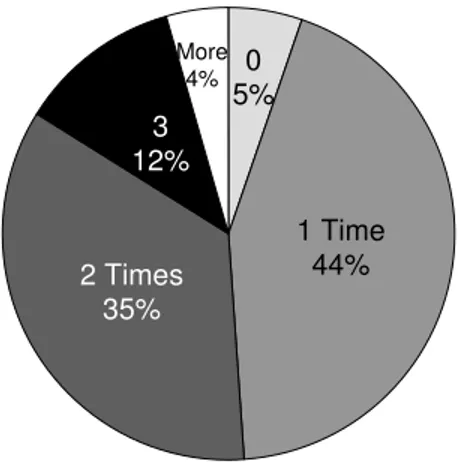
Among the people who had heard the fire alarm signal in the past, 86% (343) indicated how many times they had heard the alarm in the past year. As shown in
Figure 3, 5% indicated they had not heard the alarm in the past year, 44% of
respondents had heard the alarm once, 35% had heard it twice, and 12% had heard it three times in the past year. Only 4% of respondents had heard the alarm between 4 and 12 times. The individual who heard the alarm 12 times was one of the maintenance personnel charged with testing the system.
0 5% More 4% 1 Time 44% 3 12% 2 Times 35%
Figure 3 - Number of Times Alarm Heard in Past Year
Respondents were asked to qualify the sound of the fire alarm by selecting between a ‘horn’, a ‘bell’, a ‘buzzer’ or some ‘other’ sound. Of the 401 respondents who had heard the buildings alarm system, 89% (355) of respondents provided information on the sound of the fire alarm. Most identified the alarm as a ‘buzzer’, with 57% employees specifying this type of signal. Alternatively, 26% identified the alarm as a ‘horn’. Only 8% identified the alarm as a ‘bell’, and another 8% called it something ‘other,’ including ‘beeping,’ or a ‘siren.’
Respondents were then asked to qualify the sound level of the alarm, choosing between ‘faint’, ‘acceptable’, or ‘deafening’. The response rate for this question was 98% of the 401 respondents who had heard the building’s alarm system. Of these, 75% classified the sound intensity as ‘acceptable’, while 12% and 13% called it ‘faint’ and ‘deafening’, respectively. Most floors on which at least one respondent claimed the alarm level was ‘faint’ had at least one other respondent who claimed the level was ‘deafening’, and vice-versa. In all cases, the number of people on any given floor who claimed the level was ‘acceptable’ was at least twice the number of people who claimed it was ‘faint’ or ‘deafening’ combined.
When asked whether they had heard messages from the P.A. system prior to the fire on October 17, 96% (530) responded. Of these, 59% had heard P.A. messages before, while 41% had not. There was a strong relationship between the number of years the respondent had worked in the building and whether or not they had heard the P.A. system (Χ2
=75.701, df=7, p=0.000). Those who had spent more time working in the building were more likely to have heard P.A. messages.
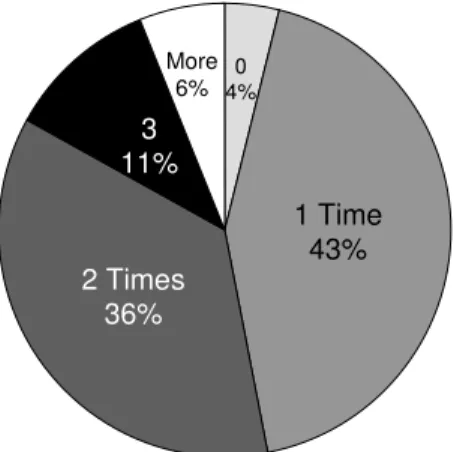
Among the 259 respondents who had heard the P.A. system before, 88% (229) provided additional information when asked how many times they had heard P.A. messages in the past year. As shown in Figure 4, most people reported hearing only a
few messages: 43% heard 1 P.A. message in the past year, while 36% had heard 2 and 11% had heard 3. Some respondents had not heard messages recently; 4% reported having heard P.A. messages in the past but had heard 0 messages in the past year. Only 6% of respondents had heard 4 or more messages.
0 4% More 6% 1 Time 43% 3 11% 2 Times 36%
Figure 4 - Frequency of P.A. Messages
Respondents were asked to qualify the clarity of P.A. messages, selecting between ‘unclear,’ ‘clear,’ and ‘varied clarity.’ Among those respondents who had heard the P.A. system before, 98% (255) replied to this question. As shown in Figure 5, 46% reported that the P.A. messages were ‘clear’, 16% that they were ‘unclear’, and 38% reported messages of ‘varying clarity’. There are many factors that could explain varying sound quality; there may have been problems with some speakers, as well as
differences in perception due to occupant location relative to the speaker, or the possibility of hearing limitations among occupants.
Clear 46% Unclear 16% Varied Clarity 38%
6.2.2 Fire Drills and Fire Safety Training
Respondents were asked if they had participated in an evacuation drill at the Cook County Administration Building over the last 2 years. Of the 543 people who responded to this section, the vast majority – 85% (461) – reported having participated in a fire drill in the past two years. There was a strong relationship between the length of time the respondent had worked at the building and whether they had participated in a drill (Χ2
=158.511, df=7, p=0.000). Those who had been working in the building for a longer period of time were more likely to have participated in an evacuation drill.
When asked in how many drills they had participated, 81% (444) of people responded. As shown in Figure 6, 44% indicated they had experienced 2 fire drills. A further 26% of respondents reported participating in 1 drill, 21% in 3 drills, and 8% in 4 drills. Only 1% reported participating in more than 4 fire drills.
3 Drills 21% 4 8% 2 Drills 44% More 1% 1 Drill 26%
Figure 6 - Number of Drills
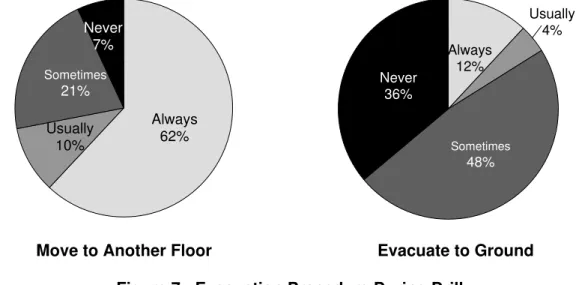
Respondents were then asked to describe their behavior during the fire drills. They were asked if they moved to another floor, and if they evacuated the building to the ground. For each question, they could respond with ‘always,’ ‘usually,’ ‘sometimes,’ or ‘never.’ When asked “During those drills, did you move to another floor?”, 448 (99%) people responded: 62% claimed that they ‘always’ moved to another floor during drills, 21% that they ‘sometimes’ did, 10% that they ‘usually’ did, and 7% that they ‘never’ did. When asked “Did you evacuate the building to the ground?” 443 (80.4%) responded: 48% claimed that they ‘sometimes’ evacuated to ground during drills, 36% that they ‘never’ did, 12% that they ‘always’ did, and 4% that they ‘usually’ did. These results are shown inFigure 7. The tendencies to move to another floor or to evacuate the building to the ground were significantly linked to the respondent’s location in the building. Those who worked in the Upper Level were more likely to move to another floor during a fire drill than those who worked in the Mid Level, who were in turn more likely to move to another floor than those who worked in the Lower Level (Χ2
=39.276, df=6, p=0.000). Conversely, those who worked in the Lower Level were more likely to evacuate the building to the ground during a fire drill than those who worked in the Mid Level, who were in turn more likely to evacuate the building to the ground than those who worked in the Upper Level (Χ2
that they ‘never’ moved to another floor, and ‘never’ evacuated to the ground. Of these respondents, 6 had a mobility impairment and required assistance to evacuate; in a drill situation, they never actually left the floor.
Sometimes 48% Never 36% Usually 4% Always 12% Sometimes 21% Never 7% Usually 10% Always 62%
Move to Another Floor Evacuate to Ground
Figure 7 - Evacuation Procedure During Drill
Of the 531 respondents who replied to the question “Do you have any limitation that could prevent you participating in a drill,” 7% (39) of respondents identified
themselves as having such a limitation. Of the 39 people with limitations, 97% of respondents gave further information about their conditions. As shown in Figure 8, half (19 people) had a mobility limitation such as requiring crutches, cane, or a wheelchair, 40% had a health limitation such as asthma, heart disease, or rheumatism, 5% had a temporary limitation such as an injury or pregnancy, 2.5% (1) had a hearing limitation and 2.5% had a visual limitation.
Mobility 50% Sensory 5% Temporary 5% Health 40%
Figure 8 - Type of Impairment
When asked if there was a floor fire warden for their floor, 523 (95%) people responded. Of those who provided information, 90% indicated that they had a fire warden on their floor, 6% indicated that they did not, and 4% did not know. These responses were independent of the floor on which the employee worked and for each
floor that a respondent claimed did not have a warden, at least four times as many respondents claimed that it did. There was at least one respondent per floor who claimed their floor had a fire warden.
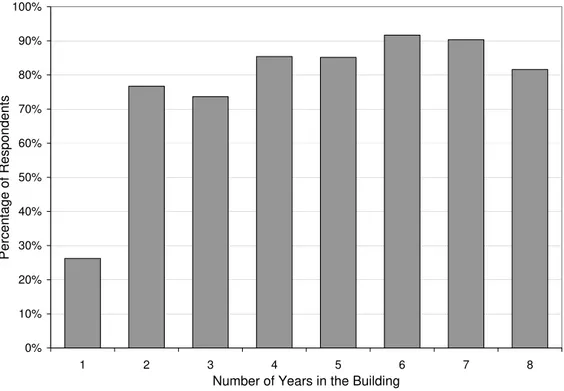
Of 542 (98.5%) people who responded when asked if they had ever used the stairwell in the building, 75% reported having used the building’s stairwells before the fire, while 25% indicated that they had not. There was no significant association
between the floor on which an employee had worked and whether or not they had used the stairs. There was, however, an increasing likelihood that an employee had used the stairwell as the number of years spent in the building increased, as shown in Figure 9.
0% 10% 20% 30% 40% 50% 60% 70% 80% 90% 100% 1 2 3 4 5 6 7 8
Number of Years in the Building
Percentage of Respondents
Figure 9 - Respondents Who Had Used the Stairs Before
Increased use of the stairwells may be tied to the increased potential in drill participation as the time spent in the building increases.
6.2.3 Aware That the Stairwell Doors Would Lock
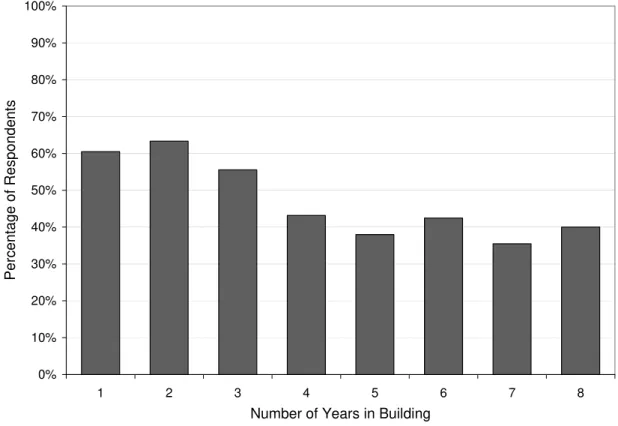
When asked if they were aware that the stairwell doors would lock behind them if they used the stairwells, 545 people responded. Of these, 52% were aware that the stairwell doors would lock behind them. Among them, 6% added, while it was not specifically asked, that although they knew the stairwell doors would lock behind them, they thought or were told that in case of emergency the doors would either unlock automatically or would be unlocked by security officers. There was a sign on stairwell doors on every floor providing information on the fact that the doors were locked, as shown in Figure 10.
Figure 10 - Photograph of Sign on all Stairwell Doors
There was a significant correlation between the amount of time employees had worked in the building and whether or not they were aware the doors would lock; the lack of awareness decreased with time (Χ2
=21.057, df=7, p=0.004). This relationship is shown in Figure 11. 0% 10% 20% 30% 40% 50% 60% 70% 80% 90% 100% 1 2 3 4 5 6 7 8
Number of Years in Building
Percentage of Respondents
Figure 11 - Respondents Not Aware That Stairwell Doors Would Lock Since increased time spent in the building is also related to increased stairwell use and increased fire drill participation, these variables are confounded and are likely interrelated.
6.2.4 Received Fire Safety Training
Respondents were asked if they had ever received fire safety training regarding actions to take in a fire at the Cook County Administration Building, such as a ‘Fire Safety Class,’ ‘Evacuation Procedure Manuel,’ ‘Fire Safety Leaflet,’ ‘Manipulation of Extinguisher,’ or ‘Other Training.’ There were 497 respondents to this section. Of these, 34% indicated that they had received multiple methods of training, 16% that they had received an evacuation procedure manual, 16% that they had attended a fire safety class, 8% that they had received other methods of training, and 7% that they had received a fire safety leaflet. Additionally, 19% of respondents indicated they had received no fire safety training. These responses are illustrated in Figure 12. The likelihood of having received some sort of training increased with the time spent in the building (Χ2
=40.289, df=7, p=0.000). Those who had participated in a fire drill in the past 2 years were also much more likely to have received training (Χ2
=62.301, df=2,
p=0.000); however, as the likelihood of having participated in a drill is also linked to the amount of time spent in the building, these variables are likely confounded.
Evacuation Procedure Manual 16% Multiple 34% No Training 19% Fire Safety Class 16% Fire Safety Leaflet 7% Other Training 8%
Figure 12 - Training Received by Respondents
Respondents were asked who had provided their fire safety training. Of 313 respondents, 68% received training from Building Management, 17% from Cook County, 10% from a combination of sources, and 5% received training from the Fire Department.
When asked how often they had received training, there were 300 responses, which ranged from having been trained 0 to 46 times. As illustrated in Figure 13, a majority of 59% had received training only once. An additional 15% indicated that they had received training twice, 5% 3 times, and 4% 4 times. Another 12% claimed they received training more than 4 times, and 5% of respondents indicated that they had not received any training. Respondents who were security and maintenance staff reported the highest frequencies; part of their duties in the building was to test the alarm system a given number of times per month. There appears to be no relationship between how often fire safety training was received and who provided training, as the percentage of
people trained by a given authority remains relatively constant as the number of times trained varies. More 12% 2 Times 15% 3 5% 1 Time 59% 4 4% 5%0
Figure 13 - How Often Trained
6.2.5 Description of the Evacuation Procedure
In this section, respondents were asked to describe what they believed to be the building’s evacuation procedure in October 2003. Responses were broad, and were categorized into 18 categories. The same respondent could mention one or several categories. Responses were coded for:
• Protect in place/stay on location/wait for rescue • Move to elevator lobby of their floor
• Follow P.A. instruction
• Follow warden or fire department instruction • Use elevator to evacuate
• Do not use elevator
• Use stairs to move to the 22nd
(sky lobby) floor • Use stairs
• Move to ground level • Go down a few floors • Go up a few floors • Search floor
• Mark empty office doors with a post-it note • Close doors
• Meet outside at a designated area
• Believe stairwell doors will unlock in an emergency, either automatically or be manually unlocked by security officers
• Don’t know the evacuation procedure
• Other, such as removing high heels, aiding a disabled person or awaiting aid if the respondent is disabled
These categories were coded in a ‘mentioned’/’not mentioned’ fashion. The responses are shown in Table 1. There were 420 respondents who described their understanding of the evacuation procedure.
Table 1 - Evacuation Procedures As Understood by Respondents
Behavior Respondents
Who Mentioned
Percent of Respondents Who Mentioned (Of 420)
Use stairs 315 75.2%
Move to ground level 161 38.4%
Follow P.A. instruction 108 25.8%
Follow warden or fire department instruction
84 20.0%
Go down a few floors 81 19.3%
Do not use elevator 56 13.3%
Search floor 51 12.2%
Other 43 10.3%
Go up a few floors 35 8.4%
Meet outside at a designated area 30 7.2%
Mark empty office doors with a post-it note
29 6.9%
Close doors 22 5.3%
Don’t know 20 4.7%
Believe stairwell doors will unlock in an emergency
17 4.1%
Protect in Place 14 3.3%
Use stairs to move to the 22nd (sky lobby) floor
6 1.4%
Move to elevator lobby of their floor 3 0.7%
Use elevator 2 0.5%
Several relations emerged between responses to earlier questions and what employees believed the evacuation procedure to be, particularly involving the floor on which the employee normally worked, the number of years spent in the building, and the fire safety training received. Those that mentioned that during an emergency they should listen to P.A. instructions were more likely to be in the Upper Level of the building, and those that mentioned they should move to the sky lobby on the 22nd Floor were invariably on floors higher than the 22nd. There was a less well-defined link between the respondent’s working floor and the ‘go down a few floors’ response; a significantly higher proportion of people reported this behavior on the 23rd, 24th and 26th Floors than elsewhere in the building. Those on the 7th and 21st Floors were also disproportionately likely to mention the ‘meet outside’ behavior, suggesting these floors had an arranged meeting place.
The likelihood of an employee mentioning the ‘search floor’ behavior increased with the amount of time they had worked in the building (Χ2
=19.259, df=7, p=0.007). Those who had received some sort of fire training were more likely to mention following P.A. instructions (Χ2=6.154, df=1, p=0.013), using the stairs (Χ2
=7.149, df=1, p=0.007), and moving to the ground floor (Χ2
=4.087, df=1, p=0.043); how often they were trained and who provided training did not seem to affect the frequency behaviors. Those who had received training were also more likely to mention going up a few floors (Χ2
=4.182, df=1, p=0.041); in this case the sample size is too small to accurately determine if the trainer or the frequency of training had an impact on the response.
There was an overwhelming link between training and the ‘search floor’ (Χ2
=10.484, df=1, p=0.001), ‘mark empty office doors with a post-it note’ (Χ2
=6.830, df=1, p=0.009), and ‘close doors’ (Χ2
=9.348, df=1, p=0.002) behaviors; almost invariably the employees who mentioned these behaviors had received training. No relationship is obvious between the respondents who mentioned these behaviors and from whom their training was received. It is likely that one or more authorities particularly stressed these specific behaviors, but due to the large percentage of people who received their training from a ‘combination’ of sources that authority cannot be specified.
There were 39 respondents who identified themselves as persons with
disabilities that would prevent them from participating in a fire drill. The responses given by these respondents regarding their understanding of the evacuation procedure seem to follow the same trends as the sample in general. A relatively larger proportion (21%) of disabled respondents mentioned ‘other’ behavior, which included waiting for an appointed aide to assist them in evacuation.
The official evacuation plan outlined in the ‘Building/Tenant Fire Safety Plan’ (2003) for the Cook County Administration Building called for employees, under the direction of floor fire wardens, to await instruction from the building’s public address system. Evacuation was only to take place on those floors directly threatened by the fire, which are defined as the fire floor, 2 floors directly above the fire, and 5 floors below the fire. These floors were to be announced, alarms on these floors were to sound, and the occupants were to relocate to another floor at least 5 floors below the fire level. Complete building evacuation was not mentioned in the fire plan; it did mention that additional floors could be evacuated at the discretion of the Fire Safety Director or Fire Department. In the case of evacuation, an outside meeting place located at least 1.5 blocks from the building was identified, at which occupants were to assemble and be accounted for by fire wardens. The plan also included the designation of two ‘searchers’ per floor, one male and one female, who were to inspect restrooms, storage areas, and other ‘areas isolated from the main areas of the office’ to ensure that everyone had left the floor. No mention is made of closing doors, or marking them with a post-it note; these behaviors, however, were strongly associated with training, and individual
departments may have performed specific training that was not included in the building document.
This evacuation plan implies that in an evacuation situation, most building occupants were expected to engage in ‘protect in place’ activities. The approach of ‘protect in place’ as an alternative to evacuation was developed in response to
numerous fire deaths in high-rise buildings that occurred in corridors and stairwells, far from the area of fire origin. In most cases, the victims would have remained safe had they stayed where they were instead of attempting to evacuate (MacDonald, 1985). ‘Protect in place’ is not a passive strategy; occupants who stay on location during a fire are expected to engage in activities such as using towels, carpet, or tape to seal doorways against smoke entry, as well as maintaining communication with building authorities regarding their location and the status of the fire (Proulx, 2001).
Overall, the official evacuation plan seems to have been poorly understood by respondents. While the plan calls for a phased evacuation during which most
employees would remain in place, only 3.3% of respondents mentioned ‘protect in place.’ The most frequently mentioned behaviors were to ‘use stairs’ (75%) and ‘move to ground level’ (38%). Very few people (7%) mentioned ‘meeting outside at a
designated area,’ although the plan calls for each floor to have such a meeting place; those who did mention this behavior were concentrated on the 7th and 21st floors. Additionally, only 26% of respondents indicated that they should ‘follow P.A. instruction,’ 20% that they should ‘follow warden or fire department instruction,’ and 19% that they should ‘go down a few floors.’ These behaviors are the primary focus of the evacuation plan yet only a fifth to a quarter of respondents understood these to be a part of the proper procedure. There is a clear mismatch between the official evacuation procedure and what respondents understood of this procedure in October 2003.
6.3 Respondents on Location at the Time of the Fire
Among the 551 returned surveys, 89 were from respondents who were in the building at the time of the fire. The following section summarizes the information
provided by these 89 respondents who completed the 2nd part of the survey. An analysis of the video recordings from the lobby security video cameras shows that a total of 223 occupants were seen leaving the building between 5:05 p.m. (the time at which the first P.A. message was made ordering the complete building evacuation) and 5:35 p.m. This tally, however, does not take into account that 160 seconds of the video from 5:15:20 to 5:18:00 p.m. were missing. Further, some recordings are grainy and it is difficult to distinguish between security officers, who exit and re-enter frequently, and the evacuating occupants. Also, the western exit, leading to the Plaza, was not covered by a video camera. However, this exit was not a natural or likely choice for evacuees due to its impractical location. Consequently, the exact number of occupants exiting or the means by which they exited is impossible to determine with certainty. Nevertheless, 223 occupants were seen exiting the building and approximately 35 of these were seen leaving from the high rise elevators, 24 were seen leaving from the mid-rise elevators, and 10 walked directly from the Day Care Center to the rear exit. Therefore, it appears that approximately 154 occupants used the stairwell to evacuate.
The 89 respondents to the survey represent 40% of the occupants who were seen leaving the building. Among the 89 respondents, 67% (52) were female and 32% (25) were male. The mean age of the respondents is 42.3 years (standard deviation = 10.7).
6.4 Initial Awareness
Respondents were asked to describe the circumstances of their initial awareness to the event and the conditions on their floor at the time they initially became aware of the situation.
6.4.1 Respondent Location
At the time of the incident, the 89 respondents were evenly located throughout the building on different floors: 35% of the respondents were located on Low Level floors, 33% were located on Mid Level floors, and 33% were located on Upper Level floors in the initial moment of the fire (see Figure 14). This distribution of the
respondents provides a very good overview of the condition throughout the building as perceived by the respondents.
1 2 3 4 5 6 7 8 9 10 11 12 14 15 16 17 18 19 20 21 22 23 24 25 26 27 28 29 30 31 32 33 34 35 36 37 No Occupants No Occupants No 13th Floor Mechanical UPPER LEVEL MID LEVEL LOWER LEVEL S O U T H E A S T S T A IR W E L L N O R T H W E S T S T A IR W E L L 33% 33% 35% NOT TO SCALE
Figure 14 - Division of the Building into Levels
6.4.2 Cues Received
The majority, 38% (33) of the respondents first became aware that there was something unusual occurring by hearing a P.A. message, 28% (24) became aware because they saw or heard others, 24% (21) became aware because they smelled something, and 10% (9) became aware because they saw something. These responses are shown in Figure 15.
P.A. Message 38% Smell something 24% See something 10% Other People 28%
Respondents were asked the time at which they initially became aware that something unusual was happening.There was a marked tendency to round off the various reported times, therefore, the time analyses should be used with caution,
especially when considering small time intervals. Twenty-five percent said they became aware of the incident at 5:00 p.m. When those who were made aware of the incident via the P.A. message were asked when they became aware, the time ranged from 4:50 p.m. to 5:15 p.m., with most responses being at 5:05 p.m.
Of the respondents that noted the time, 92% are sure of the time. Many were able to note the time because they either looked at their watch or at the time on their computer. It should be noted that all watches and clocks are not necessarily
synchronized. From the video recordings of the security cameras it appears that the first message to evacuate the 12th Floor was made at 5:03:15 p.m. The second message to evacuate the entire building was made 1:50 minutes later at 5:05:05 p.m. In parallel, the first person to discover the fire on the 12th Floor looked at her watch as she was
investigating the smoke; it was 4:57 p.m., a colleague who heard her mentioning the smoke looked at her computer clock and it was 5:03 p.m.
Figure 16 shows the different times at which people reported becoming aware of the situation. It illustrates, in 5-minute intervals, the time frequencies for the period between 4:45 and 5:15 p.m. This is the period of time during which 98% of the respondents became aware that something was happening. Of the two respondents who learned about the fire after 6:00 p.m., the first became aware of the incident at 6:15, while he was on his way home, because he saw a “fire truck & other emergency vehicles in front of the building.” This respondent was very unsure about his time estimate. The second respondent did not become aware of the fire until he reached home that evening at approximately 6:40 p.m. He left the building, using the elevator, at approximately 5:15 p.m. and had not heard any alarm or message. Once outside, he noticed people
0 5 10 15 20 25 30 35 40 45 4:45 4:50 4:55 5:00 5:05 5:10 5:15 After 6:00
Time of initial awareness (p.m.)
PERCENT
Figure 16 - Time of Initial Awareness
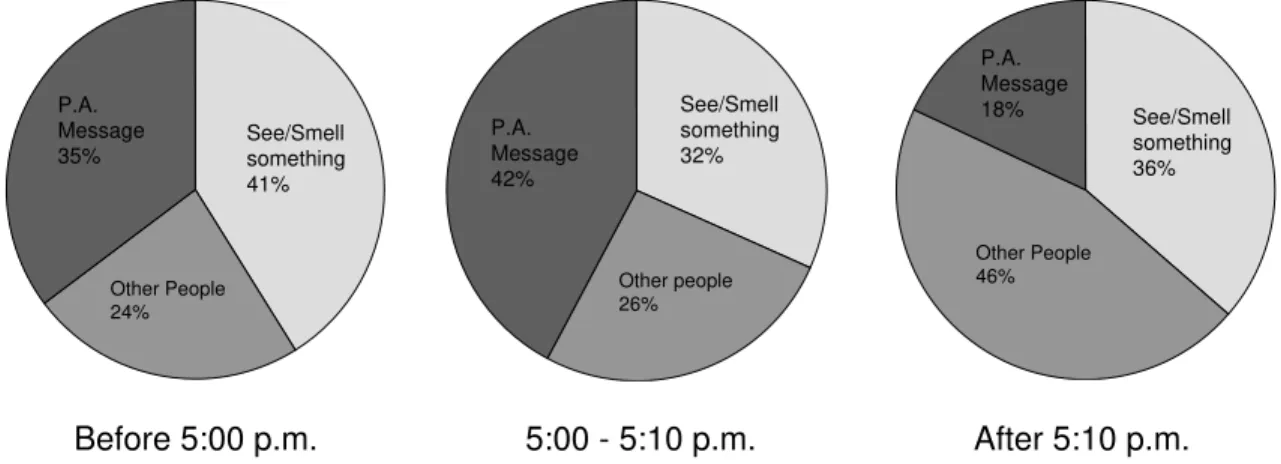
A comparison of the times at which the respondents became aware that something unusual was happening compared to the method by which they became aware is shown in Figure 17. For the purposes of this analysis, the method by which they became aware had 3 categories: “See/Smell something”, “Other people” (they saw or heard others), or the “P.A. message”. The time at which respondents became aware of the incident was not significantly linked to the mean by which they became aware (X2=3.168, df=4, p=0.530). Before 5:00 p.m. 5:00 - 5:10 p.m. After 5:10 p.m. See/Smell something 32% Other people 26% P.A. Message 42% See/Smell something 41% Other People 24% P.A. Message 35% See/Smell something 36% Other People 46% P.A. Message 18%
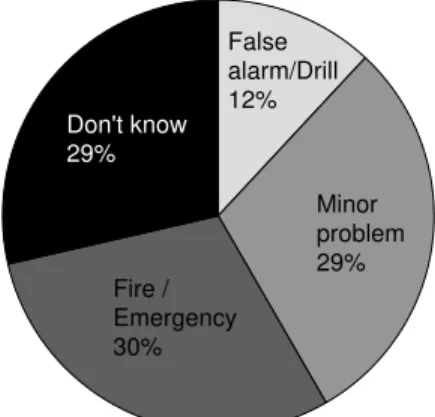
Respondents were asked what they thought was happening in the initial moments. Of the 84 respondents to this question, 30% thought that there was a fire or emergency, 29% of the respondents thought that there was a minor problem, 29% did not know what was happening, and 12% thought that it was a false alarm or a drill. Figure 18 shows the distribution of initial interpretation of the event.
Don't know 29% False alarm/Drill 12% Minor problem 29% Fire / Emergency 30%
Figure 18 - Initial Interpretation of Event
When asked ‘How serious did you believe the situation to be at first?’
respondents were provided with four categorized answers: ‘Not at all serious’, ‘Only slightly serious’, ‘Moderately serious’, and ‘Extremely serious’. It appears that initially, 36% (32) of the respondents thought that the situation was ‘Not at all serious’, 28% (25) thought that it was ‘Moderately serious’, 22% (19) thought that it was ‘Only slightly serious’, and 14% (12) thought that the situation was ‘Extremely serious’. The
distribution of the initial assessment of the situation seriousness is presented in Figure 19. Extremely serious 14% Not at all serious 36% Only slightly serious 22% Moderately serious 28%
Figure 19 - Initial Assessment of Situation Seriousness
Five of the respondents who thought there was a ‘fire/emergency’ thought that the situation was ‘Not at all serious’. On the contrary, one of the respondents who thought that the situation was a ‘Minor problem’ also felt that the situation was
‘Extremely serious’, and 4 people who did not know what was happening also thought that it was ‘Extremely serious’. Analysis showed that respondent’s initial assessment of the situation significantly affected how serious they thought the situation was (X2=8.975 df=3, p=0.030). This is shown in Figure 20.
0 2 4 6 8 10 12 14
False alarm/Drill Minor problem Fire/Emergency Don't know
COUNT
Not at all serious Only slightly serious Moderately serious Extremely serious
Figure 20 - Initial Feelings about the Situation
For statistical analysis, the ‘Not at all serious’ and ‘Only slightly serious’ categories were combined, as were the ‘Moderately serious’ and ‘Extremely serious’ categories. Respondents were not more likely to say the situation was more serious because of their floor level (X2=5.055, df=2, p=0.080).However, as shown in Figure 21, in the initial moments, those on the floors of the Lower and Upper Levels did not feel as though the situation was as serious as those in the Mid Level floors. The respondents from the Mid Level had very different appreciation of the seriousness of the situation. They were more likely to judge the situation as ‘Extremely serious’ in the initial moment of the event. Extremely serious 3% Not at all serious 34% Only slightly serious 21% Moderately serious 42% Moderately serious 13% Only slightly serious 30% Not at all serious 44% Extremely serious 13% Moderately serious 31% Only slightly serious 14% Not at all serious 31% Extremely serious 24%
Lower Level Floors (Lobby - 11th)
Mid Level Floors (12th - 21st)
Upper Level Floors (22nd to 35th) Figure 21 - Seriousness of the Situation by Floor Level
6.4.3 Activity at Time of Initial Awareness
Most of the respondents (73%) were with others when they became aware of the incident, and typically with 4 other people. Conversely, 27% of the respondents were alone when they became aware of the incident.
Figure 22 shows that 44% (37) of the respondents were working when they became aware that something unusual was happening. Nineteen percent (16) were on their way out of the building, 16% (14) were preparing to leave for the weekend, 12% (10) were on the phone, and 9% (8) were in discussions with others.
On way out 19% Preparing to leave 16% Working 44% Discussion 9% Phone 12%
Figure 22 - Activities at the Time of Initial Awareness
6.4.4 Floor Conditions
A few questions addressed the floor conditions as experienced by the
respondents from the time of their initial awareness of the incident to the time at which the person left their floor.
The smell of smoke or fire was reported by 71% (58) of the respondents. Respondents located on the Mid Level floors were more likely to smell smoke
(X2=14.144, df=2, p=0.001). Among the respondents of the Lower Level 79% (22 of 28) smelled smoke, 89% (24 of 27) on the Mid Level did, and 44% (12 of 27) on the Upper Level floors did smell smoke. Smell of smoke on their floor was not reported by any of the respondents on the 20th, 21st, 22nd or 29th Floor. All of the respondents on the 12th Floor smelled smoke. The smell of smoke seemed to have been much more prevalent on the floors right above and below the fire floor compared to the floors above the 22nd Floor as shown in Figure 23.
Yes 89% No 11% Yes 79% No 21% Yes 44% No 56%
Lower Level Floors Mid Level Floors Upper Level Floors Figure 23 - Respondents Smelling Smoke by Floor Level
Some respondents (36% or 28) saw smoke on their floor. No relationship was found between seeing smoke and floor level (X2=4.210, df=2, p=0.122). However, Figure 24 shows that there were many more occurrences of seeing smoke by those that were located on the Lower and Mid Levels. Four of the five respondents on the 12th Floor saw smoke. Yes 46% No 54% Yes 20% No 80% Yes 41% No 59%
Lower Level Floors Mid Level Floors Upper Level Floors Figure 24 - Respondents Who Saw Smoke by Floor Level
6.5 Pre-Evacuation Movement
Respondents were asked to describe the conditions on their floor when they first became aware of the situation, as well as the actions they took prior to beginning evacuation.
6.5.1 Attempt to Obtain Information
Before starting to evacuate, 39% (32) of the respondents attempted to obtain information from at least one source. Sixteen percent (13) of the respondents called friends or family. Four respondents made calls to persons inside the building and 9 made calls to persons outside the building.