Publisher’s version / Version de l'éditeur: Smart Materials and Structures, 2017-09-04
READ THESE TERMS AND CONDITIONS CAREFULLY BEFORE USING THIS WEBSITE.
https://nrc-publications.canada.ca/eng/copyright
Vous avez des questions? Nous pouvons vous aider. Pour communiquer directement avec un auteur, consultez la première page de la revue dans laquelle son article a été publié afin de trouver ses coordonnées. Si vous n’arrivez pas à les repérer, communiquez avec nous à PublicationsArchive-ArchivesPublications@nrc-cnrc.gc.ca.
Questions? Contact the NRC Publications Archive team at
PublicationsArchive-ArchivesPublications@nrc-cnrc.gc.ca. If you wish to email the authors directly, please see the first page of the publication for their contact information.
NRC Publications Archive
Archives des publications du CNRC
This publication could be one of several versions: author’s original, accepted manuscript or the publisher’s version. / La version de cette publication peut être l’une des suivantes : la version prépublication de l’auteur, la version acceptée du manuscrit ou la version de l’éditeur.
For the publisher’s version, please access the DOI link below./ Pour consulter la version de l’éditeur, utilisez le lien DOI ci-dessous.
https://doi.org/10.1088/1361-665X/aa8a0c
Access and use of this website and the material on it are subject to the Terms and Conditions set forth at
Residual stress effects of a fatigue crack on guided lamb waves
Martinez, Marcias J.; Pant, Shashank; Yanishevsky, Marko; Backman, David
https://publications-cnrc.canada.ca/fra/droits
L’accès à ce site Web et l’utilisation de son contenu sont assujettis aux conditions présentées dans le site
LISEZ CES CONDITIONS ATTENTIVEMENT AVANT D’UTILISER CE SITE WEB.
NRC Publications Record / Notice d'Archives des publications de CNRC:
https://nrc-publications.canada.ca/eng/view/object/?id=5a0dd84c-474b-49cc-a59d-a856f096162f https://publications-cnrc.canada.ca/fra/voir/objet/?id=5a0dd84c-474b-49cc-a59d-a856f096162f
Residual Stress Effects of a Fatigue
Crack on Guided Lamb Waves
M. Martinez1,3, S. Pant2, M. Yanishevsky2, D. Backman2
1Clarkson University, Department of Mechanical and Aeronautical Engineering, Potsdam, NY, USA, 13699 2National Research Council Canada, Aerospace Portfolio, Ottawa, Ontario, Canada, K1A 0R6
3Structural Integrity Group, Faculty of Aerospace Engineering, Delft University of Technology,
Kluyverweg 1, P.O. Box 5058, 2600GB Delft, Netherlands
Email: mmartine@clarkson.edu, Phone: +1-315-268-3875
Abstract: Structural health monitoring has focused on the use of computational models to capture the effect of crack-like discontinuities on the behaviour of acoustic-ultrasonic signals. However, few models have taken into account the effect of geometric complexity in combination with residual stresses generated during the fatigue crack growth process. In this study, a finite element analysis model of a C-channel type aeronautical structure is evaluated under a pitch-catch scenario. Three different finite element model configurations were considered in order to understand the effects that residual stresses of a fatigue crack emanating from a through-hole have on the guided Lamb wave propagation behaviour. The results demonstrate that numerical modelling is able to capture the change in amplitude and the effect of a phase shift on the guided Lamb wave behaviour due to the presence of the discontinuity and the stress field generated during the fatigue crack growth process.
Keywords: Guided Lamb Wave, Fatigue Crack Growth, Residual Stress Field, Wave Propagation, Aerospace Structures, Structural Health Monitoring, Acoustic-ultrasonic.
1.0
Introduction
Advancements of the Digital Twin framework for the aeronautical industry will require the development of modelling techniques that mimic the presence and state of aircraft structural damage as it develops in service. The use of Structural Health Monitoring (SHM) to detect, locate and monitor the growth of these damage sites in an operational environment is a current challenge for the scientific community. The SHM community has developed a variety of passive and active damage detection techniques that make use of acoustic-ultrasonic signals to infer damage size and detect its location. However, some of these acoustic-ultrasonic techniques, such as Acoustic Emission, are unable to produce a direct measurement of damage size. This deficiency impedes the development of Probability of Detection (PoD) curves which are an essential requirement for the acceptance of SHM as an alternative to scheduled Non-Destructive Evaluation (NDE) by the certification authorities. In addition, producing these PoD curves currently requires large experimental programs with multiple reference samples with and without representative damages, using several inspectors in a representative environment, such as in a poorly lit hangar, at height, on a less than stable platform, translating into very costly efforts. Furthermore, the SHM community faces an intrinsic challenge, as many of these techniques are dependent on sensor
placement, environmental effects and geometric complexity in comparison to their NDE counterparts. In this paper, Lamb guided wave propagation behaviour in a C-channel type metallic aerospace structure with the presence of a growing fatigue crack is simulated using a Finite Element Method (FEM) and compared with experimental results. The primary objective of this study is to determine if the results of modelling methodologies used for simulating the interaction of a fatigue crack with guided Lamb waves, match those of experimental findings. In addition, this study explores if changes in the Lamb wave propagation are a result of the presence of a small discontinuity (fatigue crack), residual stresses or a synergistic effect of both parameters and can these effects be quantified.
The SHM academic community has made large strides in simulating Lamb guided wave propagation behaviour in metallic structures. C. Ramadas et al. [1] studied the variation in reflection and transmission of both the So and Ao waves in a semi-infinite metallic beam with a crack located at the centre of the beam using the FEM. In their study, the crack was modelled as a separation of nodes interacting with a five cycle Hanning windowed sine wave with a central frequency ranging from 150 kHz to 200 kHz. Their study showed that the reflection and transmission modes are dependent on the position of the crack with respect to the overall thickness of the semi-infinite plate. Similarly, Y. Lu et al. [2] investigated the Lamb wave propagation behaviour and their interaction with through-thickness cracks of lengths from 5 mm to 100 mm in a metallic plate using the FEM with a varying frequency ranging from 200 kHz to 600 kHz. In the Y. Lu et al. paper, the crack was simulated by eliminating elements in the region of the crack path. The simulations were conducted for a time window of 75 microseconds, which for their crack / plate configuration and sensor placement provided a very good correlation between the FEM and experimental Lamb wave results. In addition, they were able to correlate crack length with transmission and reflective coefficients based on a Hilbert transform algorithm.
B.C. Lee and W.J. Staszewski [3] studied Lamb wave propagation modelling and damage detection strategy in an aluminium plate with a through-thickness slot. In their study, the authors showed the influence that the through-thickness slot size has on the Lamb wave propagation behaviour. The results showed a drop in the signal amplitude of the incident wave (So and Ao) with increasing slot size. In addition, they showed that the presence of the slot resulted in a reflection of these waves. Their damage detection was based on peak-to-peak amplitude and time of arrival of the wave. Furthermore, they were able to demonstrate how simulating Lamb wave propagation can aid in the physical understanding of the problem and calibration of the damage detection algorithms.
In recent years, the use of Wavelet finite element method has been presented as an alternative to the traditional iterative approach to modelling Lamb wave propagation in metallic structures. Z. Yang et al. [4] showed the use of B-spline Wavelet FEM approach for simulating pressure, shear and Rayleigh waves in an undamaged and slotted aluminium plate. Their findings showed a very good comparison between their B-Spline Wavelet approach and the traditional FEM approach in a time window of 300 microseconds. However, the author observed that their mathematical formulation was limited to simple rectangular shapes. Another computational technique, that has gained attention in recent years for modelling of Lamb wave is the Local Interaction Simulation Approach (LISA) based on the finite difference method [5,6,7]. Y. Shen and C.E.S. Cesnik [8] demonstrated the use of a Hybrid local FEM / LISA approach for simulating Lamb wave propagation in a composite structure. The results of their simulation showed that this technique was able to capture the anisotropic behaviour of the waves in a composite panel adhered to two stiffeners. Furthermore, their experimental and simulated results agreed with a great degree of accuracy. Their findings also demonstrated that Graphical Processing Units (GPU)-Parallelized LISA simulations allows for extremely fast computing of these problems. They reported being able to run simulations in less than 10 minutes (6000 computational steps, each step taking approximately 0.12 seconds).
Other authors have considered the use of spectral element for modelling Lamb waves. R.L. Lucena and J.M.C. Dos Santos [9] combined the time reversal approach and the use of spectral element simulations for damage detection of a cracked rod. Haikuo Peng et al. [10] demonstrated how 2D and 3D Spectral FEM can be effectively used for verifying damage detection algorithms in an aluminium plate. In addition, the authors highlighted a reduction in computational time of approximately 65%. More recently, W. Ostachowics et al. [11] published a book in 2012, titled: “Guided Waves in Structure for SHM, The Time-Domain Spectral Element Method”, which discusses the detail methodology and implementation on the use of the spectral finite element method for SHM application.
Despite the many advancements made in the simulation of Lamb wave propagation in the literature, there is still the need to understand the interaction of geometric complexity with corresponding boundary conditions, material non-linearity, and how these affect Lamb wave propagation. Without this understanding SHM will not be widely accepted by the aeronautical industry. Many of the above simulation studies consist of the use of flat metallic plates with a crack being simulated artificially by the separation of nodes in a mesh. However, the academic community has made large strides in understanding and simulating fatigue cracks in metallic structures [12,13]. The authors have shown in [14] that metallic fatigue cracks differ from Electrical Discharge Machining (EDM) notches commonly used to simulate crack-like discontinuities in SHM studies. Furthermore, it is well documented in the literature that fatigue cracks develop a residual plastic wake region during the fatigue crack growth process [13]. It is the primary objective of this paper, to consider the effects of this residual stress field left in the wake of the formation and growth of a fatigue crack emanating from a through-hole in a C-channel type metallic structure and the corresponding effects on the guided Lamb wave propagations.
2.0
Experimental Setup
A 7075-T651 aluminium alloy C-channel, as shown in Figure 1, was subjected to a constant amplitude fatigue loading, with a maximum load of 11,120 N (2,500 lbf) with R-ratio equal to 0.1. The load was applied by a servo-hydraulic MTS load frame (load capacity of 25 kN), as shown in Figure 2-a. The C-channel was held on to the MTS load frame via a swivel connector fastened to the top and bottom of the C-channel in order to allow rotation in this asymmetrical structure, as shown in Figure 2-b. Due to the nature of the loading, this developed a geometric non-linear loading condition. In order to measure the strain during the load application and to serve as verifications of the FEM; the C-channel was instrumented with three CAE-13-125UN-350 strain gauges from Micro-Measurement, as shown in Figure 3. The three strain gauges were connected to an HBM Quantam X MX840 data acquisition system and monitored using CATMAN AP software. In addition, the C-channel was instrumented with a cracK Indication Sensor (KIS) [15,16] to control the final crack length.
The KIS system consisted of an electrically insulated basecoat separating the aluminium substrate from a conductive paint layer connected to a 5V DC electrical circuit. The KIS system was connected to the servo- hydraulic control system of the MTS frame. When the 5V DC dropped to zero, it was indicative that the fatigue crack had passed through the sensor, triggering the MTS hydraulic frame to stop. The crack indication sensor was placed 2.54 mm away from the through-hole with a 0.4 mm saw-cut slot.
Figure 1: Schematic of the C-channel.
Figure 2: a) Experimental setup; and b) Swivel loading condition.
2.1 Specimen Specifications and Material Properties
The material properties of the 7075-T651 C-channel were considered to have a Young’s modulus of 72.9 GPa, a density of 2800 kg/m3 and a Poisson’s Ratio of 0.33 [17]. It is important to note that the Young’s modulus was slightly increased from the traditional value found in the literature (71.2 GPa), in order to match the finite element strains with the experimental strain results. To model the fatigue crack process related plastic deformation, as such the plasticity model in FEM assumed a combined hardening plastic condition. In addition, a damage evolution was set to one while the maximum principal stress was set to 571 MPa. The full 7075-T651 elastic and plastic stress versus strain curve was obtained from [17].
As seen in Figure 1, the C-channel contains one single through-hole, in which a 0.4 mm through thickness saw-cut was introduced to grow a crack emanating from the hole under fatigue loading conditions. The C-channel also contained machined radii in its inner pocket. Figure 3 shows the positions of the three strain gauges, four Lead Zirconate Titanate (PZT) sensors with PZT 1 labelled as Actuator, along with their relative distances from the through-hole.
Figure 3: Finite Element Model of the C-channel.
Strain Gauge 1 (SG1) was set at 10.7 mm from the centre of the through hole toward the outer flange of the C-channel. Strain Gauge 2 (SG2) was placed in the central axis inside the inner pocket of the C-channel, while Strain Gauge 3 (SG3) was placed at the centre of the outside bottom surface of the C-channel. All strain gauges in the FEM were positioned to match the location in the experimental setup, as shown in Figure 3.
The PZT actuator and sensors used in this study were single sensors form Acellent Inc., which were simulated as cylindrical disks of 6.5 mm in diameter with a thickness of 0.25 mm. The piezoelectric actuator/sensors were assigned orthotropic Piezoelectric Navy I material with the following properties: E11 = E22 = 80 GPa; E33 = 68 GPa; G13 = G23 = 30.5 GPa; G12 = 29.0 GPa;
and Poisson’s Ratio v12 = v31 = v32 = 0.31. The piezoelectric charge constants were set to: d31
= -125×10-12 C/N; d
33 = 290×10-12 C/N; while d15 = 480×10-12 C/N. Finally, the relative dielectric
constants were assigned values of k11 = k22 = 1275, and k33 = 1320 (εo = 8.85410-12F/m), while the
density was set to 7600 kg/m3 [18].
3.0 Finite Element Model (FEM)
A Finite Element Model (FEM) of the C-channel was developed in ABAQUS CAE™ version 6.16. The model consisted of three distinct components: (i) the aluminium C-channel section; (ii) four piezoelectric actuator / sensor discs connected to the C-channel with a tie constraint; and (iii) two rigid swivel connectors tied onto the C-channel with a prescribed boundary conditions that allowed for the C-channel to rotate during the load application, as shown in Figure
3
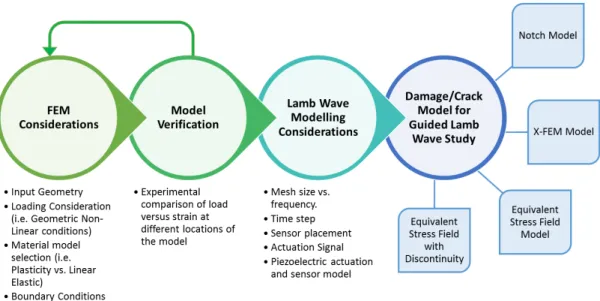
. ABAQUS implicit method was employed in this study. Figure 4 depicts many of the important considerations required in order to provide a good correlation between experimental results and those of the FEM in a guided Lamb wave study. The final section of the schematic identifies the different damage / crack models considered in this study. Detail explanation on the advantages and disadvantages for each one of these approaches depicted here will be discussed further in section 4 of this manuscript.Figure 4: Finite Element Modelling approach.
The experimental load of 11,120 N (2,500 lbf) at 2,224 N (500 lbf) intervals during the test was set to the reference point on the upper swivel connected member and applied in the Y-direction. The lower swivel connector was fixed as to not allow for translation, but was allowed to rotate along the Z-direction; thus, mimicking the experimental setup shown in Figure 2-b. In addition, a tie constraint was set between the deformable C-channel section and the rigid swivel connectors. The FEM consisted of a total of 762,062 hexahedral linear elements (C3D8R - 2,589,015 degrees of freedom), 81,985 tetrahedral linear elements (C3D4 - 76,710 degrees of freedom) and 3,200 hexahedral piezoelectric elements (C3D8E - 17,920 degrees of freedom) for a total of 847,247 elements (totalling 2,683,645 degrees of freedom). Due to the nature of the simulations, a time step was set to 10 nanoseconds and a mesh element size of less than 1 mm was used. The minimum element size was obtained from the smallest wavelength analysed in this study. The element size selected was also sufficiently small as to ensure convergence of the strain results with respect to the FEM results obtained during the strain survey. Moser et al., suggests the use of 20 nodes per wavelength [19], while Chen et al., suggests that 10 nodes per wavelength is sufficient [20]. The time step used in this study follows the guidelines proposed by Chen et al. for a total of 20 points at the maximum frequency of the signal [20]. It is important to note that while ABAQUS CAE™ computes every time step at the assigned step size, the solution data file only saves at a time step of 1×10⁻⁷ seconds, which is still below the recommended value proposed by Chen et al. This is primarily due to the output data file size generated throughout the analysis being over 100 Gigabytes per simulation run.
A Windows 7 computer server with two Intel Xeon CPU 2650V3 (a total of 20 physical CPUs) running at 2.30 GHz with 128 Gigabytes of RAM was used in this study. In addition, portions of the simulation took advantage of an NVIDIA Tesla K40c GPU. Despite the high-end computational resource, many of the simulations took over 14 days to converge for a total time window of 350 microseconds.
3.1
Verification of the C-channel Finite Element Model
A primary concern when conducting any finite element study is the level of confidence on the geometry, boundary conditions, and material properties assigned to the model. Therefore, the developed ABAQUS FEM was verified with respect to the experimental test setup. The initial model of the C-channel was very rudimentary and did not include many of the features shown in this paper. For example, the initial model assumed a linear load application (no geometric non-linear behaviour), and as such it was over constrained. Furthermore, the radii in the inner pocket of the C-channel were not initially included in order to minimize the mesh complexity. The material properties were taken directly from the literature. However, it was necessary to minimize the assumptions made during the model development as these would have an impact on the accuracy of the guided Lamb wave study with respect to the experimental results. The resulting strain values at the different strain gauge locations were used as a means of comparison, as shown in Figure 5. This systematic overview allowed the authors to have a good understanding of the experimental setup and the specimen being evaluated for the guided Lamb wave propagation study.
All strain values measured and obtained from the FEM agreed within a 4% difference and followed the same trends as the experimental results during the static pull test. As shown in Figure 5, these trends are indicative of a non-linear strain profile due to the large rotational nature of the load application. It is important to note that the loads are well below the yield strength of the material.
Figure 5: Comparison of strain between FEM and experimental test setup.
4.0
Finite Element Crack Growth Model for Guided Lamb Wave
Study
In order to simulate the guided Lamb wave propagation behaviour in a pitch-catch configuration, it was necessary to consider how the crack would be modelled. The crack represents a discontinuity in the material, which may be fully closed at zero load or open when a load is
applied. It is also well understood by the fatigue community that these cracks leave a residual stress field in its path during the Fatigue Crack Growth (FCG) process. As such, Figure 6 contains the four basic simulation configurations considered in this study which have been subdivided into three models. These models were constructed in order to study the effect of the different parameters (crack size, closed versus opened crack like discontinuity and stress field effects) and their effects on the guided Lamb wave propagation behaviour.
Figure 6: FE Crack Growth Models: (a) Baseline FE Crack Growth Model with an initial 0.4 mm EDM notch and no residual stress field; (b) 2.5 mm EDM Model with no residual stress field; (c) 0.4 mm EDM under an applied internal load over a 2.1 mm region; and (d) 0.4 mm EDM + 2.1 mm 50 µm width notch under an applied internal
load.
4.1 Model 1: EDM Notch Model
In Model 1, the crack is modelled as an EDM notch with a width of 0.25 mm and length of 0.4 mm representing the saw-cut, as depicted in Figure 6-a. A natural progression to this model was to increase the length of the initial EDM notch to 2.5 mm to mimic a 2.1 mm grown crack, as shown in Figure 6-b. However, it is important to note that Model 1 does not consider any residual stresses left in the wake of the notch due to the fatigue crack growth process. The primary advantage of this model is that the entire analysis falls within the linear elastic regime, and as such, any guided Lamb wave propagation study under this modelling approach converges and executes much faster.
4.2 Model 2: Equivalent Stress Field for a Closed Crack
Model 2 consisted of simulating the fatigue crack emanating from a 0.4 mm EDM notch, where the crack is fully closed (no discontinuity is present in the model), as shown in Figure 6-c. This model simulated the presence of a residual stress field along a 2.1 mm length of the crack growth region. The residual stress field was simulated by applying an internal load in the crack region to simulate an equivalent stress field. However, in order to determine the magnitude of this internal loading, it was necessary to create a surface discontinuity in an X-FEM model in ABAQUS CAE™, as shown in Figure 7.
The authors originally envisioned the X-FEM model as the desired approach for simulating the guided Lamb wave propagation behaviour and its interaction with a fatigue crack. In order to consider the formation of a plastic wake effect due to the FCG process, material plasticity was assigned to the 7075-T651 C-channel FEM, as described previously in Section 2.1. The maximum applied load was the same as that used during the experimental setup of this study.
To create a residual stress condition due to the FCG process in the FEM, the C-channel was subjected to a geometric non-linear analysis as demonstrated by the static pull test performed during the experimental setup. It is important to note, that once geometric non-linear behaviour is turned on in an ABAQUS CAE™ step, this cannot be turned off for any future steps [21]. The residual stress field due to the FCG process was computed by manually increasing the size of the X-FEM crack by 50 µm increments until a full crack length of 2.1 mm was achieved. The X-FEM model of a crack introduces contact non-linear conditions, which increase the computational costs. Furthermore, a mesh refinement in the area of the crack region was set to 50 micrometres to have a smooth stress field in the region of the FCG. As such, the X-FEM would include: geometric non-linearity, material non-linearity, and contact non-linearity. The results of the X-FEM FCG model were used to determine the magnitude of the stress field during the FCG process. This result was then applied as an internal loading condition in the crack growth region of Model 2. It is important to note that the application of an internal loading condition in the crack region is entirely a linear elastic model thus generating a stress field of the same order of magnitude as previously obtained during the X-FEM FCG model. In addition, the internal applied load in Model 2 is not the same at every element in the crack growth path. Thus, the first seven elements in the proximity to the 0.4 mm EDM notch have a different load magnitude to the elements that follow (Elements 8 through 35). Finally, the applied load is counter-balanced on either side of the crack growth line. It is important to note that although the authors attempted to run the linear guided Lamb wave propagation study using the X-FEM FCG model, the computation for each case was extremely time consuming.
4.3 Model 3: Equivalent Stress Field with a Discontinuity
The final model considered in this study consisted of a 50 µm crack under an internal applied load connected to the original 0.4 mm EDM notch, as shown in Figure 6-d. Similar to Model 2, the internal applied load was scaled to create a stress field in the 2.1 mm cracked region as that obtained in the X-FEM FCG model. In addition, this model assumed that the crack was partially opened with a 50 µm gap in addition to the application of a residual stress field.
5.0
Guided Lamb Wave Propagation Model
The authors developed an in-house code in MatlabTM to control and gather transmitted and received data from the Acellent ScanGenie SHM system, where data was acquired at 12 MS/s [22]. The Matlab in-house scripts were used to perform filtering and cleaning of the raw captured data. These same scripts were used on both the experimental and FEM data. In order to mimic the experimental results and reduce the number of assumptions, the actuation signal captured by the digital oscilloscope (experimental Hanning window shown in Figure 8) was used as the input signal in the FEM. The guided Lamb wave propagation model presented in this study was based on a pitch-catch configuration where the PZT actuator, as depicted in Figure 3 transmitted a Hanning window at a central frequency of 50 and 200 kHz. The generated guided Lamb wave signal was then captured at PZT Sensors 2, 3 and 4, also depicted in Figure 3. Figure 8 below highlights the differences in the actuation signal for both the 50 and 200 kHz Hanning window with respect to the theoretical Hanning window. It is important to note that the FEM did not account for any attenuation of the signals. A Fast Fourier Transform (FFT) analysis corroborated
the central frequency of the actuation Hanning window being transmitted in the pitch-catch configuration.
Figure 8: a) Theoretical versus experimental Hanning window at 50 kHz; and (b) at 200 kHz.
The acquired signals from PZT 2, 3, and 4 were filtered using a zero-phase shift (filtfilt) Butterworth band-pass filter with a pass band between 1 kHz and the excitation frequency + 200 kHz in Matlab™.
6.0
Results
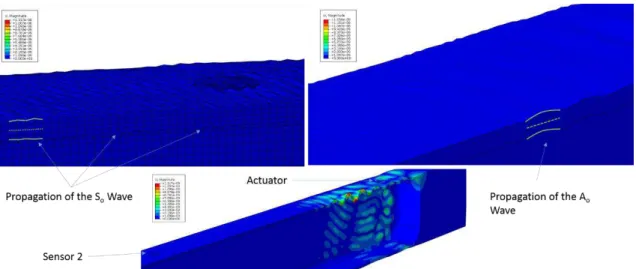
In order to understand if the experimental and numerical results were in agreement with the theory of guided Lamb waves travelling in an aluminium structure, the speed for both the So and Ao waves were computed based on the Time of Arrival (ToA) and the separation distance between the sensors and actuator. The results indicated that the group velocity of the Ao wave matched very closely (less than 5% difference) to both the experimental and numerical response. In the case of the So wave, both the experimental and numerical velocities were approximately between 5.5 to 11% off from the theoretical dispersion curve respectively. This offset in the So wave is primarily due to the difficulty in determining the exact ToA of the incoming wave. The speed of the So wave is much faster than the Ao wave and for this frequency range its amplitude is smaller [23]. As such, a small change in the ToA translates into several hundreds of meters per second in the overall wave speed. The ToA were computed through a Morlet Wavelet fit at the actuator’s central frequency for the actuation Hanning window. The ToA of the incoming waves were also verified through the FEM as shown in Figure 9. The FEM allows for visualization of the complex wave propagation behaviour (So and Ao) at different time steps, in addition to the corresponding interaction of the waves with the different boundary conditions in the model. It is important to note that the results presented in this study are only for the Actuator 1 - Sensors 2 path, which is the path along the damage site. The proximity of the Actuator 1 to Sensor 3 did not allow for the separation of Lamb wave modes. The Actuator to Sensor 4 path, did not provide additional insight into the Lamb wave propagation behaviour.
Figure 9: Finite Element verification of the Time of Arrival for the So and Ao wavesat 50
kHz excitation frequency.
The authors analysed the experimental wave signals for different wave path combinations, such as: Actuator 1-Sensor 2, 3 and 4; Actuator 2 – Sensor 1, 3, and 4 and so on. The analysis consisted in understanding the change in cross-correlation, energy ratio and amplitude ratio of the signals as a function of crack size at different actuation frequencies. The results matched those found in the literature, that is to say, the path with the damage present (Actuator - Sensor 2) showed a drop in energy ratio and amplitude ratio, while the sensor path with no damage showed no drop in these ratios. In addition, it was also demonstrated that changes in the cross correlation coefficient are only noticeable when the crack size is larger than 2 mm, along the Actuator - Sensor 2 path. The effect on changes in amplitude ratio, energy ratio and cross-correlation coefficient as a function of damage are not shown in this study as these can be found in [24,25]. For brevity, in this study the analysis is focused only on the modelling and simulation of damage along the Actuator – Sensor 2 path.
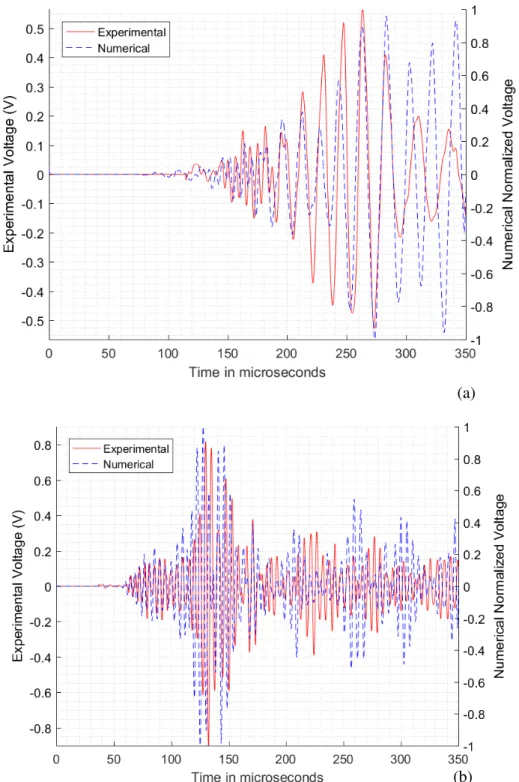
Figure 10 shows a comparison of the guided Lamb wave signals captured by Sensor 2 in response to the 50 kHz and 200 kHz actuation Hanning window. Once the numerical and experimental results were superimposed on the same graph by matching the actuation signal and not the actual sensor signal response, it was interesting to observe that the So and Ao response matched in phase for both frequencies. However, it is important to also note that not all the numerical model amplitudes follow the exact same trends as in the experimental results, especially after the passing of the first So and Ao wave packets.
Figure 10: (a) Numerical and experimental comparison of the signal response for Actuator to Sensor 2 at 50 kHz; and (b) at 200 kHz.
6.1
Model 1: Results on the Effect of a 2.5 mm EDM-Notch on a 50 and 200 kHz
Guided Wave
This section presents the results of a guided Lamb wave study for a 2.5mm EDM notch, representing the entire length of a 2.1 mm fatigue crack emanating from a 0.4 mm initial saw-cut.
(a)
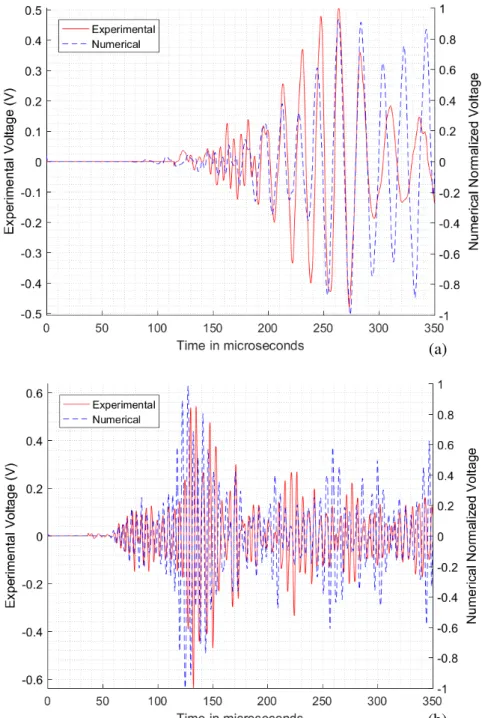
Comparison between the experimental and the numerical waveform excited at 50 kHz and 200 kHz for the presence of a 2.5 mm EDM notch are provided in Figure 11. The discrepancy in the Ao time of arrival was found to be 10 microseconds between the experimental and numerical data for the 50 kHz signal, while the ToA comparison between the experimental and numerical data for the 200 kHz case showed a discrepancy of 1 microseconds and 6 microseconds for the So and Ao wave packet respectively.
Figure 11: (a) Model 1: Comparison between experimental and numerical waveform for 50 kHz with a 2.5 mm EDM notch; and (b) with a 200 kHz waveform.
(a)
6.1.1 Model 1: Waveform comparison between 0.4 mm saw-cut EDM notch
(Baseline) and 2.5 mm EDM notch
The ToA for the experimental and the numerical data was found to be consistent for both the 0.4 mm saw-cut and the 2.5 mm fatigue crack (2.1 mm plus the 0.4 EDM notch). As such the data gathered from the presence of the 2.5 mm EDM-crack modelled in ABAQUS CAE™ was compared to the initial 0.4 mm EDM saw-cut model. This was done in order to determine if the numerical results changed significantly due to the presence of the additional damage. Results of the comparison for 50 kHz wave are provided in Figure 12. Similarly the experimental data was also compared to the original baseline signal obtained at zero cycles, when only the 0.4 mm saw-cut was present on the structure and no fatigue loading of the specimen had taken place.
From Figure 12-a (shown in the rectangle), the experimental results show a decrease in the amplitude of the Ao wave of approximately 8.6%. However, the equivalent comparison in the numerical model shows an increase (shown as a negative percentage) in the wave amplitude of the Ao wave of approximately 10.5%. For the first wave of arrival, i.e. the So wave, there is a reduction in wave amplitude for both experimental and numerical signals with respect to their baseline, which is highlighted in Figure 12 as an ellipse. It is important to note that the computed percent reduction shown was only obtained for the Ao wave window of the signal at the absolute maximum location. The percent reduction for the So wave packet was not calculated as the arrival of the So wave packet is not as evident as for the Ao wave packet.
The same model analysed with a 200 kHz guided wave is provided in Figure 13. It is interesting to note that the effect of crack growth was captured by both the experimental setup and the numerical technique for waves propagating between the Actuator and Sensor 2, where a reduction in wave amplitude can be observed for both the So (highlighted in ellipse) and the Ao (highlighted in rectangle) waves. For the Ao wave packets this percent reduction is quantifiable with a reduction of 29.2% and 18% for both the experimental and numerical results respectively.
Figure 13: Model 1: Comparison of 200 kHz waveform between the 0.4 mm saw-cut versus the 0.4 mm saw-cut with 2.1 mm fatigue crack for Sensor 2.
6.2
Model 2: Equivalent Stress Field Model on a Closed Crack
The primary objective for development of Model 2 was to determine how a residual stress field due to the Fatigue Crack Growth (FCG) process would affect the guided Lamb wave propagation behaviour at zero loads. As such, the primary assumption in this model configuration is that the crack is fully closed (i.e. no discontinuity), while the stress field in the region of the crack is
present as a result of the fatigue crack growth process. The local mesh around the crack was reduced to have elements along the length of the X-FEM crack of approximately 50 micrometres. As such a total of 42 load and unload cycles were performed to grow the crack from an initial 0.4 mm EDM notch by a 2.1 mm extension. In reality, the 2.1 mm crack took approximately 55,306 cycles to grow from the 0.4 EDM starter notch. Figure 14-a shows the results of the X-FEM stress (Von Mises) in the crack region. As seen in Figure 14 the equivalent stress field along the length of the crack is approximately 300 MPa.
Figure 14: (a) X-FEM residual stress field due to the FCG process; and (b) equivalent stress field model.
The authors decided to create a simplified version, which applied a nodal loading condition to mimic the stress field around the crack, as observed in Figure 14-b, however the equivalent stress field extends beyond the region simulated by the X-FEM model; despite this extension, the magnitude of the stress field remains the same.
6.2.1
Model 2: Results at 50 kHz and 200 kHz
Figure 15-a shows the effect of the residual stress field with no discontinuity on the guided Lamb wave propagation behaviour. As seen in Figure 15-a, the presence of the stress field on the So mode is minimal when compared to the experimental results. However, the Ao mode experiences a phase shift / time delay in addition to an amplitude reduction with respect to the experimental signal.
Figure 15: (a) Model 2: Actuator to Sensor 2 response at 50 kHz; and (b) 200 kHz waveform.
(a)
Figure 16-a, shows a comparison for the 50 kHz response on Sensor 2 for Model 2 with respect to Model 1. As seen in this figure, the presence of the stress field causes a phase shift on the guided Lamb wave propagation, especially for the Ao wave. In addition, the results indicate a drop in amplitude (19% for the Ao wave), which is usually attributed to the presence of a discontinuity. However, Model 2, does not have a discontinuity present in the Actuator to Sensor 2 path. As such, the 2.1 mm fatigue crack was modelled as a local stress field equivalent to that obtained from the X-FEM model. Similar findings were observed for the 200 kHz response, shown in Figure 16-b. In this case, the percent reduction in the Ao wave amplitude is of approximately 10%.
Figure 16: (a) Model 2: Comparison of 50 kHz waveform between the 0.4 mm saw-cut versus
a 2.1 mm fatigue crack stress field region; and (b) at 200 kHz waveform.
Figure 17-a, shows a phase shift in the Ao wave while the So wave remains un-affected by the presence of the stress field in response to a 50 kHz actuation signal. Figure
17
-b shows similar results for 200 kHz.Figure 17: (a) Model 3: Actuator – Sensor 2 response at 50 kHz; and (b) at 200 kHz.
(a)
Figure 18-a, shows the comparison of Model 3 with respect to the baseline 0.4 mm EDM notch model. This figure clearly depicts a phase shift due to the presence of the stress field and the open crack. However, the reduction in amplitude for the 50 kHz signal (10.7%) is not as large as that observed in the 200 kHz response (27.9%) shown in Figure 18-b.
Figure 18: (a) Model 3: Comparison of the 50 kHz waveform between the 0.4 mm saw-cut
versus the 0.4 mm saw-cut with 2.1 mm fatigue crack for Sensor 2 with a residual stress field and an open crack; and (b) 200 kHz waveform.
7.0
Discussion
In this paper, the guided Lamb wave behaviour on an aluminium C-channel type structure was studied both experimentally and numerically. The numerical model was refined based on the experimental strain data generated by the application of an applied load. It was found that in order to mimic the guided Lamb wave propagation, the model had to replicate the structure to a high
level of accuracy to include features like radii, holes, corners, boundary conditions, fillets, etc., in addition to the material and loading parameters typically associated with these studies.
Model 1 consisted of an EDM notch, thus assuming that a fatigue crack was present in the direct path between the Actuator and Sensor 2, and that this crack had no residual stress field associated with it. The experimental and numerical results demonstrate that the presence of a crack modelled as an EDM notch causes a drop in the amplitude of the guided wave for the So waves at both 50 kHz and 200 kHz as it is commonly documented and modeled in the literature. It is also interesting to observe that the Ao wave also showed a drop in amplitude of approximately 8.6% and 29% for the 50 kHz and 200 kHz signal respectively. However, the numerical model only captured this drop for the 200 kHz Ao wave and not for the 50 kHz Ao wave, as depicted in Figure 12, which actually shows an increase (10.5%) in the amplitude with respect to the baseline signal (0.4 mm EDM starter notch).
According to the literature, the detectable damage size would have to be at least the same size or smaller than half of the wavelength of the guided Lamb wave in order to interact with the damage [26]. As such, at 50 kHz the minimum detectable size using the So wave would be 53.4 mm and approximately 16.6 mm for the Ao wave. Similarly, a 200 kHz actuation signal would have a minimum detectable size of 13.3 mm and 6.7 mm for the So and Ao waves respectively. The damage size considered in this study (2.1 to 2.5 mm) is much smaller than those suggested by the literature. However, the experimental results clearly indicate an interaction between the 2.1 mm crack and the wave signals at those frequencies, as shown in Figure 12-a and Figure 13-a. Such effect was also witnessed by Fromme and Sayir, where they studied the scattering effect of the Ao wave mode around undamaged and damaged holes in an aluminium plate with a laser interferometer and found that the scattered field changed significantly due to the presence of a notch or a crack that is much smaller than the wavelength of the Ao wave [27]. In addition, at the 200 kHz frequency, the numerical model suffered a drop in the amplitude as shown for all models in Figure 13-b, Figure 16-b and Figure 18-b. This suggests that this interaction with the guided Lamb wave is not only due to the presence of a discontinuity (damage), but potentially a combination of stress fields and discontinuities that cause this drop in amplitude in the experimental results.
Modeling the residual stress field generated during FCG as a linear load on the crack region also creates a challenge during the modelling process. The local deformation due to the application of nodal body forces in the crack regions generated displacement fields which are much greater than the displacement field produced during the pitch-catch actuation signal of the guided Lamb wave passing through the region. The standard displacement magnitude of the guided Lamb wave is in the order of 10-9 m for an approximate 12 Volt actuation signal. However, the applied load used in the proximity of the crack generated a local displacement field that was in the order of 10-6 m. As such, the first set of simulations would not see any effect on the guided Lamb wave propagation behavior during the passing of the wave through the stress field region. The difference between the local displacement field due to the local applied load and that of the guided Lamb wave is approximately off by a factor of 1000. As such, subsequent simulations augmented the actuation voltage by a factor of 1000 in order to match the order of the displacement field due to the presence of the superimposed stress and that generated by the guided Lamb wave, while maintaining a linear-elastic simulation. Normalizing the output voltage at the sensors with respect to the actuation signal, leads to the same findings on the guided Lamb wave results due to the presence of the equivalent stress field. However, it is important to note that a small augmentation factor of the input signal could lead to issues of significant digits due to the difference in magnitude between the different displacement fields (piezoelectric excited field vs. nodal body forces). As such, it was deemed appropriate to maintain the same order of magnitude to that produced by the nodal body forces.
The numerical results produced in Model 2 (equivalent stress field with no crack), clearly demonstrate that despite not having a discontinuity in the model, a drop in the amplitude for both
the So and Ao guided Lamb waves was produced. In the case of the Ao wave this drop is quantifiable (19% and 10% for the 50 kHz and 200 kHz signal respectively). In addition to a percentage drop in amplitude, a phase shift is clearly identified for both actuation frequencies. Quantifiable experimental results are not shown, as this would require quantifiable measurements of the stress field during the FCG process through experimental mechanics techniques such X-ray or neutron diffraction. However, the numerical approach was able to capture the effect of a drop in amplitude in addition to a phase shift in the guided Lamb wave signal despite not having an actual open crack / discontinuity, mimicking the experimental results in Figure 12-a and Figure 13-a. This suggest the possibility of modeling fatigue crack in Lamb wave propagation studies as a stress field change, simplifying the mesh and overall complexity of the FEM, thus, moving closer to the development of numerically assisted Probability of Detection (POD) curves mandated by the airworthiness authorities.
Finally, Model 3 combines the effect of a residual field and a discontinuity in the Actuator – Sensor path. The results indicate a phase shift in the signal at both frequencies. However, as it relates to a drop in amplitude, this seems to be more significant at the 200 kHz frequency in accordance to the actuation frequency (1/2 of the wavelength) and minimum detectable size. As such, it is possible to suggest from these numerical models and experimental results that a drop in the amplitude of the Lamb wave signals may be a combined effect between the generated stress field and the formation of a new crack surface, and that this effect is quantifiable. Thus, suggesting the possibility of developing linear elastic models that capture the interaction of phase shift and amplitude drop in Lamb waves and their corresponding interaction with closed fatigue cracks.
8.0
Conclusions
It can be concluded that the numerical models developed in this study were able to reproduce the reduction in the wave amplitude due to the presence of a small fatigue crack. This drop in amplitude was more significant in the Ao waves than the So waves at a higher frequency. The results also seem to show that the So wave amplitude seems to change very little in contrast to the Ao wave due to the presence of a discontinuity or a stress field in the region of a small crack for Lamb wave signals of 50 kHz and 200 kHz. The experimental findings and numerical results seem to indicate that small damages can be captured at frequencies much smaller than previously established [26]. However, at higher frequencies, there is a greater interaction between the wave and the damage / affected stress region, thus a larger detectable shift / drop in the acoustic-ultrasonic signal. The results presented here opens the possibility of modeling fatigue cracks as a change in the stress field in the proximity of the damage versus the traditional EDM notch commonly used by the SHM community.
Acknowledgments
The authors kindly acknowledge the support of NVIDIA Corporation and their donation of a TESLA K40 GPU hardware card to the Holistic Structural Integrity Process Laboratory at Clarkson University.
References
[1] C. Ramadas, A. Hood, I. Khan, K. Balasubramiam, M. Joshi; Transmission and reflection of the fundamental Lamb modes in a metallic plate with a semi-infinite horizontal crack; Ultrasonics 52 (2013) 773-781.
[2] Y. Lu, L. Ye, Z. Su, C. Yang; Quantitative assessment of through-thickness crack size based on Lamb wave scattering in aluminum plates, NDT&E International, 41 (2008) 59-68.
[3] B. C. Lee and W. J. Staszewski, Lamb wave propagation modelling for damage detection: II. Damage monitoring strategy, Smart Mater. Struct. 16 (2007) 260–274, doi:10.1088/0964-1726/16/2/004.
[4] Z.B. Yang, X.F. Chen, Yong Xie, H. Zuo, H.H. Miao, X.W. Zhang, Wave motion analysis and modeling of membrane structures using the wavelet finite element method, Applied Mathematical Modelling, Volume 40, Issue 3, 1 February 2016, Pages 2407-2420, ISSN 0307-904X, http://dx.doi.org/10.1016/j.apm.2015.09.071.
[5] P. Delsanto, T. Whitcombe, H. Chaskelis and R. Mignogna, Connection machine simulation of ultrasonic wave propagation in materials: I. The one-dimensional case Wave Motion 16 65–80. 1992 [6] P. Delsanto, R. Schechter, H. Chaskelis, R. Mignogna and R. Kline, Connection machine simulation of ultrasonic wave propagation in materials: II. The two-dimensional case Wave Motion 20 295– 314, 1994.
[7] P. Delsanto, R. Schechter, and R. Mignogna, Connection machine simulation of ultrasonic wave propagation in materials: III. The three-dimensional case Wave Motion 26 329–39, 1997.
[8] Y. Shen and C.E.S. Cesnik, Hybrid local FEM/global LISA modeling of damped guided wave propagation in complex composite structures, Smart Materials and Structures, Volume 25, Number 9, 2016.
[9] R.L. Lucena, J.M.C. Dos Santos, Structural health monitoring using time reversal and cracked rod spectral element, Mechanical Systems and Signal Processing, Volume 79, 15, Pages 86-98, ISSN 0888-3270, http://dx.doi.org/10.1016/j.ymssp.2016.02.044. October 2016
[10] H. Peng, G. Meng, F. Li, “Modeling of wave propagation in plate structures using three-dimensional spectral element method for damage detection”, Journal of Sound and Vibration 320 942–954, 2009. [11] W. Ostachowics, P. Kudela, M. Krawczuk and A. Zak, Book: “Guided Waves in Structure for SHM,
The Time-Domain Spectral Element Method”, Publisher, A John Wiley & Sons, ltd. 2012.
[12] J. Schijve, Fatigue of structures and materials in the 20th century and the state of the art, International Journal of Fatigue, Volume 25, Issue 8, August 2003, Pages 679-702, ISSN 0142-1123, http://dx.doi.org/10.1016/S0142-1123(03)00051-3.
[13] C. Garcia, T. Lotz, M. Martinez, A. Artemev, R. Alderliesten, R. Benedictus, Fatigue crack growth in residual stress fields, International Journal of Fatigue, Volume 87, June 2016, Pages 326-338, ISSN 0142-1123, http://dx.doi.org/10.1016/j.ijfatigue.2016.02.020.
[14] M. Yanishevsky, M. Martinez, C. Mandache, M. Khan, A. Fahr, D. Backman, D; Artificial seeding of fatigue cracks in NDI reference coupons; Insight-Non-Destructive Testing and Condition Monitoring; Volume 52 number 12, pp.664-671, 2010.
[15] F. Habib, M. Martinez, A. Artemev, M. Brothers, “Structural health monitoring of bonded composite repairs – A critical comparison between ultrasonic Lamb wave approach and surface mounted crack sensor approach”, Composites Part B: Engineering, Volume 47, April 2013, Pages 26-34, ISSN 1359-8368, http://dx.doi.org/10.1016/j.compositesb.2012.11.002.
[16] M. Martinez, L. Gang, D. Backman, A. Oudovikine, N. Bellinger; “Crack detection on composite and metallic aerospace structures”; Proceedings of 4th European Workshop on Structural Health Monitoring, , Krakow, Poland, 2-4 July 2008.
[17] Military Handbook, “Metallic Materials and Elements for Aerospace Vehicle Structures”, MIL-HDBK-5H, December 1st,1998.
[18] https://www.americanpiezo.com/apc-materials/physical-piezoelectric-properties.html, Last Accessed January 16-2017.
[19] F. Moser, L. Jacobs and J. Qu, “Modeling elastic wave propagation in waveguides with the finite element method,” NDT&E Int, pp. 32: 225-234, 1666.
[20] L. Chen, Y. Dong, Q. Meng and W. Liang, “FEM simulation for Lamb Wave evaluate the defects of plates,” Microwave and Millimeter Wave Circuits and System Technology (MMWCST), 2012. [21] ABAQUS 6.16 Analysis User's Manual'. Online Documentation Help: Dassault Systèmes. 2016 [22] http://www.acellent.com/en/ Last Accessed January 27th 2017.
[23] D. W. Greve, J. J. Neumann, J. H. Nieuwenhuis, I. J. Oppenheim and N. L. Tyson
"Use of Lamb waves to monitor plates: experiments and simulations", Proc. SPIE 5765, Smart Structures and Materials 2005: Sensors and Smart Structures Technologies for Civil, Mechanical, and Aerospace Systems, 281 (June 03, 2005);
doi:10.1117/12.599038; http://dx.doi.org/10.1117/12.599038
[24] L. Mallet, B.C. Lee, W.J. Staszewski and F. Scarpa; “Structural health monitoring using scanning laser vibrometry: II. Lamb waves for damage detection”, Smart Mater. Struct. 13 (2004) 261-269. [25] X. Wang, Y. Lu, and J. Tang; “Damage detection using piezoelectric transducer and the Lamb wave
approach: I. System analysis, Smart. Materia. Struct. 17 (2008) 025033 915pp), doi:10.1088/0964-1726/17/2/025033
[26] S.U. Zhongqing, L. Ye, Book Titled: “Identification of Damage Using Lamb Waves: from Fundamentals to Applications”, Published by Springer, Lecture Notes in Applied and Computational Mechanics, Volume 48, ISBN – 978-1-84882-783-7.
[27] P. Fromme, M. B. Sayir, Detection of cracks at rivet holes using guided waves, Ultrasonics; 2002, 40, 199–203.