Development of solutions to reduce variability in material flow at a
factory
by
Robyn Wen-Yi Lee
BEng Mechanical Engineering (with Business Finance) University College London, 2019
SUBMITTED TO THE DEPARTMENT OF MECHANICAL ENGINEERING IN PARTIAL FULFILLMENT OF THE REQUIREMENTS FOR THE DEGREE OF MASTER OF ENGINEERING IN ADVANCED MANUFACTURING AND DESIGN
AT THE
MASSACHUSETTS INSTITUTE OF TECHNOLOGY FEBRUARY 2021
©2020 Robyn Wen-Yi Lee. All rights reserved.
The author hereby grants to MIT permission to reproduce and to distribute publicly paper and electronic copies of this thesis document in whole or in part in any medium now known or
hereafter created.
Signature of Author: _____________________________________________________________ Department of Mechanical Engineering
October 4, 2020 Certified by: ___________________________________________________________________ Stephen C. Graves Abraham J. Siegel Professor of Management
Thesis Supervisor Accepted by:__________________________________________________________ Nicolas Hadjiconstantinou Professor of Chemical Engineering Chairman, Committee for Graduate Students
Development of solutions to reduce unevenness in material flow at a
factory
by
Robyn Wen-Yi Lee
Submitted to the Department of Mechanical Engineering on October 4, 2020, in partial fulfilment of the
requirements for the degree of
Master of Engineering in Advanced Manufacturing and Design Abstract
This thesis focuses on improving the flow of material in an analytical instrument company, the Waters Corporation. One main pain point experienced at Waters is an observed uneven distribution in when instruments were completed throughout the work week. In addition, limitations in the number of instruments that can be transported between the assembly area and the packaging department and packaged in a given work day resulted in the formation of a bottleneck at the site of transportation (a inter-floor conveyor belt). These limitations result in an inability to package and deliver all instruments produced within a given work week, causing a backlog of unpackaged instruments which spill over into the next work week. The aim of this project is to identify and develop solutions to the underlying issues causing the uneven material flow and bottleneck.
From the investigation, I identified two causes of the uneven flow. The first was a lack of incentive to build instruments one piece at a time. The second was that there were frequent delays in part delivery from external suppliers and internal processes, namely the machine shop, which delayed the completion of individual instruments and encouraged batching. From this, it was identified that one cause of the bottleneck in the conveyor belt was that items other than instruments, primarily empty bins, were also being transported using the conveyor belt.
To target these issues, I developed and analysed a number of solutions. The solutions ultimately selected were to utilize a daily quota schedule to incentivize producing instruments one piece at a time. Solutions targeted at reducing shortages in parts produced by the machine shop included holding increased safety stock to decrease the impact of uncertainties in the production of parts at the Waters machine shop and re-evaluating the scheduling system chosen for each part. These solutions, when combined, should result in a more even distribution of instrument completion throughout the workweek, reducing the observed build-up of instruments.
Thesis Supervisor: Stephen C. Graves
Acknowledgements
This project would not have been possible without the immense support I received over the last year.
To Yang, Daniel and Shum, thank you for being wonderful teammates. Without all your help, helping me teleconference into Waters from Singapore and discussing ideas, this project would not have been possible.
To Sonya, thank you supporting us throughout this project, helping us find the right people to talk to, keeping us on track, and helping us to maintain a healthy perspective throughout the COVID-19 crisis.
To the whole team at Waters, thank you for all the valuable input you provided to this project, and how giving you were of your time and energy.
To Prof Dave Hardt and Prof Stephen Graves, thank you for guiding us through the project and helping me to dig deeper to find the true underlying issues.
To the whole MEng, thank you for being a wonderful community, whether we were all together in Boston or apart.
To my family, thank you for always supporting me.
Table of Contents
Introduction ... 12 1.1 Motivation ... 12 1.2 Objective ... 13 1.3 Scope ... 14 1.4 COVID-19 Disruption ... 14 1.5 Task Division ... 151.5.1 Identification of problem areas ... 15
1.5.2 Solution Development ... 15
Background information ... 17
2.1 Waters Corporation ... 17
2.2 Waters Products and Services ... 17
2.2.1 Waters Services ... 18
2.2.2 Liquid Chromatography Instrument ... 18
2.2.3 Consumables ... 19
2.2.4 Mass Spectrometry Instruments ... 19
2.3 Waters- MIT Collaboration ... 20
2.4 Lean Manufacturing Principles ... 21
2.5 MRP system ... 22
2.6 Factory layout ... 23
Chapter 3 ... 31
Problem Definition ... 31
3.1 Pain point identification ... 31
3.2.1 Overall Process Flow ... 34
3.2.2 Preliminary Interviews ... 35
3.2.3 Process Map ... 38
Solution Generation ... 41
4.1 Root cause analysis ... 41
4.2 Potential solutions ... 43
Solution evaluation ... 47
5.1 Shift in weekly quotas ... 47
5.2 Daily quotas ... 51
5.3 Limitation of bin & lower priority part transportation to off peak days ... 52
5.4.1 Deep Dive: Serpentine Tubing ... 59
5.4.2 Solution Generation ... 63
Evaluation of Combine Effect of Solutions ... 67
6.1 Future State of Material Flow ... 67
Future work ... 70
Conclusion ... 73
List of figures
Figure 1: Factory layout ... 24
Figure 2: eKanban rack ... 27
Figure 3:Conveyor belt ... 28
Figure 4: Average percentage of instruments sent each day of the week in 2019 ... 32
Figure 5: Backlog of instruments at the start of the work week ... 33
Figure 6: Current Process Map ... 38
Figure 7: Root cause analysis diagram ... 41
Figure 8: Product lines grouped by number of weeks of production ... 48
Figure 8: Multipurpose utilization of bins ... 54
Figure 9: Informal bin storage area ... 54
Figure 10: Line down instances by supplier ... 56
List of tables
Table 1: Total instrument shipment by week ... 33 Table 2: Number of product lines grouped by number of production weeks ... 49
Chapter 1
Introduction
1.1 Motivation
One main challenge faced by any factory is in efficiently managing material flows. This involves ensuring that material is available at the relevant department as and when it is needed, while also holding as little inventory as possible. Meeting both of these aims requires significant coordination, both externally between the manufacturer (Waters) and its suppliers, and internally between different departments. To achieve this, information must flow smoothly between the various parties, and the relevant physical infrastructure, along with Standard Operating Procedures (SOPs) must be in place so that material can be physically transported quickly between departments. Without smooth information flow, different parties would have no means by which to know when and how much material is needed. Without the appropriate infrastructure, different groups would be unable to react quickly to information received, slowing down operations and unnecessarily wasting time. For any individual product, determining the most effective material flow is often simple, but once multiple products are considered, along with frequently limited capacities, determining a system that is overall most efficient often proves to be a challenge. Oftentimes when issues arise, the underlying cause is not the site of the issue but some upstream issue. In addition, many solutions to issues are formed on the fly, and depend on the individual doing the job. As such, underlying issues may not appear until
individuals leave the factory, without conveying their ad hoc fixes formally to others within the factory.
This project was carried out in conjunction with Waters, an analytical chemical equipment designer and manufacturer based in Milford, Massachusetts. The Waters Milford factory is their main site of operations. The aim of this collaboration is to improve the flow of material in the Milford factory.
Within the Milford factory the assembly department is located on the second floor, whereas material receiving and packaging are located on the first floor. In order for material to flow effectively between these three locations, Waters has chosen to employ a central conveyor belt to bring parts and materials to assembly from receiving, so that they can be assembled into either kits or finished instruments at assembly and then sent to packaging. This conveyor belt serves as the main method for transporting material between these three locations, and thus it is essential that the conveyor belt does not become a bottleneck in the process.
1.2 Objective
The objective of this project is to improve the flow of material within the Waters Milford factory. We do this by first analysing the existing material flow. We then identify and analyze existing issues using a material flow map. These issues would then be analysed, and appropriate solutions suggested for these areas. A future state of material flow would then be developed.
1.3 Scope
The scope of this project was limited to analysing bottlenecks due to issues in planning and coordination. Though technical limitations of current methods were taken into account, technical improvements to systems were not included.
In addition implementation of these solutions and development of full pilot tests were excluded, due to the timeframe of the project. Implementing these solutions could be considered for future projects.
1.4 COVID-19 Disruption
Due to the COVID-19 disruption, the timeframe of the project was reduced from 6 months to 3 months. In addition, the writer was obliged to operate remotely from Singapore. As a result all interviews and factory observations were conducted via internet conferencing. All other teammates were granted onsite access from the 3rd week of July 2020. In addition factory operations and manpower were lower than typical levels. To account for this, data from 2019 was used as a representation of typical factory operations.
1.5 Task Division
1.5.1 Identification of problem areas
The initial analysis of the material flow was developed as a group. The main problem areas were determined, and individual theses exploring these problems, along with various solutions were developed.
1.5.2 Solution Development
The author of this thesis focused on resolving issues due to unevenness in the material flow. Yang Wang’s thesis focused on developing a solution to the eKanban problem. [1]
Chapter 2
Background information
2.1 Waters Corporation
Waters Corporation was founded in 1958 by Jim Waters as a research firm [2]. Over the years, the firm grew from a basement office in Framingham, Massachusetts to an organization with facilities in 35 countries [3]. Their headquarters located in Milford, Massachusetts contains their primary research division, along with their Advanced Manufacturing Center. Waters expertise in chemical analytical techniques pertaining to liquid chromatography and mass spectrometry has propelled them to become a $1.9 billion corporation [2]. Waters mission to “Deliver Benefit” is assumed by a workforce of over 7,000 employees [3]. The company is divided into two segments, Waters and TA. Waters focuses on Liquid Chromatography – Mass Spectrometry (LC- MS) instruments and columns, whereas TA focuses on thermal analysis, rheometry, and calorimetry instruments [4].
2.2 Waters Products and Services
Waters provides analytical equipment for laboratory services to over 40,000 customers around the world. Fifteen manufacturing facilities produce key analytical and laboratory equipment [3]. These services span a wide spectrum, from quality and reliability control to data analysis [5]. Their products include LC-MS instruments, laboratory informatics, and chromatography consumables.
2.2.1 Waters Services
Waters offers support services designed to improve their clients’ workflow and satisfaction. Their customer success portal offers a wealth of knowledge regarding Waters products. Their online portal allows clients to request spare parts and select the right chemistries for consumables. Waters ensures lasting quality of their products with their instrument services. Along with their software, these services allow clients to validate their systems to maintain compliance. In 2019, these services compromised 35% of revenue for the company [4]. Their primary competitors include Agilent Technologies, Thermo Fisher Scientific, and PerkinElmer [4]. Waters ensures that clients can unlock the full potential of their products through these services.
2.2.2 Liquid Chromatography Instrument
Waters’ liquid chromatography instruments consist of their High-performance liquid chromatography and ultra-performance liquid chromatography lines. The purpose of these instruments is to breakdown a sample and measure the number of unique chemical components that exist within. UPLC differs from HPLC in that it uses smaller particles in its packed columns. Combined with a novel instrument, this allows for testing a wider range of analytes, with improved processing speeds [4]. The Milford, Massachusetts facility is the primary producer of their LC product line.
They primarily serve life science and pharmaceutical industries, as these can be used to develop new drugs and ensure their quality. Additional applications in the consumer product, chemical,
and environmental industries also exist. Waters offers flexibility in the deployment of their instruments from client to client. They tailor their HPLC and UPLC instruments to needs of their consumer and offer different levels of process automation.
2.2.3 Consumables
The LC instruments require consumable products that must be replenished over time. The primary consumables are chromatography columns. Chromatography columns are essentially steel tubes packed with material that is used as a separation medium. The interactions which take place within the columns allow for classification of various chemical components within a sample. Waters manufactures all parts of the column, from the polymer-based packing material to the column itself. The vertical integration of column manufacturing allows Waters to maintain a high level of quality and respond quickly to customer needs [4].
2.2.4 Mass Spectrometry Instruments
In addition to Liquid Chromatography (LC) instruments, Waters also produces Mass Spectrometry (MS) and LC- MS instruments. MS technology allows for chemical identification and quantification through analysis of molecular mass. Waters has recently begun integrating their LC and MS systems, as clients tend to use them together. Facilities in Wilmslow, England and Wexford, Ireland produce their MS product line [4]. They manufacture a range of MS instruments and
software platforms to fit client needs. Waters constant innovation and production of quality LC- MS instruments has elevated them to one of the global leaders in this industry [4].
2.3 Waters- MIT Collaboration
Waters and MIT have been collaborating since 2013. Each year, Masters students in the Advanced Manufacturing and Design program at MIT have taken on projects to improve the manufacturing capability and operational efficiency of Waters. For example, students in 2018 focused on optimizing inventory location in the Global Distribution Center located in Franklin, Massachusetts [6], [7]. In 2019, students developed an automated vial inspection system [8], [9].
This year, four students from MIT are working with Waters. Daniel Hsu and Nagashumrith Vinakollu are analyzing methods to improve the signal intensity of a Waters MS system through modifications to the ion transfer capillary[10 & 11]. My project, in collaboration with Yang Wang, focuses on improving the flow of material in the Milford, Massachusetts facility. Yang Wang’s project focuses on improvements in the eKanban system implemented at Waters.[1] My project focuses on addressing the unevenness in material flow occurring on the conveyor belt that transports parts and kits to assembly and finished assemblies to packaging.
2.4 Lean Manufacturing Principles
One overarching principle behind Water’s attempts to improve the flow of material is Lean manufacturing. Lean manufacturing, as pioneered by Toyota within the Toyota Production system, is an overall philosophy that encourages the usage of as little resources as possible. Typically, there are seven key ‘wastes’ identified, being “overproduction, excess inventory, waiting, transportation, unnecessary motion, overprocessing and defects”. The main wastes targeted for this project are excess inventory and waiting. Keeping excess inventory low prevents the usage of floor space that could otherwise be used for more productive means. Keeping waiting time to a minimum reduces lead times, improving responsiveness and reducing the impact of fluctuations in demand on production.
To achieve lean manufacturing, one of the main methodologies employed at Waters is that of Just-In-Time. This entails producing products only when required, in the amount required and at the time that it is required. Companies that do so are able to keep their inventory holding to a minimum, and ideally keep waiting time to a minimum. Doing so requires improvements in the supply chain, manufacturing process, and information flow.
One primary concept of Just-In-Time is continuous flow. Within continuous flow, work is advanced in small batches (ideally batch size of one) through the processes with little to no waiting time between processes. This practically cuts down on waiting time. To achieve this, in practice batch sizes must be cut down to as small an increment as possible, so that after each process is completed the work in progress (WIP) can move onto the next process as quickly as
possible, without having to wait for a large batch to be completed. Continuous flow also has the benefit of regulating the volumetric flow of material through the plant. Since products are completed in small batches/single pieces, the number of pieces of WIP that will be brought to any given step in the process is low. This helps prevent a bottleneck situation where the machine/process is overburdened, slowing down the process and increasing overall lead time due to added wait time.
In practice, the demand for a product at any given point in time varies. As such, producing products perfectly to demand is often impossible, or would require that customers wait for a significant amount of time as the product is built from scratch after the order is placed. Thus, often Just-In-Time production is timed according to Takt time. Takt time is the pace at which products would have to be produced to meet total demand for a period. This is found by taking the total time available for work in a period divided by the total demand for that period. Takt time serves as a useful benchmark by which companies can evaluate their processes, and determine which processes to improve. Improving processes that take less than takt time would be an inefficient use of effort, since improving would not enable the serving of more customers.
2.5 MRP system
One of the most common methods of planning factory flow is the utilisation of a digital material requirements planning (MRP) system. These systems take into account the planned lead times needed to produce each product, the material requirements, and the forecasted demand for the
product to ideally determine a production schedule that keeps inventory as low as possible. It also adjusts the schedule as and when issues arise, such as material shortages. These systems enable smooth communication between different departments in the factory, enabling the smooth functioning of the factory. Currently Waters utilises SAP as their MRP system.
2.6 Factory layout
Waters manufactures a wide range of products, often using a mixture of parts procured from external suppliers and parts produced in house. Transporting materials between suppliers and Waters, along with internally within Waters between departments, requires coordination and planning to ensure that the waiting time between departments is as low as possible. From tours of the factory, in conjunction with the other members of the Waters – MIT team, the following floor map was assembled. This map lays out the overall flow of material within the Waters Milford factory for all product lines produced there. The flow of material begins with receipt of raw materials at the receiving department, through various intermediate processing steps, until completed instruments are shipped out from the shipping department.
Fi gu re 1 : F ac to ry la yo ut No te : NP I = Ne w Pro du ct I ntro du cti on , H D = H igh D en si ty , LD = Lo w D en si ty
Of particular note is the flow of material between the assembly/production department and the packaging/kitting department. The former is situated on the second floor of factory, while the latter is situated on the first. To transport various items (completed instruments, parts for kits, empty bins) between the floors, Waters utilizes a conveyor belt.
The assembly floor is organized largely into individual work cells. Typically, one individual is responsible for fully assembling an instrument. Each individual at the start of the week is assigned a manufacturing order, for which they are typically responsible. A manufacturing order consists of a week’s worth of production for a given instrument or sub-assembly as can be done by one individual, as determined by the production plan. These decisions help to reduce the amount of time spent moving between processes and individuals. There are however, exceptions, depending on the batch size being produced and the complexity of the operations involved. Prior to the start of the work week, the raw materials and parts needed for the work week’s manufacturing orders are gathered at pre-packaging and sent to the assembly floor, so that at the start of the work week technicians can easily gather the raw materials they need for their respective instrument or sub-assembly.
Information flow pertaining to material management between departments is typically coordinated by either SAP or Kanban cards. For specialised parts, such as specific tubing parts or valves designed for specific instruments, typically production at each department is coordinated via SAP. This helps to ensure that enough lead time is allocated for each department to finish the
relevant processes on the part, so that the part is ready and available for the next department when it is needed. For more generic parts that are shared between different instruments, such as screws and washers, a kanban card is used. The usage of these parts across a wide range of instruments makes tracking the individual number of parts used difficult. In addition, since these can often be purchased from suppliers with little lead time, forward planning is often unnecessary, making the kanban card system more appropriate due to its simplicity and effectiveness.
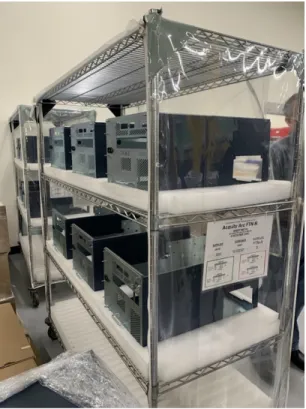
For communicating with external suppliers, two main systems are used. For most suppliers, based on SAP planning, purchase orders are sent. Suppliers respond accordingly, supplying the appropriate parts or raw materials. This process typically has a significant lead time, particularly if the requested parts are produced to order. Waters has attempted to reduce this lead time, and therefore the amount of inventory it has to hold, through the use of an electronic eKanban system. Within this system, purchase orders are sent to participating suppliers detailing the demand for the quarter. Suppliers then prepare parts in advance. Parts are delivered in racks of a predetermined size.
Figure 2: eKanban rack
Parts are pulled from the rack until it is emptied. When this happens, the barcode attached to the front of the rack is scanned, sending a signal to SAP indicating that the rack has been emptied. This then sends a signal to the supplier, indicating that an additional rack is needed. The supplier then brings a full rack of inventory, and reclaims the emptied rack; according to the purchase order placed at the start of the quarter, the supplier makes a replenishment delivery the morning after receiving the Kanban signal. This approach significantly reduces the replenishment (or resupply) lead time, since parts are prepared significantly ahead of schedule. Waters therefore needs only to hold a day of inventory, in anticipation of the time between the signal that a rack has been depleted and the subsequent delivery of a fresh rack of parts.
Figure 3:Conveyor belt
One of the primary methods of material transportation within Waters is the conveyor belt transporting material between the 1st and 2nd floors. Two conveyor belts run in parallel, with one belt transporting material from the 1st to the 2nd floor, and the other transporting material from the 2nd to the 1st floor. These conveyor belts consist of a horizontal belt and a vertical lift system. The conveyor belts can be independently controlled. Raw material and parts are transported from the pre-packaging area to the assembly floor. Using these, instruments and sub-assemblies for future kits are assembled at the assembly floor. These instruments and sub-assemblies are then transported from the assembly floor on the second floor to the packaging/kitting area on the first floor. Once at the packaging area, instruments are packaged and then removed from the conveyor belt. During packaging of an instrument the downward travelling conveyor belt is stopped. Once the instrument has been packaged and removed, the conveyor belt is allowed to move, bringing in the next instrument for packaging and removal. This conveyor belt enables the
quick transportation of goods between the two floors, reducing the time wasted in transportation and the manpower needed for transportation if more conventional methods (e.g carts) were used.
Chapter 3
Problem Definition
3.1 Pain point identificationOne identified pain point was existing ineffectiveness in the eKanban system. Waters has an eKanban agreement with three of its suppliers. Recently, however, one supplier has rescinded its participation, opting instead to send parts on a weekly schedule according to weekly purchase orders. Though this was in part due to reduced demand as a result of the COVID-19 pandemic, it was due in part also to frustrations felt by suppliers caused by difficulties in the eKanban process. Oftentimes empty racks are either not scanned or scanned multiple times, giving suppliers an inaccurate count of how many fresh racks need to be sent over and of how many empty racks to anticipate retrieving.
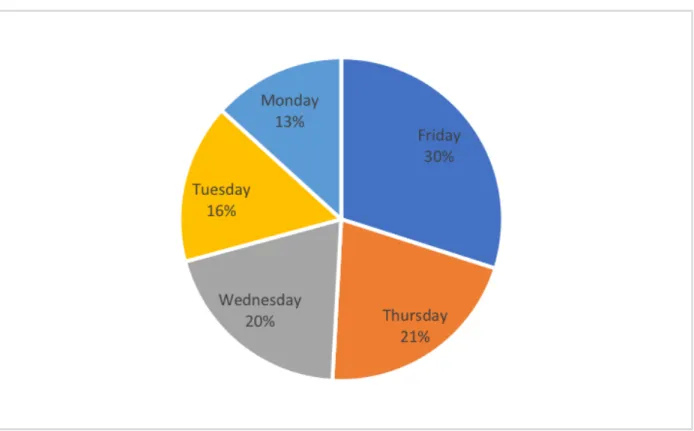
Another identified pain point was frequent backlogs in instrument transport from assembly on the second floor to the packaging department on the first floor via the conveyor belt. At the start of the work week (Monday and Tuesday) few instruments are transported via the conveyor belt. As the week progresses, the number of instruments transported via the conveyor belt each day increases, resulting in a significantly higher number of instruments being transported per day at
the end of the week. The average percentage of instruments produced weekly that were sent via the conveyor belt each day is shown in Figure 4.
Figure 4: Average percentage of instruments sent each day of the week in 2019
This increase in number of instruments results in the conveyor belt being over-burdened. Packaging each instrument requires a fixed amount of time. Thus, only a limited number of instruments can be packaged each day. In addition, instruments are only removed from the conveyor belt once packaged, controlling the rate at which items can be transported via the conveyor belt. If more instruments are produced at the end of the week than can be removed during the day, a backlog builds up at the conveyor belt. This backlog consists of the queue of items to be placed on the conveyor belt for transportation. The conveyor belt and packaging process form a bottleneck that controls the rate at which instruments can be packaged and
transported to shipping for delivery to customers. This is evident in the number of instruments shipped out per week. In theory, the single individual in charge of packaging can package 110 packages a week. The actual number of instruments shipped out each week for the first six weeks of the quarter were much lower, as shown below. Please note that as a result of Covid-19 the first week of the quarter was severely disrupted, resulting in zero instruments being shipped out.
Week Instruments Shipped
Q3 W1 0 Q3 W2 56 Q3 W3 74 Q3 W4 66 Q3 W5 67 Q3 W6 98
Table 1: Total instrument shipment by week
As a result of the increase in the number of items sent on Friday and Thursday, often not all instruments sent on those days can be packaged within the normal workday. This often spills over in the form of unpackaged instruments awaiting transportation on Monday.
This has two negative consequences for Waters. The first is that if instruments that cannot be packaged on the Friday spill over to the next Monday, Waters would be unable to ship out those instruments on time to customers, negatively impacting their brand image. The second is that, if a late delivery is deemed unacceptable, staff would need to work overtime to ensure that the instrument can be shipped out on time, incurring extra costs for Waters. Both of these outcomes cost Waters, either in reputation or in monetary terms. If Waters were able to evenly distribute the quantity of instruments produced per day across the week, all products could be packaged within the normal working week, negating the issues observed.
3.2 Identification of Underlying issues
To identify the various causes of the back up on the conveyor belt at the end of the week, interviews were conducted with various managers within Waters to understand their perspectives. In addition, data was collected to reflect which specific instruments reflected issues. From these, a current state value stream map was created. This was done to provide an overview of existing material and information flows, as well as highlight problem areas.
3.2.1 Overall Process Flow
Beginning with the planning department, planners use the estimated demand for the quarter (based either on known orders or forecasts) to determine the number of products to be produced per week of the quarter. Planners input this data into SAP, along with the material needed, to determine the appropriate schedule for when each intermediate process needs to take place.
Using this plan the relevant material and parts are ordered from suppliers. For the purposes of this project, only materials and parts delivered to receiving and the machine shop were considered. Once the material is received at the machine shop, the machine shop then prepares parts as needed at the assembly area, as coordinated by SAP. These parts are then delivered from the machine shop to the assembly floor, where they are assembled into instruments. These instruments are transported via the conveyor belt to the packaging area, where they are packaged for delivery.
3.2.2 Preliminary Interviews Paul Beggs, Operations Supervisor
The first interview conducted was with Paul Beggs, the operations supervisor. His role in Waters is to oversee the assembly area, and to manage the various personnel there. This interview shed some insight into the process flow for translating ad hoc instrument orders into a weekly schedule for personnel. The assembly area is organized into individual work cells, so that each instrument can be assembled within one cell. Each individual takes charge of a single manufacturing order, and is responsible for assembling the order throughout the week. A manufacturing order indicates to the recipient how many of a single instrument or sub-assembly that he or she must assemble in the given week. The parts needed to assemble each instrument are combined into kits, so that once a manufacturing order is received each technician can quickly retrieve the appropriate kit and begin assembly of the instrument.
Technicians are evaluated based on their ability to meet their weekly quota by the end of the work week (Friday). Technicians are also instructed verbally to build pieces using single piece flow as far as possible. However, in practice there technicians are free to assemble instruments in whatever order they would like, so long as all are completed by Friday. As such, what is frequently observed is that technicians often batch instruments together, finishing their weekly quota only at the end of the week. The batching behavior was evident from the sequence in which instruments are placed on the conveyor belt. Each technician typically takes charge of one manufacturing order, and is responsible for completing the order throughout the week. The technician assembles each instrument through all the required assembly steps. If instruments are assembled one at a time, completed instruments from the same order (and therefore of the same SKU) should be placed on the conveyor belt throughout the week. However often multiples of the same instrument are placed onto the conveyor belt at the end of the week, indicating that all instruments were completed in a batch. This has been attributed to the end of week evaluation. Since there is no metric evaluating whether technicians are producing one piece at a time, there is no incentive for employees to assemble instruments one piece at a time. In addition, batching reduces the amount of work each worker needs to do without affecting their ability to meet their quotas.
Another issue that was raised during this interview was that empty bins were also being transported between areas using the conveyor belt. Plastic bins are frequently used to transport a variety of parts from the pre-processing area to the assembly area. Once these parts are received, the plastic bins are placed onto the conveyor belt for transportation down to the
packaging area, where they are removed from the conveyor belt and returned to the pre-processing area. This occurs as and when personnel feel it is necessary, with no standard operating procedures (SOP) governing when the bins can be placed. Using the conveyor belt to transport empty bins from the assembly floor to the packaging area take space and time away from packaging instruments. When empty bins are received at packaging, the packaging personnel is in charge of removing the empty bin and moving it to the pre-packaging area, using up time that could instead be spent on packaging instruments. Since the conveyor belt serves as the primary means by which instruments can be transported between floors, added items on the conveyor belt decreases the rate at which instruments can be transported via the conveyor belt, slowing down the rate at which finished instruments can be packaged and shipped out.
Roland Poisson, Senior manufacturing engineer
The second interview conducted was with Roland Poisson, a senior manufacturing engineer. He had previously been working on a project to address the conveyor belt congestion. From his investigation he found that one major reason for the observed batching of instruments towards Thursday and Friday was due to material shortages earlier in the week. Each manufacturing order is sent to the assembly floor on Monday, after which the materials needed to assemble the instrument are gathered. At this point any material shortages would be recorded. Often material shortages are not resolved until later on in the week. As such, in order to fully utilize their time, employees will build multiple instruments up to the point at which the missing material is
required. This causes a batch of half built instruments to be built until the material shortage can be resolved, at which point all instruments are completed.
3.2.3 Process Map
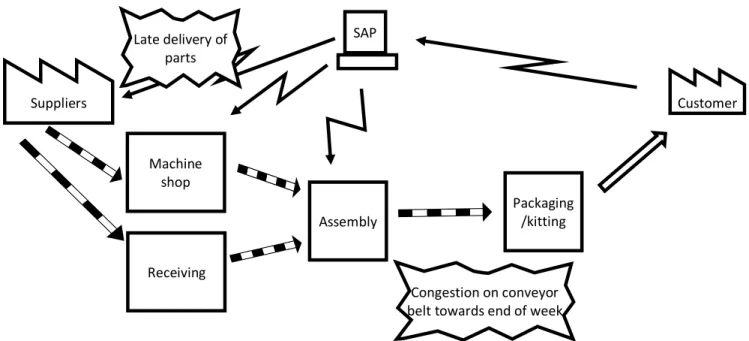
Having determined the overarching flow of material and information through the factory, a process map was developed to provide a visual representation of the factory. This map highlights both material flow and information flow. The former is indicated via a striped arrow, and the later by a zigzag arrow. It provides users with a high level view of production, so that the overall process flow can be evaluated, taking into account both individual processes and the interactions between processes. It serves as a useful tool for evaluating the relationships between various departments, and identifying upstream issues that could be causing downstream effects.
Figure 6: Current Process Map Suppliers Machine shop Receiving Late delivery of parts Assembly SAP Packaging /kitting Customer Congestion on conveyor belt towards end of week
Chapter 4
Solution Generation
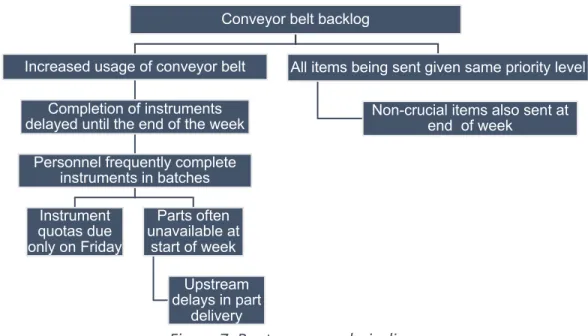
4.1 Root cause analysisUsing the information gathered, I conducted a root cause analysis to investigate the underlying causes of the observed backlog of instruments awaiting transportation via the conveyor belt.
Figure 7: Root cause analysis diagram
The first was that a lack of incentive to build instruments one at a time resulted in employees batching instruments based on their weekly quotas. As previously mentioned, workers produce according to a weekly schedule. Thus, for workers, there is no difference between completing instruments evenly throughout the week and completing all instruments only on Friday. As such,
Conveyor belt backlog Increased usage of conveyor belt
Completion of instruments delayed until the end of the week
Personnel frequently complete instruments in batches Instrument quotas due only on Friday Parts often unavailable at start of week Upstream delays in part delivery
All items being sent given same priority level Non-crucial items also sent at
workers often complete the assembly of instruments in batches, as batching typically takes less time due to time saved in setup and in moving between assembly stations for various steps. This completion of multiple instruments at the end of the week then results in all completed instruments needing to be packaged at the end of the week. This overburdens the packaging area at the end of the week, resulting in an inability to package all completed instruments by the end of the week. A fixed number of instruments can be placed on the downward conveyor belt at any given time, and as such once the conveyor belt reaches its maximum capacity new instruments can only be placed on the conveyor belt once an instrument has been packaged and removed on the other end. The instrument backlog is therefore observed as a queue of instruments in the assembly area, awaiting placement on the downward travelling conveyor belt.
The second was that the conveyor belt was used for transportation of items other than completed instruments, such as empty bins and parts for kits. Raw materials and parts are often placed into plastic bins for transport via the upward travelling conveyor belt from the pre-packaging area on the first floor to the assembly area on the second floor. Once the raw materials and parts have been received in the assembly area, the now emptied plastic bins are typically returned to the first floor using the downward travelling conveyor belt. On peak period days, these emptied bins use up a slot on the conveyor belt that could otherwise have been used for the transportation of an instrument, slowing down the overall flow of instruments between floors and increasing the backlog of instruments, reducing the number of instruments that can be transported via the conveyor belt in a day and therefore reducing the number of products
Waters can ship out at the end of the week. In addition, the increased backlog hinders assembly, as technicians now need to take the time to find an informal space to place the finished assembly.
The last was that upstream delays in part delivery caused employees to partially complete multiple instruments towards the start of the week in an effort to fully utilize their time. From anecdotal discussions, we learned that frequently instrument assembly was disrupted by a shortage in parts. To fully utilize their time, technicians, when faced with a shortage, often opt to start the production of the next unit needed. Once the shortage is resolved, the technician then completes all units. This results in the production of multiple partially completed units during the work week, which are only completed at the end of the week, causing the instrument backlog seen.
4.2 Potential solutions
From the identified root causes, we generated multiple potential solutions .
One potential solution would be to stagger the due date for different instruments across the work week. Currently, the due date for all instruments is at the end of the work week on Friday. The staggered solution would entail organizing instruments into groups. The quota for the first group would be evaluated on a Monday to Monday basis, the second on a Tuesday to Tuesday basis, and so on for the remaining groups. These groups would be determined based on the demand for each instrument, so that the total number of instruments due each day is roughly
the same. By doing this, the peak in instrument production observed towards the end of the week would instead be distributed throughout the week, evening out the overall flow of material within the factory.
The main benefit of this approach is that it does not require changes in the behavior of employees. Since quotas continue to be evaluated in weekly increments, employees would be free to continue producing instruments in batches. Batching reduces the amount of time spent producing each instrument, as it reduces time spent moving between work stations, along with setup times. As such, from the perspective of employees batching instrument production is preferable. In addition, using a weekly quota gives workers flexibility in the event of delays in part delivery. Since employees have a full week to complete instruments, in the event of a part delay employees can choose to partially complete multiple instruments, fully utilizing their time rather than forcing them to be idle while they await the arrival of the needed parts. Furthermore, it is often difficult to convince employees to change their habits without resulting decreases in employee satisfaction. A solution that allows employees to continue their batching behavior would therefore be preferable, as it enables employees to continue their time saving activities and prevents dips in morale.
To address the lack of incentives to build to instruments one at a time, one potential solution would be to utilize a daily quota instead of a weekly quota. Utilizing a daily quota would necessitate employees producing instruments in smaller batches, smoothing out the flow of finished instruments throughout the week. One benefit of this approach is that it would directly
address the behaviors causing the uneven rate of instrument production, preventing the reoccurrence of the issue.
To address the lack of prioritization in determining what items are transported using the conveyor belt, one potential solution would be to limit the transportation of empty bins to the start of the week. This would redistribute the transportation of empty bins, evening out the overall flow of material via the conveyor belt.
One further solution would be to determine the underlying causes of the part shortages. Doing so would ensure that employees always have access to needed parts, enabling the building of instruments one instrument at a time, smoothing out the production of instruments throughout the week.
Chapter 5
Solution evaluationTo evaluate the efficacy of the proposed solutions, various stakeholders within Waters were interviewed. These interviews covered general processes in Waters, what had been done in the past, along with each stakeholder’s perspective on the solution. Furthermore past data was utilized to determine the feasibility of various solutions.
5.1 Shift in weekly quotas
For a shift in the production schedule to be effective, certain conditions must first be met. The first is that the variation in planned production from week to week must be low. For a shift in schedule to be effective, the number of completed instruments and sub-assemblies produced each day must be fairly equal across the week. If the quantity produced of each instrument varies significantly week to week, the number of instruments due from day to day would also vary. If the demand in a particular week in any given group happens to be high for multiple instruments in the group, the number of instruments produced at the end of that quota week would be high, which could potentially result in a peak period day wherein more instruments than can be transported and packaged within the day are completed. The second is that it must be possible to adjust the work order issue date independent of the planned schedule. Using the new scheduling method, work orders would be issued on different days throughout the week, based on when that instruments weekly quota was due. This could raise issues if the assembled sub assembly is needed for another instrument that is to be built in the next quota period. To
overcome this the links between each sub assembly and the instruments that use them would need to be considered, and this could potentially prevent the creation of an evenly distributed schedule.
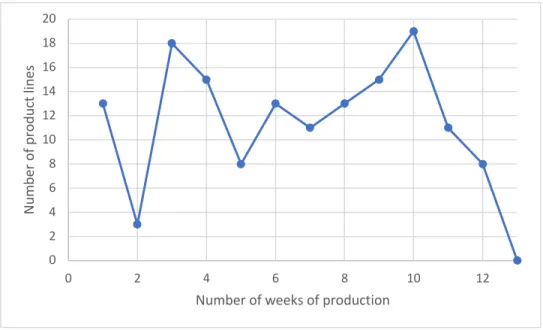
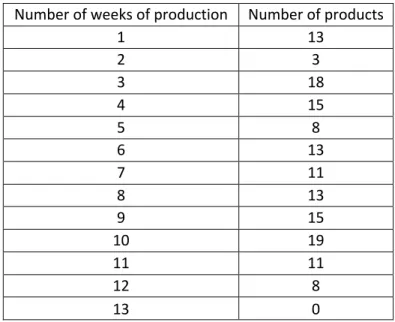
To determine if such a solution would be possible, data reflecting the planned production of each instrument and sub assembly for each week of the 3rd quarter of 2020 was obtained and analyzed. From the planned production schedule we see that not all items were assembled every week. In weeks when assembly was taking place for the given instrument/sub-assembly the variation between the quantity produced each week was low. However the on/off nature of the production schedule resulted in significant variation in production between all weeks. 147 instruments and sub-assemblies were analyzed. The number of weeks during which each product was produced (an ‘on’ week) was counted, and products were grouped according to, out of 13, how many weeks they were produced.
Figure 8: Product lines grouped by number of weeks of production
0 2 4 6 8 10 12 14 16 18 20 0 2 4 6 8 10 12 Nu m be r o f p ro du ct li ne s
Number of weeks of production Number of products 1 13 2 3 3 18 4 15 5 8 6 13 7 11 8 13 9 15 10 19 11 11 12 8 13 0
Table 2: Number of product lines grouped by number of production weeks
Due to the high variance in week on week production, using the current method of production planning, staggering when weekly quotas are due would not be feasible. This could however be overcome if the production plan could be altered such that weekly production is more even.
To determine if adjusting the overall schedule would be feasible, an interview was conducted with Sharon Bibbo, a senior planner at Waters. From discussions with her the specifics of how Waters plans its production schedule were explained, along with an evaluation of the proposed change in quota due dates. Beginning with the forecasted demand for the quarter, for each instrument the total forecasted demand is evenly distributed across the quarter. Based on this plan, the various sub-assemblies needed for the production of each instrument are automatically planned for using the MRP system, taking into account the lead time necessary to produce these parts. From this schedule, in conjunction with the appropriate assembly floor manager,
adjustments are made to accommodate irregularities that cannot be captured by the digital planning, such as known changes in manpower during the quarter.
In discussing the on/off nature of the existing production plan, the considerations behind the plan were highlighted. The first was that fully distributing parts across all weeks evenly would result in small batches, which are inefficient due to various economies of scale in production. From a planning perspective, the same amount of work must be done to issue each manufacturing order, regardless of the size of the order. Thus it would be more efficient to issue one order for ten parts in one week, rather than to issue ten orders for one part across ten weeks. From the perspective of assembly floor employees, for certain items it is significantly more efficient to produce multiple weeks’ worth of parts in a single week, rather than to repeat the same smaller order across all weeks. The second was that it would not be possible to adjust all quota due dates for each individual instrument or sub-assembly independently, due to the links between the sub-assemblies and the instruments. The third was that the fine tuning that currently takes place would need to be replicated frequently for the new quota schedule to be feasible.
Due to the trade-offs between the additional work that would be generated, such as increased manufacturing orders and the regular fine tuning that would be required, along with the uncertainty in the level of smoothing that could be achieved using these methods, it was determined that staggering when production quotas are due throughout the week was an infeasible solution at this time.
5.2 Daily quotas
For switching from a weekly quota to a daily quota to be effective, the setup time for each assembly step must be small relative to the processing time. Setup time is the time needed to switch production on a machine from the previous part to the next. Since this only needs to be done when switching between product types, if the setup time is significant it would be more efficient to batch orders together, reducing the overall time taken to produce the same number of parts. Implementing a daily quota would reduce the assembly batch sizes, increasing the overall setup time needed to produce the same number of instruments. If the increase in setup time is too much, Waters would no longer be able to produce the same quantity of instruments or sub-assemblies in the week.
In practice, the daily quota would need to capture both completed instruments and work in progress. Certain instruments could take multiple days to assemble. To track the daily progress in assembly, daily goals would need to indicate which step technicians should have reached by the end of the day.
For certain parts, such as sub-assemblies, implementing a daily schedule might have little impact. Sub-assemblies are typically produced in much larger batches, due to more significant economies of scale which can be garnered from batching, such as reduced total setup time. In addition, they typically take up less space per piece on the downward conveyor belt, as whole batches are
typically transported together. For such parts maintaining the same weekly quota system would likely be most appropriate.
Due to the short time frame within which the investigation was conducted, data on set up times and production times could not be obtained. As such the effectiveness of a daily quota could not be fully explored. In the future if a daily quota is considered, so long as the above criteria are met, a daily quota may be possible, and would likely improve the backlog issues seen.
5.3 Limitation of bin & lower priority part transportation to off peak days
One possible issue that could arise from limiting bin and lower priority part transportation via the conveyor belt to off peak days is that there could arise a shortage of empty bins on peak period days. During the transportation of raw materials and parts from the pre-packaging area on the first floor to the assembly area on the second floor, the raw materials and parts are typically placed into large blue bins, which are then in turn placed on the conveyor belt. Once these raw materials and parts have been removed from the bins, the now emptied bins are then placed on the downward travelling portion of the conveyor belt, alongside completed instruments and sub-assemblies, so that they can be returned to the pre-packaging area on the first floor and used for subsequent deliveries of raw materials and parts. If bin transportation is limited to non-peak days, empty bins would build up on peak days. If all bins have been used to transport items up to the assembly floor it is possible for the supply of empty bins on the first floor to run out. This would
fully stop the transportation of parts from the first to second floor, significantly disrupting assembly and halting a significant portion of assembly. To prevent this from happening, it may be necessary to increase the number of bins to be sufficient to meet the demand for bins on peak period days.
To evaluate the potential for such a solution, an interview was conducted with Michael Doyle, a production manager with Waters. His role involved the management of a number of product lines within assembly, along with having led several previous improvement projects.
During this discussion it was highlighted that a similar project limiting the usage of bins had been undertaken in the past, which resulted in a shortage of bins. As such, given the current number of bins and the current utilization of bins, implementing a limit on when bins could be transported would not be feasible.
To gain a deeper understanding of the underlying issues surrounding bin usage, along with determining what changes would need to be made in order for a limit on when bins could be transported to be successful, a time study was planned to estimate the flow of bins between the 1st and 2nd floors during a typical work week. However prior to the study, during a tour of the factory area, two main observations were made. The first was that bins were often utilized as storage containers, and the second was that due to a lack of a fixed bin storage area, empty bins were placed around the conveyor belt.
Figure 9: Multipurpose utilization of bins
Figure 10: Informal bin storage area
This lack of formalized SOP with regards to bin usage and storage led to two main observations. Firstly, the lack of formal storage area raises the possibility that what appears as a lack of bins could rather be an inability to find more empty bins. Empty bins might be available, but the lack of designated storage area would make it difficult to find an empty bin, resulting in the bin not being utilized. The second is that, since bins are often taken out of circulation for storage, difficulties would appear in tracking where and when bins are used. As such no accurate gauge
could be made on how many bins would be necessary to prevent a shortage of bins. In the future if bin usage could be formalized through the implementation of an SOP, the demand for bins could be estimated, and the number of bins needed could be more accurately determined.
5.4 Upstream shortage analysis
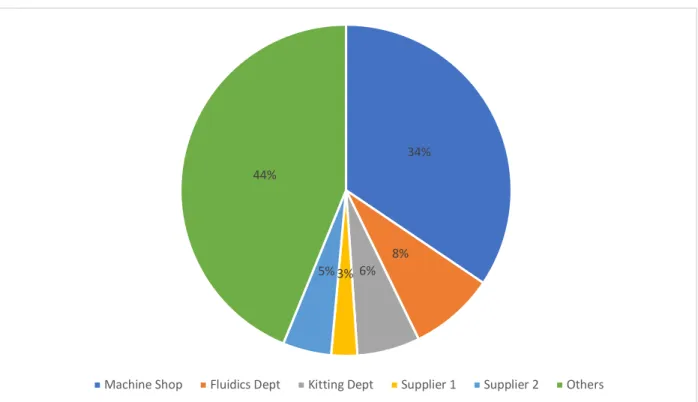
Waters manufacturers a wide range of products, with significant variety in where their parts are manufactured, and the supply chains used to obtain them. As such, identifying a single underlying reason for all shortages would be impossible. Therefore to identify parts where improvements would have the greatest overall impact, the line down report for 2019 was procured. This report logged every instance when the assembly of a product was disrupted, along with the reason for the delay and the supplier of the relevant part. From analysis of this report we found that in 2019, shortages in parts from the Waters machine shop were responsible for 34% of all line down delays. The next highest contributor was the Waters fluidics department, followed by the Waters kitting department, and two external suppliers to Waters.
Figure 11: Line down instances by supplier
From this analysis, we see that the machine shop was the single greatest contributor to line down issues. Thus, we focus on parts from the machine shop.
To gain an overall understanding of the issues faced by the machine shop, an interview was conducted with Steve Rebello, a Lean/6 Sigma Project Manager within Machining Operations. During this interview several issues were raised. Firstly, in his experience often SAP allocated production on an unlimited capacity basis. Frequently it would not be possible to complete the requested order on time, as the relevant work center within the machine shop would be over capacity. As a result, often machine shop staff are forced to prioritize parts based on when the order is due, moving off schedule. This mismatch between the plan and the actual operations highlights the differing capacity assumptions between planning and the machine shop. Overall
34% 8% 6% 3% 5% 44%
planning is done in line with principles of Just-in-time, aiming to hold as little inventory as possible. On the flipside, due to the complexity of the operations taking place in the machine shop, along with the varying levels of reliability of different processes and the difficulties involved in procuring materials for the part, often it is more beneficial for the machine shop to prepare inventory in advance and hold significant buffers. Some processes, due to their complexity, result in frequent quality control issues, and cause the parts to be rejected upon inspection. Remaking the parts from the raw material stage typically takes a long time, due to the lead times associated with each step. Holding excess inventory and preparing parts in advance enables the machine shop to respond quickly to any quality issues. Furthermore, due to the significant set-up times often involved in producing parts, batching typically achieves better overall outcomes due to the time saved in production, despite coming into conflict with Just-In-Time principles. The conflict between the two results in automated planning decisions that are better from a just-in-time perspective but are not feasible for the machine shop due to physical constraints.
To correct for this, past attempts had been made to increase the planned lead-times to more accurately simulate the machine shop. However, difficulties arose in fine tuning the changes. For example, it is difficult to accurately represent the daily operating schedule of the factory on SAP. Within SAP the time taken to work through each process is fixed. For example, within SAP it could be listed that the machining of a certain part would take one hour. As such, if the previous processing step has been completed, once the part arrives at the machining step, the SAP plan assumes the machining step will be completed in an hour. However, if the part arrives at the machining step around the factory closing time, it will only be machined the next day, increasing
the total time taken to machine the part. To account for this within SAP, the processing time at the machine shop could be increased to account for times when the factory closes, and a part is not processed until the next working day. However if done inaccurately, the resultant plan may result in parts being produced at a much lower rate, unnecessarily slowing down production and making the business unprofitable. To reasonably bridge the gap between SAP and reality, greater fine tuning is needed.
From the discussion we found that the issues facing individual parts differ greatly, due to the significant variety in the supply chains, production methods and demands for each part. As such, developing one unified solution to improve the production of all parts would be impossible. Therefore it was determined that a more fruitful methodology would be to, having identified parts with systemic issues, analyze the relevant supply chain and processes and develop solutions for the relevant issues. Having done this for several parts, an SOP would then be created for analyzing problematic parts, along with a list of commonly occurring issues and a generalized solution for said solution.
To identify parts with recurrent systemic issues, the line down reports from 2019 were utilized. These reports list out all instances when the assembly line was down, along with the relevant part, supplier, and how long the disruption lasted. Using this information, parts which caused five or more line down issues across the year were selected for analysis. A preliminary investigation was conducted to determine if the causes of these line down reports were systemic, along with
the general nature of the fault. From this preliminary investigation, the serpentine tubing part was selected for deeper analysis, along with solution development.
5.4.1 Deep Dive: Serpentine Tubing
One identified part was the serpentine tubing. Multiple types of tubing are produced within Waters. However one particular part number appears to cause more line down issues than others. This part was frequently delivered late to the assembly floor. To identify the underlying issues facing this part, interviews were conducted with Katie Chanthavongsack, the planner in charge of the part, along with Aderito Tomaz and Nouthong Matvongsa, representatives from the machine shop team. During the course of the discussion several issues were highlighted.
The process flow for the production of the serpentine tubing parts is as follows. First, the tube blanks are ordered from the supplier. This typically has an 8-12 week lead time. After some internal steps, the tubing parts are then sent to an external supplier to be plated. This typically takes 5 weeks. The parts are then sent back to Waters, where they are measured to ensure that after plating they are still within specification sizes. These parts are then washed to ensure that critical clean conditions are met. The weekly number of parts to be washed is coordinated using SAP, via manufacturing orders. Once washed, the parts are sent to the stock room for storage. Tubes are stored in bins with a default batch size of 50. When the assembly floor runs out of the serpentine tubing parts, a kanban card is sent to the stock room to retrieve more tubes. The emptied bin is then sent to the machine shop, for replenishment with new parts.
The first identified issue was that the safety stock of tubing blanks held was insufficient. Waters currently holds no tubing blanks as safety stock, despite past inconsistencies in the raw material delivered from the supplier, which have resulted in several past batches being rejected. This, coupled with the long lead time in procuring the raw material, put Waters at significant risk of a stock out if any delays or rejections occur.
The second identified issue was that the SAP plan for operations at the machine shop did not take into account capacity constraints and realistic demand for the day. For one intermediate step, parts had to be sent to an external supplier. This supplier required batch sizes varying between 500 to 1500 pieces. Once the external supplier returns these pieces, they would then need to be washed before they could be delivered to the assembly floor. Within the SAP plan, to minimize waiting time, once parts come from the supplier they are pushed through the machine shop for washing. Typically, the machine shop cannot wash a full batch of parts within the timeframe required by SAP. In addition, realistically the assembly floor cannot use a full batch of parts in a day. The push plan as assembled by SAP is frequently unrealistic, both in terms of the machine shop’s capacity and the assembly floor’s daily demand. This mismatch was caused by an adherence to the principle of minimizing waiting time. To compensate for this, the SAP order is frequently ignored in favor of manual intervention. The current verbal agreement between the machine shop and the assembly floor is for the assembly floor to inform the machine shop of how many parts it needs, along with when the parts are needed. This is delivered along with a
red bin for the machine shop to fill. Once this is done the bin is sent to the stock room, from which it is retrieved by the assembly floor.
The third issue, also pertaining to SAP, was that often SAP did not plan for delays in subsequent steps caused by a delay at an upstream process. If a process is not completed on time, and parts cannot be delivered to the next point on time, the due date for the part is pushed to the next day. Given this, all subsequent processes should also be pushed back, so that sufficient time is allocated for all processes. Currently, however, within SAP no adjustments are made to subsequent deadlines. This lack of recalibration then leaves it to the relevant department (whether assembly or the machine shop) to adjust their own schedule manually. This manual intervention often results in suboptimal results. The reorganization of the schedule is often done by a manufacturing shop manager who may not know the full extent of which instruments to prioritize, what the capacity constraints of each department are, and other constraints that SAP is designed to plan for.
The fourth issue identified was that of a breakdown of the informal system. Once washed, the serpentine tubing is stored in the stock room in bins of 50 parts. These bins are used exclusively for the storage of the serpentine tubing, so as to match the batch size specified on the Kanban card used to pull parts to the assembly floor. If parts are urgently needed, the assembly floor bypasses SAP and manually communicates with the machine shop to order washed serpentine tubings. Often when this occurs, no empty bins are correspondingly delivered to the machine shop. As a result the necessary parts cannot be delivered, resulting in a line down issue. One
identified cause of this issue is that the bins used are shared between a number of tubing parts of a similar nature. Bins are not allocated to specific parts, and as such it is possible for multiple bins to be partially filled, resulting in a shortage of empty bins for delivery to the machine shop.
The fifth issue identified was that of a lack of safety stock of the completed serpentine tubings. When a bin of the serpentine tubing is emptied on the assembly floor, a kanban card is sent to the stock room to retrieve a new full bin of tubing. This is used to retrieve a bin. The stock of serpentine tubing in the stock room is replenished according to SAP planning, which in theory should ensure that the stock of the serpentine tubing in the stock room is sufficient to meet the demand for the tubing at the assembly floor. However often insufficient tubing is held in the stock room, resulting in the stock of the serpentine tubing being depleted before SAP indicates to the machine shop that the stock room needs replenishing.
Figure 12: Flow of material & information between machine shop & assembly floor
Machine Shop Stock Room Assembly floor
Bins of tubing Bins of tubing
Kanban card