1
Environmental factors controlling soil organic carbon stability in French forest
1
soils
2 3 4
Laure N. Soucémarianadin1,*, Lauric Cécillon2, Bertrand Guenet3, Claire Chenu4, François 5
Baudin5, Manuel Nicolas6, Cyril Girardin4 and Pierre Barré1 6
7
1 Laboratoire de Géologie, PSL Research University, CNRS-ENS UMR8538, Paris, France
8
2 Université Grenoble Alpes, Irstea, UR LESSEM, St-Martin-d'Hères, France
9
3 Laboratoire des Sciences du Climat et de l’Environnement, LSCE/IPSL,
CEA-CNRS-10
UVSQ, Université Paris-Saclay, Gif-sur-Yvette, France 11
4 AgroParisTech-INRA, UMR ECOSYS, Thiverval-Grignon, France
12
5 Sorbonne-Université/UPMC, ISTeP, Paris, France
13
6 Office National des Forêts, R&D, Fontainebleau, France
14 15
* Corresponding author: Laure Soucémarianadin, souce@geologie.ens.fr
16
Laboratoire de Géologie (UMR 8538) Ecole Normale Supérieure, 24 Rue Lhomond 75231 17
Paris CEDEX 5, France; phone: +331 44 32 22 94; fax: +331 44 32 22 00 18
19 20 21 22
Type: Regular article 23
Revised version without track changes Click here to download Revised version without track changes renamed_a9f36.docx
2
Abstract
24
Aims
25In temperate forests, soils contain a large part of the ecosystem carbon that can be partially 26
lost or gained upon global change. Our aim was to identify the factors controlling soil organic 27
carbon (SOC) stability in a wide part of French forests. 28
29
Methods
30Using a set of soils from 53 French forest sites, we assessed the effects of depth (up to 1 m), 31
soil class (dystric Cambisol; eutric Cambisol; entic Podzol), vegetation types (deciduous; 32
coniferous) and climate (continental influence; oceanic influence; mountainous influence) on 33
SOC stability using indicators derived from laboratory incubation, physical fractionation and 34 thermal analysis. 35 36
Results
37Labile SOC pools decreased while stable SOC pool increased with depth. Soil class also 38
significantly influenced SOC stability. Eutric Cambisols had less labile SOC in surface layers 39
but had more labile SOC at depth (> 40 cm) than the other soil classes. Vegetation influenced 40
thermal indicators of SOC pools mainly in topsoils (0–10 cm). Mountainous climate forest 41
soils had a low thermal SOC stability. 42
43
Conclusions
44On top of the expected effect of depth, this study also illustrates the noticeable effect of soil 45
class on SOC stability. It suggests that environmental variables should be included when 46
mapping climate regulation soil service. 47
3 49
Keywords
: forest soils, particulate organic matter fractionation, pedology, Rock-Eval 6, soil 50basal respiration, soil organic carbon persistence 51
52
Abbreviations
: soil organic carbon (SOC), Rock-Eval 6 (RE6), particulate organic matter 53(POM), Oxygen index (OIRE6), Hydrogen index (HI), Hydrocarbons (HC)
54 55 56
Introduction
57
Forest ecosystems play a central role in the global carbon (C) cycle with their high potential 58
for atmospheric CO2 sequestration (Intergovernmental Panel on Climate Change 2000; Smith
59
et al. 2014). About half of the terrestrial C sink is indeed located in forests (Canadell et al. 60
2007) and forest soils in particular store around 398 Pg C (Kindermann et al. 2008). The 61
temperate biome holds a quarter of the world’s forests (Tyrrell et al. 2012) and soils in 62
temperate forests have twice as much carbon as the vegetation (Jarvis et al. 2005). Temperate 63
forest soils have also constituted a C sink for over two decades (Pan et al. 2011; Tyrrell et al. 64
2012) with parts of the European—and particularly French (Jonard et al. 2017)—forest soils 65
being particularly efficient at sequestering C (e.g., Nabuurs et al., 2008). The contribution of 66
deep soil to soil organic carbon (SOC) stocks has been previously highlighted (Jobbágy and 67
Jackson 2000; Rumpel and Kögel-Knabner 2010), however there is still a lack of data on 68
deep/subsoil mineral (> 30 cm depth) SOC stocks (e.g., Tyrrell et al. 2012). 69
SOC is made up of very heterogeneous compounds (Amundson 2001; Trumbore 1997) with 70
turnover times ranging from a few days/weeks to several centuries and, for modelling 71
4
purposes, can be roughly divided into active (labile), intermediate and passive (persistent) 72
SOC kinetic pools. 73
Labile SOC is the most likely to be quickly affected by climate or land-use changes (Carter et 74
al. 1998; Zhang et al. 2007), thus potentially contributing further to global warming. 75
Moreover, because of the central role of the SOC labile pool in short-to medium-term nutrient 76
availability and soil structural stability (Wander 2004), its evolutions could have major effects 77
on biomass (food/timber/etc.) production. Conversely when considering SOC long-term 78
storage and possible sequestration, soils in which most of the total SOC is stable will perform 79
better than soils with a greater proportion of their total SOC as labile SOC (Jandl et al. 2007; 80
Lorenz and Lal 2010; Prescott 2010). It is thus essential to determine how much labile and 81
persistent SOC are present in soils. 82
Despite being of such interest, there is still no standard technique to assess SOC stability but a 83
set of complementary techniques are available. Respiration measurements and particulate 84
organic matter (POM) quantification obtained by various methods of fractionation (density 85
only / density + particle-size) (von Lützow et al. 2007) have been used for decades and are 86
traditional metrics of SOC lability. Although the respired-C and POM-C fractions both 87
represent a labile SOC pool, the former corresponds to a smaller SOC pool with a shorter 88
mean residence time (usually < 1 year for temperate in-situ conditions) (Feng et al. 2016) 89
while the latter corresponds to a larger SOC pool with a longer mean residence time (usually 90
< 20 year for temperate conditions (e.g., Balesdent 1996; Trumbore et al. 1996). This longer 91
residence time may result from interactions with the soil structure; part of the POM-C fraction 92
being occluded in micro-aggregates and protected from microbial respiration for longer time 93
scales (Six et al. 2002). The mean residence time of the POM-C fraction can also exceed 20 94
years, especially in cold and mountainous areas (Leifeld et al. 2009) or in areas affected by 95
wildfires where the POM-C fraction may contain large amounts of pyrogenic carbon with 96
5
residence time in soils greater than the mean residence time of total SOC. Nevertheless, it has 97
been shown that the POM-C fraction of temperate and mountainous soils of agroecosystems 98
correspond roughly to the resistant material pools (RPM) of the RothC model (Zimmerman et 99
al. 2007), which has a turnover rate of 3 years (Coleman and Jenkinson 1999). In this paper, 100
the respired-C fraction will be referred to as the highly-labile SOC pool and the POM-C 101
fraction will be termed labile SOC pool. 102
Thermal analysis techniques have also been used to characterize soil organic matter (SOM) 103
stability (e.g., Plante et al. 2009). Among them, Rock-Eval 6 (RE6) analysis has shown 104
promising results in the determination of SOM biogeochemical stability (Barré et al. 2016; 105
Gregorich et al. 2015; Saenger et al. 2015; Sebag et al. 2016). RE6-derived parameters are 106
reliable indicators of the stable SOC pool (Barré et al. 2016; Cécillon et al. 2018) and can be a 107
useful complement to the aforementioned usual indicators of the labile SOC pool 108
(Soucémarianadin et al. 2018). Specifically, one RE6-derived parameter, T50_HC_PYR, which
109
corresponds to the temperature at which 50% of the hydrocarbons released as pyrolysis 110
effluents during SOM pyrolysis have evolved, was linked to the highly-labile and the labile 111
SOC pools (Gregorich et al. 2015; Soucémarianadin et al., 2018). In French forest soils, 112
T50_HC_PYR was shown to be strongly and negatively correlated to the POM-C fraction but not
113
to the respired-C fraction (Soucémarianadin et al. 2018). T50_HC_PYR could thus be used as an
114
indicator of the labile SOC pool defined above, similarly to the POM-C fraction. Another 115
RE6-derived parameter, the temperature at which 50% of the CO2 resulting from SOM
116
thermal oxidation has evolved (T50_CO2_OX) was positively related to an increasing proportion
117
of persistent SOC (Barré et al. 2016; Cécillon et al. 2018) and to a POM-C depletion in 118
temperate forest soils (Soucémarianadin et al. 2018). T50_CO2_OX could thus be used as an
119
indicator of the stable SOC pool with mean residence times greater than several decades (> 120
50–100 years; Cécillon et al. 2018). 121
6
Few studies have assessed the factors controlling SOC stability over large areas. Several 122
recent studies have highlighted the importance of parent material and soil type on SOC 123
content and stability, SOC in deep soil layers being generally more stable compared to surface 124
SOC (Barré et al. 2017; Mason et al. 2016; Mathieu et al. 2015; Mulder et al. 2015). Camino-125
Serrano et al. (2014) reported a larger highly labile SOC pool (based on concentrations of 126
dissolved organic carbon; DOC) in soils types characterized by a very acidic pH than in more 127
basic soils, especially in the subsoil layers below 20 cm depth. Considering croplands and 128
grasslands in Germany, Vos et al. (2017) showed that sandy soils had a larger labile SOC pool 129
(POM-C fraction) than soils with finer texture. 130
Land cover and vegetation type have also been shown to strongly control SOC stability. 131
Wiesmeier et al. (2014) found lower proportions of stable SOC pool in Bavarian forests 132
compared to grasslands or croplands, confirming results across Europe that showed that 133
afforestation of cropland and grassland generally decreased SOC stability (Poeplau and Don 134
2013). In the temperate forests of Bavaria, vegetation type was also shown to control SOC 135
stability, coniferous forests having higher labile SOC proportions than deciduous and mixed 136
forests (Wiesmeier et al. 2014). Similar results were obtained for the highly labile SOC pool 137
with lower dissolved organic carbon concentrations in broadleaved forests than coniferous 138
forests (Camino-Serrano et al. 2014). Variations of soil respiration were also observed at the 139
species level (e.g., three species of oaks; You et al. 2016). 140
Regarding climate, both global and more local studies have highlighted the strong positive 141
relationship with precipitation and the negative effect of temperature on SOC quantity 142
(Jobbágy and Jackson, 2000; Paul et al., 2002; Callesen et al., 2003; Wiesmeier et al. 2013). 143
Labile OM and particularly the POM-C fraction, has been shown to dominate in soils located 144
at higher elevations and experiencing colder mean annual temperatures (e.g., Leifeld et al. 145
2009; Sjögersten et al. 2011). Considering over 300 forested sites, higher DOC concentrations 146
7
(highly labile SOC pool) were found in temperate sites than boreal and tropical sites (Camino-147
Serrano et al. 2014). To the exception of the work of Wiesmeier et al. (2014), we are not 148
aware of large scale studies that would consider both the highly labile, labile and stable SOC 149
pools and devoted to forest soils, despite their large SOC stocks. 150
The objectives of the study were thus to assess the importance of various environmental 151
factors, soil depth, soil class, vegetation type and climate class in controlling the stability of 152
SOC in forest soils. To this purpose, we used a set of complementary techniques, namely the 153
Rock-Eval 6 thermal analysis, POM separation by size and density and a laboratory 10-week 154
incubation, and applied them to a large set of French forest soil samples that covers a large 155
pedoclimatic variability, a wide tree species diversity and includes deep samples (up to 1 156
meter). 157
We hypothesized that 1/ SOC stability would vary with depth with surface soil layers 158
containing more labile SOC while deep soil layers would contain more stable SOC; 2/ 159
vegetation type would influence SOC stability mostly in surface soil layers (with higher rates 160
of C input from plants), SOC being more labile in topsoils of coniferous forests; 3/ soil class 161
would influence SOC stability mostly in medium/deep soil layers (below 20 cm); and 4/ 162
climate would influence SOC stability and SOC in mountainous plots would be more labile. 163
164
Material and methods
165
a. Sites and soil samples 166
We considered forest mineral soil samples from 53 permanent forest sites of the French 167
national network for the long term monitoring of forest ecosystems (‘‘RENECOFOR’’), 168
established in 1992 (Ulrich 1995) by the National Forest Service (ONF; 169
http://www.onf.fr/renecofor) as a part of the European ICP-FORESTS (http://icp-forests.net/) 170
level 2 network (Fig. 1a). Our selected sites are variable in terms of climate (continental 171
8
influence; oceanic influence; mountainous influence; with mean annual precipitation MAP 172
and mean annual temperature MAT ranging between 703–1894 mm and 4.8–12.3 °C 173
respectively for the 1971–2000 period), soil type with a class constituted of soils related to 174
entic Podzols, another class constituted of eutric and epileptic Cambisols as well as Calcisols 175
and a last class constituted of dystric and hyperdystric Cambisols (IUSS Working Group 176
2015) and forest vegetation with coniferous [silver fir (Abies alba Mill.); Norway spruce 177
(Picea abies (L.) H. Karst.); European larch (Larix decidua Mill.); Scots pine (Pinus 178
sylvestris L.)] and deciduous [beech (Fagus sylvatica L.); sessile (Quercus petraea (Matt.)
179
Liebl.) and/or pedunculate oaks (Quercus robur L.)] stands. Stands are even-aged. 180
At each site, samples representing five soil layers were obtained (0–10 cm, 10–20 cm, 20–40 181
cm, 40–80 cm and 80–100 cm; Fig. 1b). Samples of the first three top soil layers were 182
collected, at each depth, as 5 (replicates; pooled together on site) × 5 (sub-plots) sampling 183
points over the 5000 m2 central plot, by progressively digging a 50 cm wide soil profile 184
(Jonard et al. 2017; Ponette et al. 1997). This sampling campaign took place between 2007 185
and 2012. Samples of the two deeper soil layers were taken from two soil pits located just 186
outside the central plot and collected in 1994–1995 (Brêthes et al. 1997). 187
Bulk soils were air-dried and stored in plastic buckets right after sampling. One liter of soil of 188
each layer was retrieved for this study by isovolumetrically pooling the samples of the 5 189
subplots (200 mL each) for the first three layers (0–40 cm) and the 2 faces of the 2 soil pits 190
(250 mL each) for the two deepest layers (40–100 cm). The pooled samples were sieved at 2 191 mm before analysis. 192 193 b. Elemental analysis 194
Bulk < 2 mm-sieved soil samples were ground (< 250 µm; ultra-centrifugal mill ZM 200, 195
Retsch Gmbh) and organic carbon and total nitrogen concentrations were determined by dry 196
9
combustion with an elemental analyzer (CHN NA 1500, Carlo Elba). Samples with 197
carbonates (total CaCO3 = 3.5–835 g·kg−1) were first decarbonated following the same
198
protocol as Harris et al. (2001). Briefly, 30 mg of ground samples were weighed in 5 mm × 9 199
mm silver boats followed by the addition of 50 μL of distilled water. The boats were put in a 200
glass bell jar, next to a beaker containing 100 mL of concentrated HCl (12 mol·L−1). The air 201
in the jar was evacuated and samples let to sit in this HCl-saturated atmosphere to allow the 202
acid to dissolve water and hydrolyze the carbonates for 8 h. Then, the decarbonated samples 203
were dried at 60 °C in the silver boats for at least 48 h. Silver boats were further placed in 10 204
mm × 10 mm tin boats and analyzed for C and N. 205
POM fractions (see subsection d) were ground with a ball mill (mixer mill MM 200, Retsch 206
Gmbh) or a mortar and pestle when the sample mass was less than 0.05 g. Carbon 207
concentration was determined as for the bulk soil. 208
209
c. Respiration test 210
For each sample, 20 g of 2 mm-sieved soil were transferred in a 120 mL glass-flask and re-211
humected at pF 2.5 (−0.033 MPa), which had been previously determined using a 5 Bar 212
pressure plate extractor (#1600, Soilmoisture Equipment Corp.). The flasks were fitted with 213
aluminum seals with PTFE-faced silicone septa to allow for headspace gas sampling and 214
placed inside an incubator (AE240 BIO EXPERT, Froilabo SAS) kept at 20 °C for 10 weeks 215
following a two-week period pre-incubation to allow the samples microbial activity to 216
stabilize (data not included). 217
Headspace gases were sampled at 1 to 2-week intervals during the 10-week incubation period 218
and CO2 concentrations were determined using an Agilent 490 micro-gas chromatograph
219
equipped with the OpenLAB Chromatography Data System EZChrom software. 220
10
When CO2 concentrations had reached 2.5–3% or was expecting to do so before the next
221
measurement, and/or when the cap had been pierced with the needle four times, flasks were 222
opened and flushed with fresh and moist air to return CO2 concentrations to ambient levels to
223
avoid anoxia (while maintaining the moisture content), before returning them to the incubator. 224
The CO2 released during the incubation experiment was expressed as the cumulated soil
225
microbial respiration rate (basal respiration) from the initial SOC content over the 10-week 226
period, or the 10-week mineralizable SOC (respired-C) and reported as a percentage of total 227
SOC to account for differences in the C content of the various layers and sites. Respired-C 228
was used as indicator of the highly labile SOC pool with mean residence time below 1 year. 229
230
d. Particle size and density SOC fractionation 231
To isolate the particulate organic matter (POM) fraction, samples were first dried at 50 °C for 232
24 h before weighing 25 g and transferred them in polyethylene (PE) 250 mL flasks. We then 233
added 180 mL of 0.5% sodium hexametaphostate solution and ten 5 mm-diameter glass beads 234
before shaking the samples overnight (50 rpm; 16 h) on an overhead shaker (Reax 2, 235
Heidolph). Samples were thoroughly rinsed over a 50-µm mesh with deionized water. The 236
sand fraction was then transferred back to a dry PE flask with a sodium polytungstate (SPT) 237
solution of density = 1.6 0.03 g·cm−3 (Crow et al. 2007; Golchin et al. 1994) and solution 238
was added up to around 180 mL. The flasks were shaken overhead by hand 10 times and 239
samples were left overnight to settle down after the cap of the flask was rinsed with the SPT 240
solution. The floating material was collected with a spatula and placed over a 50-µm mesh 241
sieve. If necessary some SPT solution was added back to the flask and the previous step was 242
repeated. This time, samples were placed in a centrifuge for 30 minutes to accelerate the 243
separation (2750 rpm or 1250 g). The floating material was again collected with the spatula or 244
pipetted depending on the amount left. This step was repeated if the light fraction was 245
11
abundant. If not, samples were left to settle down overnight before one last collection. The 246
POM fraction on the sieve was thoroughly rinsed with deionized water throughout the whole 247
process. The sieves and fractions were then placed in the oven at 50 °C for 24 h before being 248
weighed. To account for differences in the C content of the different samples, we calculated 249
the proportion of OC in the POM fraction (POM-C), expressed as a percentage of total SOC. 250
POM-C was used as indicator of the labile SOC pool with mean residence time generally up 251
to 20 years. 252
253
e. Thermal analysis: Rock-Eval 6 254
The thermal analysis of the samples was performed with a Rock-Eval 6 turbo device (Vinci 255
Technologies, France). Details about the equipment have been previously published (Behar et 256
al. 2001). We adapted the procedure developed for the analysis of SOM by Disnar et al. 257
(2003). Briefly, about 60 mg of ground sample were exposed to two consecutive thermal 258
treatments, first in a pyrolysis oven (200–650 °C; thermal ramping rate of 30 °C·min−1; under 259
N2 atmosphere) then in a combustion oven (300–850 °C; thermal ramping rate of
260
20 °C·min−1; under laboratory air atmosphere). At the beginning of the pyrolysis, there was an 261
isothermal step (at 200 °C) during ≈ 200 seconds during which the free hydrocarbons (HC) 262
were thermovaporized (S1 peak). The pyrolysis effluents (mostly HC) were detected and 263
quantified with flame ionization detection, while CO and CO2 were quantified by infrared
264
detection during both the pyrolysis and oxidation stages (Online Resource 1). 265
Two standard RE6 parameters describing SOC bulk chemistry were determined: the hydrogen 266
and oxygen indices (HI and OIRE6). The HI index corresponds to the amount of hydrocarbons
267
formed during thermal pyrolysis of the sample (HC evolved between 200 and 650 °C minus 268
the S1 peak) divided by the total SOC content of the sample and is expressed in mg HC·g−1 269
SOC. It describes the relative enrichment/depletion of SOC in hydrogen-rich moieties. The 270
12
OIRE6 index describes the relative oxidation status of SOC. It was calculated using the
271
equation proposed by Lafargue et al. (1998): 272
OIRE6 = 16 / 28 × OICO + 32 / 44 × OICO2 (equation 3)
273
Where OICO2 corresponds to the CO2 yielded during thermal pyrolysis of the sample between
274
200 and 400 °C divided by the total SOC of the sample and OICO corresponds to the CO
275
yielded during thermal pyrolysis between 200 and 400–650 °C (wherever a minimum of CO 276
production is observed; in the absence of a minimum, the default upper-limit temperature is 277
set at 550 °C) divided by the total SOC of the sample. Thus OIRE6 is expressed in mg O2·g−1
278
SOC. 279
We derived two additional RE6 parameter describing the thermal stability of SOC: (i) 280
T50_HC_PYR, the temperature at which 50% of the HC resulting from the SOM pyrolysis had
281
evolved and (ii) T50_CO2_OX, the temperature at which 50% of the CO2 resulting from the SOM
282
oxidation had evolved. The upper limit temperature for the integration of this signal was set at 283
611 °C to obtain a total CO2 signal evolved from pure OM without interference of carbonates.
284
T50_HC_PYR was used as an indicator of the labile SOC pool with mean residence time
285
generally up to 20 years (negative correlation with the labile SOC pool according to 286
Gregorich et al. (2015) and Soucémarianadin et al. (2018)), while T50_CO2_OX was used as an
287
indicator of the stable SOC pool with mean residence time typically greater than 50–100 288
years, following Barré et al. (2016) and Cécillon et al. (2018). Signal processing of the RE6 289
thermograms, i.e., signal integration and calculation of T50_HC_PYR and T50_CO2_OX, was
290
performed with the R environment software v.3.3 (R Core Team 2016) using the hyperSpec 291
(Beleites and Sergo 2015) and pracma (Borchers 2015) R packages. 292
13 f. Calculations and statistical analyses
294
For the respiration test, samples with very low C content (< 0.2%) were not considered as the 295
C respired during the incubation period was too close to the limit of detection for reliable 296
determination. For the thermal analysis, we used a C content threshold of 0.1% and manually 297
inspected the pyrolysis thermograms for samples with 0.1% ≤ C content ≤ 0.25% to make 298
sure of the validity of the RE6 data (by assessing the shape of the signal). This resulted in the 299
selection of n = 46 / 50 and n = 31 / 33 samples for the soil layers 40–80 cm and 80–100 cm 300
and the two methods respectively, leading to a total n = 236 for respiration test and n = 242 301
for RE6 (Fig. 1b). Because POM fractionation is time-consuming, we analyzed only the soil 302
layers 0–10 cm and 40–80 cm (Fig. 1b). At two sites, soil was too shallow (< 40 cm) and no 303
sample was therefore collected for the 40–80 cm layer, and we used the same C threshold as 304
for the RE6 to select the POM samples, which lead to n = 103. Out of the 236 samples 305
considered for the respiration test, 35 had a CaCO3 content over 5% (5.2–82.0%). We tested
306
the correlation between respired-C and CaCO3 content and, as it was not significant, decided
307
to proceed with the statistical analysis with all the samples. 308
Basic soil parameters (pH, texture, cation exchange capacity) were previously published in 309
Ponette et al. (1997). Average values are reported in Table 1 as well as the C content and C/N 310
ratio measured on the composite samples from this study. Because we used isovolumetric 311
pooled sampled, we saw appropriate to use average values of the 5 replicates × 5 sub-plots. 312
This was confirmed by the results we obtained for the C content (Online Resource 2). 313
Relationships between the indicators of SOC stability and soil physico-chemical properties as 314
well as climatic data (MAT and MAP) were estimated using Spearman rank correlation as the 315
data did not meet the assumption of normality. Correlations were also performed on different 316
sets of samples for the different indicators (233 samples were included for the respiration test, 317
242 for the RE6 comparison and 103 for the POM fractionation). 318
14
A principal component of analysis (PCA) was performed to illustrate linear relations between 319
the indicators derived from the 3 methods at two different depths: 0–10 cm and 40–80 cm. 320
For that purpose, data were log-transformed, centred and scaled. To determine the number of 321
principal components to select, we looked at the percentage of the total variance explained 322
and used a scree plot and Kaiser’s criterion. We projected the physico-chemical and climatic 323
variables on the circle of correlations to see if any of those was associated with either of the 324
principal components and could thus be associated with SOC stability. 325
The statistical analysis to determine the driving factors of SOC stability was performed in two 326
steps: first over the complete soil profile and then on each soil layer individually. We used 327
multivariate models to assess the effects of the different environmental factors on the RE6-328
based parameters and respiration test and POM fractionation results. For this “analysis by soil 329
profile”, we used linear mixed models introducing a random intercept for each site (≈ to treat 330
“site” as random effect) to take into account that the different layers constituted repeated 331
measures (increasing depth within a same RENECOFOR site). To do so we added the 332
compound symmetry structure, which is similar to the variance structure of random-intercept-333
only model, to a generalized least squares function (that fits a linear model using generalized 334
least squares; (Pinheiro et al. 2016)). Model selection was then implemented with a top-down 335
strategy. The response variables were transformed, to the exception of T50_HC_PYR and
336
T50_CO2_OX, using the Box-Cox transformation technique (log10 for POM-C and (respired-C +
337
1)), as they showed evidence of the variance increasing with the mean response. After 338
transformation, the residuals followed an approximate normal distribution. 339
To explore further the effects of soil classes, vegetation types and climatic zones within each 340
layer, we then conducted three-way analyses of variance (ANOVA) “by layer” with type II 341
analysis, when the interactions were not significant. Data were not transformed except for 342
respired-C. Multiple comparison tests were performed with Tukey's honest significant 343
15
differences (to get adjusted p-values for all comparisons) and pairwise t-test (no adjustment 344
method). All comparisons were considered significant at an alpha value () of 0.05. 345
All statistical analyses were performed using the R 3.3 statistical software (R Core Team 346
2016) with the factoextra (Kassambara and Mundt 2016), nlme (Pinheiro et al. 2016), lme4 347
(Bates et al. 2015) and car (Fox and Weisberg 2011) packages. 348
349
Results
350
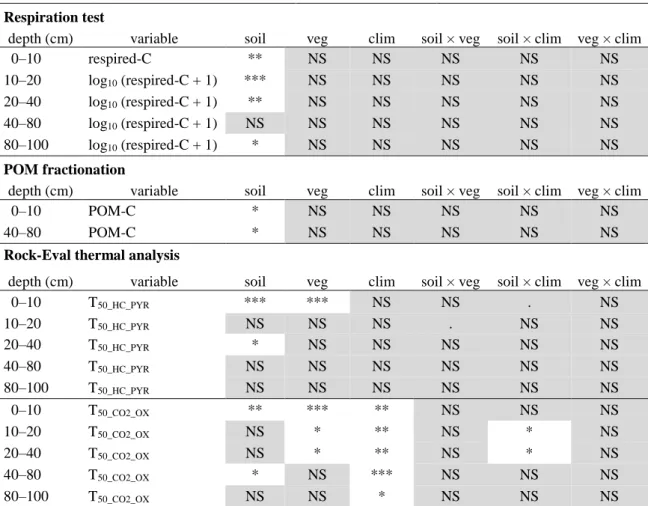
a. Highly labile SOC pool: respired-C 351
Depth and soil class significantly influenced variations in soil basal respiration (respired-C) 352
across our 53 study plots. The depth × soil interaction was also included in the selected model 353
(p = 0.042; Online Resource 3). The respired-C fraction was on average 1.46 0.63% of total 354
SOC (Online Resource 4) with no significant differences among vegetation types (Fig. 3) or 355
climatic zones (Table 2). Respired-C decreased with depth (Fig. 2) but that factor was only 356
marginally significant. Soil class was not significant in the 40–80 cm layer but otherwise entic 357
Podzols had significantly lower respired-C than the two other soil classes (p = 0.0010–0.042; 358
Table 2; Fig. 4). 359
360
b. Labile SOC pool: POM-C and T50_HC_PYR
361
Only depth and soil type significantly affected variations in POM-C across our 53 study plots 362
(Online Resource 3). The labile SOC fraction contained in POM decreased by almost half 363
from the 0–10 cm layer to the 40–80 cm layer (with respective proportions of 22.6 7.3% and 364
11.5 6.2% of total SOC; Fig. 2). The analysis by layer confirmed that neither climate nor 365
vegetation significantly influenced POM-C variations (Table 2; Fig. 3). Eutric Cambisols had 366
16
significantly less POM-C than entic Podzols in the surface layer and dystric Cambisols at 40– 367
80 cm (Fig. 4; Online Resource 4). 368
Depth, vegetation type and soil class influenced variations in T50_HC_PYR, the RE6-derived
369
temperature at which 50% of the HC resulting from the SOM pyrolysis had evolved. The 370
three interactions depth × soil, depth × veg and soil × veg were also included in the selected 371
model (Online Resource 3). T50_HC_PYR significantly increased with depth (422 8 to 452
372
13 °C at 0–10 cm and 80–100 cm, respectively; Fig. 2), illustrating the decrease of the labile 373
SOC pool with increasing depth. Eutric Cambisols had significantly higher T50_HC_PYR than
374
dystric Cambisols and entic Podzols in the surface layer but had significantly lower 375
T50_HC_PYR than the two other soil classes at 20–40 cm depth (Fig. 4; Online Resource 4).
376
Moreover, in the surface layer, samples in deciduous plots had a significantly higher 377
T50_HC_PYR than those in coniferous plots (427 9 and 417 7 °C, respectively, p < 0.001;
378
Table 2; Fig. 3). 379
380
c. Stable SOC pool: T50_CO2_OX
381
Depth, vegetation and climate induced significant variations in the temperature at which 50% 382
of the CO2 resulting from the SOM oxidation had evolved (T50_CO2_OX) across our 53 study
383
plots. The depth × climate interaction was also included in the selected model (Online 384
Resource 3). 385
T50_CO2_OX increased with depth (from 399 9 to 437 19 °C at 0–10 cm and 80–100 cm,
386
respectively; Fig. 2). Vegetation type was significant only in the top soil layers (0–40 cm) 387
with samples from coniferous plots having a lower T50_CO2_OX than those in deciduous plots
388
(395 6 °C and 405 9 °C, respectively; Fig. 3). Soil class was a significant factor both in 389
layers 0–10 cm (p = 0.0085) and 40–80 cm (p = 0.0489; Table 2) but with contrasting trend: 390
in the surface layer, eutric Cambisols had the highest T50_ CO2_OX (significantly higher than
17
entic Podzols) and the lowest T50_ CO2_OX in the 40–80 cm layer (significantly lower than the
392
dystric Cambisols; Fig. 4; Online Resource 4). Climate was a significant factor in all layers: 393
over the whole profile (0–100 cm), T50_ CO2_OX was lower in mountainous plots than in plots
394
located in the two other climate classes (p ≤ 0.0001–0.0159; Table 2; Fig. 5). 395
396
d. Correlations between soil and climate characteristics and the indicators of SOC stability 397
There were only a few significant and strong correlations between the indicators of SOC 398
stability and soil physico-chemical properties (Table 3). Notably POM-C and T50_HC_PYR, the
399
two indicators of the labile SOC pool, had strong and opposite correlations with HI (ρ = 0.67 400
and −0.67 respectively) and OIRE6 (ρ = −0.76 and 0.63 respectively). POM-C was also
401
positively correlated with C/N ratio (ρ = 0.61). T50_CO2_OX was negatively correlated to the C
402
content (ρ = −0.72; Table 3). Respired-C showed no strong correlation with soil or climate 403
characteristics. In our samples we observed no strong correlation for the four indicators of 404
SOC stability with soil texture, pH (although ρ = −0.54 with POM-C) or the climatic 405
characteristics (MAT or MAP; Table 3). 406
Because of the strong “depth effect” on each indicator of SOC stability, we explored the 407
evolution of these correlations within each soil layer and noticed that they also evolved with 408
depth (Online Resource 5). To describe the similarity or dissimilarity in the different 409
indicators of SOC lability, we conducted a principal component analysis (PCA) at the two 410
depths for which POM-C was available (0−10 and 40−80 cm). In the 0−10 cm layer, the first 411
two principal components (PC) explained almost 60% of the total variance (Fig. 6). PC1 412
clearly separated soil samples dominated by highly labile SOC pool from those dominated by 413
labile SOC pool associated with POM-C. Indeed, along PC1, POM-C and respired-C showed 414
moderate to strong negative and positive loadings respectively, while T50_CO2_OX had moderate
415
positive loadings (Fig. 6). T50_HC_PYR showed strong negative loadings along PC2, while it had
18
very weak negative loadings along PC1. Results were quite different in the 40−80 cm layer, 417
where the first two principal components (PC) explained approximately 63% of the total 418
variance (Fig. 6). In these deeper samples, PC1 tightly grouped soil samples with high 419
proportion of highly labile SOC pool (respired-C) and those with high proportion of labile 420
SOC pool associated with POM-C with strong positive loadings for both indicators along 421
PC1. T50_CO2_OX and T50_HC_PYR had both strong positive loadings along PC2, while they had
422
very weak loadings along PC1. 423
SOC content was not related to any of the indicators of SOC stability in the surface layer, 424
while it was moderately and negatively correlated with POM-C, respired-C and T50_CO2_OX in
425
the deep layer (Fig. 6; Online Resource 5). In the surface layer, pH was associated with 426
positive values on the first PC (high respired-C), while sand content and soil C/N ratio were 427
associated with negative values on the first PC (high POM-C; Fig. 6; Online Resource 5). HI 428
and OIRE6 were well correlated to the indicators of highly labile and labile SOC pools,
429
specifically in the surface layer. Correlations of the physico-chemical variables with POM-C 430
were slightly lower at depth (Online Resource 5), but below 20 cm depth, all these 431
correlations with T50_HC_PYR and respired-C (directly with the indicators or with the PCs) had
432
greatly decreased or even disappeared (Online Resource 5). Conversely, T50_CO2_OX was not
433
more than weakly correlated with the physico-chemical parameters over the whole profile but 434
its positive correlation with MAT tended to be higher in deeper layers (Online Resource 5; 435
Fig.6). 436
The PCA biplot displaying the samples based on their soil class (Fig. 6) showed a difference 437
between eutric Cambisol and entic Podzol with the two first PCs in the surface layer (0–10 438
cm): samples of eutric Cambisols had higher respired-C, lower POM-C and generally higher 439
T50_HC_PYR and T50_CO2_OX than those of entic Podzols.
19
In the deep layer (40–80 cm), the two PCs separated samples of dystric Cambisols from 441
samples of eutric Cambisols. The former were mostly characterized by high respired-C and 442
POM-C values and high values of T50_HC_PYR and T50_CO2_OX. The latter had either high values
443
of T50_HC_PYR and T50_CO2_OX with low respired-C and POM-C or low values of T50_HC_PYR and
444
T50_CO2_OX with high respired-C and POM-C. The second PC separated samples that had more
445
stable SOC (high values on PC2) from those that had less stable SOC (low values on PC2). 446
Dystric Cambisols thus appeared as having more stable SOC than the two other soil classes 447 (Fig. 6). 448 449
Discussion
450a. Depth is the most discriminating factor of SOC stability 451
In our study sites, depth was the most discriminating factor, affecting significantly all 452
indicators of SOC stability. Indeed, with depth, we observed consistent trends for the 453
indicators of the highly-labile (decrease of respired-C) and the labile (decrease of POM-C and 454
increase of T50_HC_PYR) SOC pools, and an opposite trend for the indicator of the stable SOC
455
pool (increase of T50_CO2_OX), verifying our first hypothesis.
456
Studies have shown a decrease in POM-C (% of total SOC) with increasing depth down to 457
20–30 cm (Hassink 1995; Schrumpf and Kaiser 2015), down to 50 cm (Diochon and Kellman 458
2009) or down to > 140 cm (Cardinael et al. 2015; Moni et al. 2010). Previous studies have 459
also reported decreasing respired-C with depth during incubations of variable duration (e.g., 460
Dodla et al. 2012; Gillespie et al. 2014; Schrumpf et al. 2013; Wang and Zhong 2016 with 12 461
days at 22.5 °C, 20 days at 15 °C, 98 days at 25 °C, 60 days at 25 °C, respectively). 462
Variations in soil basal respiration with depth have been related with variations in C dynamics 463
(e.g., Agnelli et al. 2004; Salomé et al. 2010; Wordell-Dietrich et al. 2017). 464
20
Labile SOC content usually decreases while stable SOC increases with depth (e.g., Jenkinson 465
et al. 2008; Lorenz and Lal 2005; Mathieu et al. 2015) and this is correlated with longer SOC 466
turnover rates as exemplified by Torn et al. (1997) and Mathieu et al. (2015) who showed 467
strong effects of depth on SOC mean age. 468
469
b. Soil class as a major factor controlling SOC stability 470
Soil class had significant effects on the indicators of the highly-labile (respired-C) and labile 471
(POM-C and T50_HC_PYR) SOC pools. Contrary to our third hypothesis, these soil effects were
472
not limited to the deeper layers and were indeed present in the surface layer for all four 473
indicators of SOC stability (Table 2). 474
i) Modulation of the effect of depth by soil class 475
The effect of depth on SOC stability, i.e. the decrease of the labile SOC and concomitant 476
increase in stable SOC was modulated by the soil class. First, the surface (0-10 cm) values of 477
all SOC stability parameters varied among soil classes (Table 2; Fig. 4), surface layers of 478
eutric Cambisols being generally enriched in stable SOC compared to other soil classes. This 479
might be explained by a relative higher stabilization of SOC in the surface layer of the eutric 480
Cambisols that could be due to a faster cycling in relation to lower C/N ratios (13.2 1.5 vs. 481
18.4 4.5 for the other two classes) and higher pH (6.2 0.9 vs. 4.3 0.3 for the other two 482
classes), stimulating the mineralization of the more labile SOC and resulting in a more stable 483
SOC overall. SOC stabilisation through Ca-mediated processes (occlusion, inclusion, 484
sorption; Rowley et al., 2018) may also explain the higher SOC stability in surface layers of 485
eutric Cambisols. 486
Then the amplitude of the evolution of SOC stability with depth varied among soil classes 487
(Figure 4). Thus, the higher stability observed in the surface layer of eutric Cambisols had 488
disappeared by 20–40 cm depth. This modulation of the effect of depth by soil class could be 489
21
linked to different types of SOM moieties developed by very different pedogenetic processes, 490
eutric Cambisols showing a relatively more oxidized SOC than other soil classes (higher 491
OIRE6; specifically down to 40 cm depth). In the deep layer, dystric Cambisols were
492
characterized by high OIRE6 values, which could be linked to larger stable SOC pools in this
493
soil class, likely associated with more oxidized SOC moieties (Cécillon et al., 2018). 494
Lastly, in our sites, soil class did not significantly affect the indicator of stable SOC 495
(T50_CO2_OX; at least not for the whole profile model), and the stable SOC pool appeared
496
mostly driven by differences in MAT (specifically at depth; Fig 6; see section d. of the 497
Discussion). This result is seemingly contradictory to the findings of Mathieu et al. (2015) 498
who reported a strong influence of soil type on deep soil mean carbon age. It should be noted 499
that these authors covered a greater soil variability in their study and if we focus on the 3 soil 500
classes considered in our work, their results are similar to ours (i.e., no large difference among 501
the three soil classes). 502
ii) Soil variables explaining the pedological effect on SOC stability 503
Soil type is not often used as an explanatory factor of variations in SOC quality/stability (e.g., 504
Wiesmeier et al. 2014) and physico-chemical properties (e.g., clay content, pH, etc.) are often 505
preferred (e.g., Tian et al. 2016). We thus wondered whether a series of physico-chemical 506
parameters could have summarized the soil class effect on SOC stability. 507
The effect of soil type on the highly-labile and labile SOC pools may be due to differences in 508
soil texture (sand content), pH or C/N ratio (Online Resource 6, Fig. 6). Indeed, a strong 509
effect of soil texture on SOC stability in the topsoil (0–10 cm) has previously been reported in 510
the literature. For instance, just like we did (POM-C in coarse-textured entic Podzols = 25.1 511
7.6% vs. 19.2 5.6% in fine-textured eutric Cambisols; Fig. 4; Online Resource 4), several 512
studies have observed a trend of more labile SOC (expressed as POM-C or size of the 513
22
intermediate SOC pool) in coarser soils (Schiedung et al. 2017; Wiesmeier et al. 2014) or 514
directly linked to the sand fraction (Tian et al. 2016; Vos et al. 2017). 515
In our sites, respired-C was higher in fine-textured soils up to 40 cm depth and was 516
significantly lower in Podzols. Conversely, several studies have reported higher C 517
mineralization rates in sandy soils than in finer-textured soils in various contexts from boreal 518
forests through croplands in Norway and all the way to Brazil (Bauhus et al. 1998; Frøseth 519
and Bleken 2015; Schmatz et al. 2017). These opposite results could originate from various 520
sources, and specifically differences in C/N ratio. For our sites, the topsoil C/N ratio in eutric 521
Cambisols was significantly lower (13.3 1.5) than in entic Podzols (19.9 5; Online 522
Resource 4), which could affect the microbial use efficiency during the incubation (e.g., 523
Cotrufo et al. 1995). Differences in pH could be another good explanation. Our entic Podzols 524
and eutric Cambisols had lower and higher pH than the till (≈ sandy) and clay soils from the 525
Bauhus et al. (1998) study, respectively. It has been shown that a slight increase in pH could 526
significantly increase rates of mineralization (Curtin et al. 1998). 527
All these physico-chemical variables reflect the importance of SOM stoichiometry (C/N ratio) 528
(Ågren et al. 2013; Cleveland and Liptzin 2007) and substrate accessibility (reduced 529
protection via aggregation in sandy soils or increase in dissolved OM with higher pH) for its 530
degradation (Dungait et al. 2012; Schmidt et al. 2011). However the lack of or low to 531
moderate correlations between the different indicators of SOC stability and these soil physico-532
chemical parameters (texture and pH respectively; Table 3) suggest that there is not one 533
characteristics only responsible for the soil effect we observed or that, at least, they are not 534
valid at all depths of the soil profile as we have shown (Online Resource 5; Fig. 6). There are 535
likely complex interactions, reflecting pedogenetic processes behind this and, in that regard, 536
the soil class is integrative and goes beyond simple soil physico-chemical characteristics, and 537
is thus capable of reflecting variations in SOC stability. 538
23 539
c. Vegetation type mostly affects SOC stability in topsoils 540
In our study sites, the effect of vegetation type (coniferous forest vs. deciduous forest) on 541
SOC stability was concentrated on the surface layer (0–10 cm), thus validating part of our 542
second hypothesis. Vegetation type significantly influenced both thermal indicators of SOC 543
stability in surface soil layers while the classical indicators of the highly labile (respired-C) 544
and the labile (POM-C) SOC pools were not affected by vegetation. 545
Effects of vegetation on the labile SOC pool have been previously reported, but they were 546
mainly observed at the tree species level (Bauhus et al. 1998; Augusto et al. 2002; Hobbie et 547
al. 2007; Olsen and Van Miegroet 2010; Laganière et al. 2012; Vesterdal et al. 2012; You et 548
al. 2016). Conversely, previous studies have also reported a lack of difference in the highly 549
labile SOC pool (estimated by respired-C) of topsoils in deciduous and coniferous stands 550
(Fissore et al. 2008; Van Miegroet et al. 2005). 551
In our study sites, the surface layer (0–10 cm) of coniferous stands had more labile SOC 552
(lower T50_HC_PYR) but also less stable SOC (lower T50_CO2_OX) than in deciduous stands,
553
validating the second part of our second hypothesis. Similar findings were reported in 554
Bavarian forests, where deciduous and mixed stands showed smaller labile SOC and larger 555
stable SOC pools than coniferous stands (Wiesmeier et al. 2014). 556
Deciduous forests indeed tend to rely on a more rapid nutrient cycling between soil and plant 557
(Cole and Rapp 1981). Quideau et al. (2001) showed that oak-derived SOM has undergone 558
extensive oxidation compared with the litter, while SOM under coniferous vegetation became 559
enriched in recalcitrant alkyl C. The authors conclude that deciduous stands were 560
characterized by a high microbial activity and rapid nutrient release whereas the accumulated 561
SOM in coniferous forests had a low bioavailability. The higher pH values of the litter in 562
deciduous stands favour bioturbation and incorporation of OM in surface mineral soil, 563
whereas the more acidic coniferous litter accumulates in the organic layers (e.g., Wiesmeier et 564
24
al. 2013). These results could also be explained by lower C/N ratios in deciduous plots (e.g., 565
Cools et al. 2014). C/N ratio in deciduous stands (15.0 2.8) were indeed lower than in 566
topsoils under coniferous (18.4 5.1) and closer to that of the microbial biomass. This 567
difference in C/N ratios between the two vegetation types was more drastic when considering 568
the plant inputs (deciduous = 46.5 9.5; coniferous = 60.9 16.8; data not shown) and high 569
C/N ratios in litter are often associated with low decomposition rates (Melillo et al. 1982; 570
Norby et al. 2001; Tian et al. 2016). This would result in a higher litter mineralization 571
potential in deciduous stands and because the highly labile/labile pool is utilized more readily 572
in these plots (higher litter C turnover), it would result in a smaller size of the labile pool in 573
deciduous stands and thus a higher T50_HC_PYR. Indeed, there was a negative and moderate
574
correlation between T50_HC_PYR and the inputs C/N ratio, but only in the top layer (Online
575
Resource 5). In the long term, the low C/N ratio of the deciduous litters could also explain the 576
higher T50_CO2_OX through higher SOC stabilization (Berg 2000). This highlights the
577
importance of the bulk chemistry of SOC inputs (Hobbie et al. 2007; You et al. 2016) for 578
SOC cycling. This difference in SOC stability (in the mineral soil) between the two 579
vegetation types has also been mentioned in the review by Augusto et al. (2015) and the 580
reasons of this difference identified as a future research need. 581
The limited effect of vegetation types in our study sites could be linked to species 582
heterogeneity within the two vegetation types and this might be an important limitation of this 583
work. We chose to consider vegetation types and not tree species to obtain a more balanced 584
design (29 plots in coniferous stands and 24 in deciduous stands; Fig. 1a) and our deciduous 585
stands included both beech and oak-dominated forests. Inter-species variations in terms of 586
their characteristics (e.g., aboveground litter composition; roots) and their effects on the soil 587
could explain, at least partially, the limited effects of the (broad) vegetation classes in this 588
study. Some studies have indeed reported an effect of tree species on both in-situ and 589
25
laboratory soil respiration rates (measured over a year) (Hobbie et al. 2007; Vesterdal et al. 590
2012). In oak stands, the respiration rate was greater than in beech stands, but similar to those 591
in spruce stands, illustrating that the deciduous/coniferous dichotomy might be masking some 592
species effects, at least on the labile SOC pool, but quite likely also on the stable SOC pool. 593
594
d. Climatic control of the stable SOC pool 595
In our study, climate effects on SOC stability were concentrated on the stable SOC pool. Soils 596
located in plots with mountainous climate had higher C content (data not shown) than those in 597
plots in regions with oceanic or continental influence. However this higher concentration was 598
not associated with climate effects on the labile SOC indicators. Nevertheless climate was a 599
strong driver of the stable SOC indicator, SOC being less stable (lower T50_ CO2_OX) in
600
mountainous plots. Our last hypothesis (SOC in mountainous plots would be more labile) was 601
thus only partially verified. 602
In Bavarian forests (Wiesmeier et al. 2014), the passive SOC pool (roughly equivalent to our 603
stable SOC pool) was negatively related to MAP, which agrees with our results as the 604
mountainous plots were the wettest (1323 297 mm) and there were negative correlations 605
between MAP and T50_CO2_OX in almost all layers (Online Resource 5). However, unlike us,
606
Wiesmeier et al. (2014) also detected a strong climate effect on the labile SOC as the latter 607
was under the control of both temperature and precipitation, and the most labile SOC was 608
found in mountainous regions. Similarly, Meier and Leuschner (2010) reported more labile 609
SOC when temperature decreased and precipitation increased, while Leifeld et al. (2009) 610
reported more POM-C at higher elevation in grasslands. In our study sites, there were no 611
more than weak correlations between our labile SOC pools and MAT and MAP, even when 612
considering individual layers (Online Resource 5). Nevertheless, it should be noted that the 613
mean elevation of our mountainous plots was 1230 m ( 280 m) while Leifeld et al. (2009) 614
26
had 5 out of their 8 sites located at ≥ 1410 m elevation. Finally, this “high elevation” effect on 615
the labile fraction, expressed as POM-C requires caution as, in mountainous regions, lower 616
MAT tend to reduce microbial activity thus favouring SOC accumulation (e.g., Tewksbury 617
and Van Miegroet 2007), even in tropical areas (Araujo et al. 2017). In cold environments, the 618
residence time of this “labile” (as very close to the litter inputs) SOC is much longer than in 619
more temperate climate (Leifeld et al. 2009). In that particular context, the relationship 620
between thermal stability and SOC residence time/turnover may also be questioned and 621
requires further study. 622
Another possible limitation of the present study is that vegetation and climate appeared to be 623
confounded factors in our design with coniferous plots being preferentially found in 624
mountainous regions: our coniferous plots had a mean elevation of 831 m ( 476 m) while it 625
was 511 m ( 413 m) in the deciduous plots. This had an incidence on the MAT especially 626 (Online Resource 6). 627 628 629
Conclusions
630In this study, thanks to a large set of forest soil samples with contrasted SOC stability and the 631
use of several indicators, we were able to highlight the influence of four environmental factors 632
on SOC stability: depth, soil, vegetation and climate; with the degree of significance of these 633
factors (and their interactions) varying among the SOC pools. 634
Our results show that pedology is a discriminant factor of SOC stability, more than individual 635
soil physico-chemical attributes. Soil type constitutes an integrated parameter that might be an 636
efficient way to capture SOC turnover properties. Upon modification in land management that 637
would result in a decrease of C inputs to the soil, our results let suggest that the SOC of eutric 638
27
Cambisols may be less sensitive than the one of dystric Cambisols but specifically of entic 639
Podzols that may be more prone to losses. 640
To conclude, soil class, vegetation type and climatic zone all had a significant influence on 641
SOC stability at various depths in our studied French forest soils and these environmental 642
factors should thus be included in models estimating the ecosystem service of climate 643 regulation. 644 645 646
Acknowledgements
647This work was supported by the French Environment and Energy Management Agency 648
(ADEME) [APR REACCTIF, piCaSo project] and Campus France [PRESTIGE-2015-3-649
0008]. We thank M. Bryant, S. Cecchini, J. Mériguet, F. Savignac, and L. Le Vagueresse for 650
their technical support. 651
652
References
653
Agnelli A, Ascher J, Corti G, Ceccherini MT, Nannipieri P, Pietramellara G (2004) 654
Distribution of microbial communities in a forest soil profile investigated by microbial 655
biomass, soil respiration and DGGE of total and extracellular DNA. Soil Biol Biochem. doi: 656
10.1016/j.soilbio.2004.02.004 657
Ågren GI, Hyvönen R, Berglund SL, Hobbie SE (2013) Estimating the critical N:C from 658
litter decomposition data and its relation to soil organic matter stoichiometry. Soil Biol 659
Biochem. doi: 10.1016/j.soilbio.2013.09.010 660
Amundson R (2001) The Carbon Budget in Soils. Annu Rev Earth Planet Sci 29:535-562. 661
doi: 10.1146/annurev.earth.29.1.535 662
28
Araujo MA, Zinn YL, Lal R (2017) Soil parent material, texture and oxide contents have 663
little effect on soil organic carbon retention in tropical highlands. Geoderma. doi: 664
10.1016/j.geoderma.2017.04.006 665
Augusto L, Ranger J, Binkley D, Rothe A (2002) Impact of several common tree species of 666
European temperate forests on soil fertility. Ann For Sci 59:233-253 667
Augusto L, De Schrijver A, Vesterdal L, Smolander A, Prescott C, Ranger J (2015) 668
Influences of evergreen gymnosperm and deciduous angiosperm tree species on the 669
functioning of temperate and boreal forests. Biol Rev 90:444-466. doi: 10.1111/brv.12119 670
Balesdent J (1996) The significance of organic separates to carbon dynamics and its 671
modelling in some cultivated soils. Eur J Soil Sci 47:485-493. doi: 10.1111/j.1365-672
2389.1996.tb01848.x 673
Barré P, Durand H, Chenu C, Meunier P, Montagne D, Castel G, Billiou D, 674
Soucémarianadin L, Cécillon L (2017) Geological control of soil organic carbon and nitrogen 675
stocks at the landscape scale. Geoderma 285:50-56. doi: 10.1016/j.geoderma.2016.09.029 676
Barré P, Plante AF, Cécillon L, Lutfalla S, Baudin F, Christensen BT, Eglin T, Fernandez 677
JM, Houot S, Kätterer T, Le Guillou C, Macdonald A, van Oort F, Chenu C (2016) The 678
energetic and chemical signatures of persistent soil organic matter. Biogeochemistry 130:1-679
12. doi: 10.1007/s10533-016-0246-0 680
Bates D, Mächler M, Bolker B, Walker S (2015) Fitting Linear Mixed-Effects Models 681
Using lme4. Journal of Statistical Software, Articles 67:1-48 682
Bauhus J, Paré D, Côté L (1998) Effects of tree species, stand age and soil type on soil 683
microbial biomass and its activity in a southern boreal forest. Soil Biol Biochem. doi: 684
10.1016/S0038-0717(97)00213-7 685
Behar F, Beaumont V, Penteado DB (2001) Rock-Eval 6 Technology: Performances and 686
Developments. Oil Gas Sci Technol 56:111-134. doi: 10.2516/ogst:2001013 687
29
Beleites C, Sergo V (2015) hyperSpec: a package to handle hyperspectral data sets in R 688
Berg B (2000) Litter decomposition and organic matter turnover in northern forest soils. 689
For Ecol Manage 133:13-22. doi: 10.1016/S0378-1127(99)00294-7 690
Borchers HW (2015) pracma: Practical numerical math functions 691
Brêthes A, Ulrich E, Lanier M (1997) RENECOFOR : caractéristiques pédologiques des 692
102 peuplements du réseau : observations de 1994/95. Office national des forêts, Département 693
des recherches techniques, Fontainebleau, France 694
Camino-Serrano M, Gielen B, Luyssaert S, Ciais P, Vicca S, Guenet B, Vos BD, Cools N, 695
Ahrens B, Altaf Arain M, Borken W, Clarke N, Clarkson B, Cummins T, Don A, Pannatier 696
EG, Laudon H, Moore T, Nieminen TM, Nilsson MB, Peichl M, Schwendenmann L, Siemens 697
J, Janssens I (2014) Linking variability in soil solution dissolved organic carbon to climate, 698
soil type, and vegetation type. Glob Biogeochem Cycles 28:497-509. doi: 699
10.1002/2013GB004726 700
Canadell JG, Le Quéré C, Raupach MR, Field CB, Buitenhuis ET, Ciais P, Conway TJ, 701
Gillett NP, Houghton RA, Marland G (2007) Contributions to accelerating atmospheric CO2
702
growth from economic activity, carbon intensity, and efficiency of natural sinks. PNAS 703
104:18866-18870. doi: 10.1073/pnas.0702737104 704
Cardinael R, Chevallier T, Barthès BG, Saby NPA, Parent T, Dupraz C, Bernoux M, 705
Chenu C (2015) Impact of alley cropping agroforestry on stocks, forms and spatial 706
distribution of soil organic carbon — A case study in a Mediterranean context. Geoderma 707
259–260:288-299. doi: 10.1016/j.geoderma.2015.06.015 708
Carter MR, Gregorich EG, Angers DA, Donald RG, Bolinder MA (1998) Organic C and N 709
storage, and organic C fractions, in adjacent cultivated and forested soils of eastern Canada. 710
Soil Tillage Res. doi: 10.1016/S0167-1987(98)00114-7 711
30
Cécillon L, Baudin F, Chenu C, Houot S, Jolivet R, Kätterer T, Lutfalla S, Macdonald A, 712
van Oort F, Plante AF, Savignac F, Soucémarianadin L, Barré P (2018) A model based on 713
Rock-Eval thermal analysis to quantify the size of the centennially persistent organic carbon 714
pool in temperate soils. Biogeosciences Discussions 2018:1-25. doi: 10.5194/bg-2018-15 715
Cleveland CC, Liptzin D (2007) C:N:P stoichiometry in soil: is there a "Redfield ratio" for 716
the microbial biomass?. Biogeochemistry 85:235-252. doi: 10.1007/s10533-007-9132-0 717
Cole DW, Rapp M (1981) Elemental cycling in forest ecosystems. In: Reichle DE (ed) 718
Dynamic Properties of Forest Ecosystems. Cambridge University Press, pp 341-409 719
Coleman K, Jenkinson D (1999) RothC-26.3. A Model for the Turn-over of Carbon in 720
Soils. Model Description and Windows Users Guide. IACR – Rothamsted, Harpenden. 721
Cools N, Vesterdal L, De Vos B, Vanguelova E, Hansen K (2014) Tree species is the 722
major factor explaining C:N ratios in European forest soils. Forest Ecol Manag. doi: 723
10.1016/j.foreco.2013.06.047 724
Cotrufo FM, Ineson P, Roberts DJ (1995) Decomposition of birch leaf litters with varying 725
C-to-N ratios. Soil Biol Biochem. doi: 10.1016/0038-0717(95)00043-E " 726
Crow SE, Swanston CW, Lajtha K, Brooks JR, Keirstead H (2007) Density fractionation 727
of forest soils: methodological questions and interpretation of incubation results and turnover 728
time in an ecosystem context. Biogeochemistry 85:69-90. doi: 10.1007/s10533-007-9100-8 729
Curtin D, Campbell CA, Jalil A (1998) Effects of acidity on mineralization: pH-730
dependence of organic matter mineralization in weakly acidic soils. Soil Biol Biochem. doi: 731
10.1016/S0038-0717(97)00094-1 732
Diochon AC, Kellman L (2009) Physical fractionation of soil organic matter: 733
Destabilization of deep soil carbon following harvesting of a temperate coniferous forest. J 734
Geophys Res 114. doi: 10.1029/2008JG000844 735
31
Disnar JR, Guillet B, Keravis D, Di-Giovanni C, Sebag D (2003) Soil organic matter 736
(SOM) characterization by Rock-Eval pyrolysis: scope and limitations. Org Geochem 34:327-737
343. doi: 10.1016/S0146-6380(02)00239-5 738
Dodla SK, Wang JJ, DeLaune RD (2012) Characterization of labile organic carbon in 739
coastal wetland soils of the Mississippi River deltaic plain: Relationships to carbon 740
functionalities. Sci Total Environ 435–436:151-158. doi: 10.1016/j.scitotenv.2012.06.090 741
Dungait JAJ, Hopkins DW, Gregory AS, Whitmore AP (2012) Soil organic matter 742
turnover is governed by accessibility not recalcitrance. Glob Change Biol 18:1781-1796. doi: 743
10.1111/j.1365-2486.2012.02665.x 744
Feng W, Shi Z, Jiang J, Xia J, Liang J, Zhou J, Luo Y (2016) Methodological uncertainty 745
in estimating carbon turnover times of soil fractions. Soil Biol Biochem 100:118-124. doi: 746
10.1016/j.soilbio.2016.06.003 747
Fissore C, Giardina CP, Kolka RK, Trettin CC, King GM, Jurgensen MF, Barton CD, 748
McDowell SD (2008) Temperature and vegetation effects on soil organic carbon quality along 749
a forested mean annual temperature gradient in North America. Global Change Biol 14:193-750
205. doi: 10.1111/j.1365-2486.2007.01478.x 751
Fox J, Weisberg S (2011) An R Companion to Applied Regression 752
Frøseth RB, Bleken MA (2015) Effect of low temperature and soil type on the 753
decomposition rate of soil organic carbon and clover leaves, and related priming effect. Soil 754
Biol Biochem. doi: 10.1016/j.soilbio.2014.10.004 755
Gillespie AW, Sanei H, Diochon A, Ellert BH, Regier TZ, Chevrier D, Dynes JJ, Tarnocai 756
C, Gregorich EG (2014) Perennially and annually frozen soil carbon differ in their 757
susceptibility to decomposition: Analysis of Subarctic earth hummocks by bioassay, XANES 758
and pyrolysis. Soil Biol Biochem 68:106-116. doi: 10.1016/j.soilbio.2013.09.021 759
32
Golchin A, Oades JM, Skjemstad JO, Clarke P (1994) Study of free and occluded 760
particulate organic matter in soils by solid state 13C CP/MAS NMR spectroscopy and 761
scanning electron microscopy. Aust J Soil Res 32:285-309. doi: 10.1071/SR9940285 762
Gregorich EG, Gillespie AW, Beare MH, Curtin D, Sanei H, Yanni SF (2015) Evaluating 763
biodegradability of soil organic matter by its thermal stability and chemical composition. Soil 764
Biol Biochem 91:182-191. doi: 10.1016/j.soilbio.2015.08.032 765
Harris D, Horwáth WR, van Kessel C (2001) Acid fumigation of soils to remove 766
carbonates prior to total organic carbon or CARBON-13 isotopic analysis. Soil Sci Soc Am J 767
65:1853-1856. doi: 10.2136/sssaj2001.1853 768
Hassink J (1995) Density fractions of soil macroorganic matter and microbial biomass as 769
predictors of C and N mineralization. Soil Biol Biochem 27:1099-1108. doi: 10.1016/0038-770
0717(95)00027-C 771
Hobbie SE, Ogdahl M, Chorover J, Chadwick OA, Oleksyn J, Zytkowiak R, Reich PB 772
(2007) Tree species effects on soil organic matter dynamics: The role of soil cation 773
composition. Ecosystems 10:999-1018. doi: 10.1007/s10021-007-9073-4 774
Intergovernmental Panel on Climate Change (2000) Land Use, Land-Use Change and 775
Forestry - A Special Report of the IPCC. Cambridge University Press, Cambridge, UK 776
IUSS Working Group (2015) World reference base for soil resources 2014 (update 2015), 777
international soil classification system for naming soils and creating legends for soil maps. 778
World Soil Resources Reports 779
Jandl R, Lindner M, Vesterdal L, Bauwens B, Baritz R, Hagedorn F, Johnson DW, 780
Minkkinen K, Byrne KA (2007) How strongly can forest management influence soil carbon 781
sequestration?. Geoderma 137:253-268. doi: 10.1016/j.geoderma.2006.09.003 782
33
Jarvis PG, Ibrom A, Linder S (2005) 'Carbon forestry': managing forests to conserve 783
carbon. In: Griffiths HG, Jarvis PG (eds) The Carbon Balance of Forest Biomes. Taylor & 784
Francis, pp 356-377 785
Jenkinson DS, Poulton PR, Bryant C (2008) The turnover of organic carbon in subsoils. 786
Part 1. Natural and bomb radiocarbon in soil profiles from the Rothamsted long-term field 787
experiments. Eur J Soil Sci 59:391-399. doi: 10.1111/j.1365-2389.2008.01025.x 788
Jobbágy EG, Jackson RB (2000) The vertical distribution of soil organic carbon and its 789
relation to climate and vegetation. Ecol Appl 10:423-436. doi: 10.1890/1051-790
0761(2000)010[0423:TVDOSO]2.0.CO;2 791
Jonard M, Nicolas M, Coomes DA, Caignet I, Saenger A, Ponette Q (2017) Forest soils in 792
France are sequestering substantial amounts of carbon. Sci Total Environ 574:616-628. doi: 793
10.1016/j.scitotenv.2016.09.028 794
Kassambara A, Mundt F (2016) factoextra: Extract and Visualize the Results of 795
Multivariate Data Analyses 796
Kindermann G, McCallum I, Fritz S, Obersteiner M (2008) A global forest growing stock, 797
biomass and carbon map based on FAO statistics. Silva Fenn 42. doi: 10.14214/sf.244 798
Lafargue E, Marquis F, Pillot D (1998) Rock-Eval 6 Applications in Hydrocarbon 799
Exploration, Production, and Soil Contamination Studies. Oil Gas Sci Technol 53:421-437. 800
doi: 10.2516/ogst:1998036 801
Laganière J, Paré D, Bergeron Y, Chen HYH (2012) The effect of boreal forest 802
composition on soil respiration is mediated through variations in soil temperature and C 803
quality. Soil Biol Biochem. doi: 10.1016/j.soilbio.2012.04.024 804
Leifeld J, Zimmerman M, Fuhrer J, Conen F (2009) Storage and turnover of carbon in 805
grassland soils along an elevation gradient in the Swiss Alps. Global Change Biol 15:668-806
679. doi: 10.1111/j.1365-2486.2008.01782.x 807