A Distributed Approach to Underwater Acoustic
Communications
by
Christopher George Bohner
Submitted to the Department of Ocean Engineering in partial fulfillment of the requirements for the degree of
Master of Science in Ocean Engineering at the
MASSACHUSETTS INSTITUTE OF TECHNOLOGY
and the
WOODS HOLE OCEANOGRAPHIC INSTITUTION September 2003
C 2003 Christopher George Bohner. All rights reserved.
OF TECHNOLOGY
CT 0
7UIBRAR IES The author hereby grants to MIT and WHOI permission to reproduce and distribute
publicly paper and electronic copies of this thesis document in whole or in part.
Author ...
Joint Program in Applied Ocean Science and Engineering Massachusetts Institute of Technology And Woods Hole Oceanographic Institution September 2003 Certified by...
Secretary of the
Professor Arthur B. Baggeroer Ford Professor of Engineering Navy/Chief of Naval Operations Chair for Ocean Sciences Massachusetts Institute of Technology
/ Thesis Supervisor
Accepted by ... ...
Mark Grosenbaugh Chairman, Joint Committee for Applied Ocean Science and Engineering Massachusetts Institute of Technology/Woods Hole Oceanographic Institution
A Distributed Approach to Underwater Acoustic
Communications
by
Christopher George Bohner
Submitted on July 15, 2003, in partial fulfillment of the requirements for the degree of Master of Science in Ocean Engineering
at the
MASSACHUSETTS INSTITUTE OF TECHNOLOGY
and the
WOODS HOLE OCEANOGRAPHIC INSTITUTION July 2003
ABSTRACT
A novel distributed underwater acoustic networking (UAN) protocol suitable for
ad-hoc deployments of both stationary and mobile nodes dispersed across a relatively wide coverage area is presented. Nodes are dynamically clustered in a distributed manner based on the estimated position of one-hop neighbor nodes within a shallow water environment. The spatial dynamic cellular clustering scheme allows scalable communication resource allocation and channel reuse similar in design to land-based cellular architectures, except devoid of the need for a centralized controlling infrastructure. Simulation results demonstrate that relatively high degrees of interference immunity, network connectivity, and network stability can be achieved despite the severe limitations of the underwater acoustic channel.
Thesis Supervisor: Arthur B. Baggeroer Title: Ford Professor of Engineering
Acknowledgements
My most gracious thanks are extended to my thesis advisor, Arthur Baggeroer, for
his professional involvement in my academic career at both MIT and WHOI. His wise guidance and kind support were invaluable to my thesis work and instrumental to my academic success.
A special thanks to Milica Stojanovic for her personal influences and professional
advice with regards to undersea communications. Her encouragement and support were important in the laying the foundation of my work.
My opportunity to participate in graduate studies at MIT and WHOI was made
possible through the Secretary of the Navy's Program in Oceanography and Oceanographic Engineering and RADM Wilson, USN, Oceanographer of the Navy.
A special thanks to Capt Ferdinand Diemer, USN, for his professional mentoring and
personal advice throughout my naval career. His personal involvement allowed me to see and do things with my life I never thought possible.
While working hard at school, playing hard was made all the merrier by the multitude of friends I have made while at MIT and WHOI: Ted Schroeder, Rob Crofoot, Steven Roe, Doug Lemon, and Dan. Thanks for all the good times.
Finally, they say that behind every good man is an even greater woman. I am truly blessed to share my life with a woman whose personal attributes far exceed the depths of this assertion. The heavy burdens of my academic studies and professional endeavors were equally taxing to both my wife Shelly and my two children, Emily and Ryan. Their infinite patience and unwavering support were essential to my success as a student and serves as a testament to our love as a family. Thank you Shelly, I love you.
Table of Contents
CHAPTER 1 Introduction ... 17
1.1 M otivation... . 17
1.1.1 Centralized Communication Networks... 19
1.1.2 Distributed Communication Networks ... 21
1.2 Complexities of Underwater Acoustic Network Design ... 23
1.3 Spatially Dynamic Cellular Clustering ... 25
1.4 Related Work... 27
1.4.1 Adaptive Clustering for Ad-hoc Networks... 28
1.4.2 Current Underwater Acoustic Network Designs ... 29
1.4.3
Spread-Spectrum Acoustic Modems ... 311.5 Thesis Organization... 32
CHAPTER 2 Background... 33
2.1 Underwater Acoustic Communications... 33
2.1.1 Attenuation Losses... 34
2.1.2 Geometric Spreading Losses ... 36
2.1.3 Sound Speed ... 38
2.1.4 Reverberation... 39
2.2 Spread Spectrum Communications... 42
2.3 The Cellular Concept... 49
2.3.1 Multiple Access Techniques in Cellular Systems ... 50
2.3.2 Frequency Reuse... 52
CHAPTER 3 Spatially Dynamic Cellular Clustering... 56
3.1 Network Organization ... 56
3.1.1 Determination of Network Structure ... 57
3.1.2 Cell Coverage Area Considerations... 59
3.1.3 Node Clustering and Cell Orientation ... 63
3.2.1 Cell Hopping Algorithm ... 66
3.2.2 Cell M em bership Algorithm ... 68
3.2.3 N ode Cell Clustering ... 71
3.3 M edium Access Control Protocol... 76
CHAPTER 4 Sim ulation ... 84
4.1 Perform ance M etrics... 84
4.1.1 Receiver SIR Perform ance... 84
4.1.2 N etworking Perform ance ... 85
4.2 Node Placem ent and M obility M odel... 85
4.3 Receiver SIR Sim ulations... 88
4.3.1 Sim ulation Setup ... 88
4.3.2 W orst Case Receiver SIR... 89
4.3.3 Average Receiver SIR... 91
4.4 N etworking Perform ance Sim ulations... 94
4.4.1 Sim ulation Setup... 95
4.4.2 Cell Hopping Parameters and Network Connectivity... 96
4.4.3 N ode Position Errors and Network Stability ... 100
CHAPTER 5 Conclusions... 104
5.1 Contributions of the Thesis... 105
5.2 Future W ork ... 106
APPENDIX A Spatially Dynamic Cellular Clustering Pseudocode... 108
A .1 Cell Hopping Algorithm ... 108
A .2 Cell M em bership Algorithm ... 110
A .3 N ode Cell Clustering Algorithm ... 113
List Of Figures
Figure 1-1 Military application of underwater acoustic communications technology. The information from land, air, space, and sea assets can be readily correlated by operators in the Tactical Infromation Network center to provide component commanders with an accurate detail of the undersea battlespace picture... 18
Figure 1-2 Placement of relay nodes in a centralized network. The master node provides an information gateway between nodes in the UAN an operators on the surface or land. The anchored relay nodes coordinate communications between nodes that are beyond the
communications coverage area afforded by the master node... 19
Figure 1-3 Comparison between a centralized and distributed network. The blue arros indicate the links that are actively engaged in communications and the red dotted lines indicate the available links that are not active at this time. In a centralized network only the master node and the slave node can communicate at one time, whereas in a distributed network several pairs of nodes m any com m unicate at any given tim e... 21 Figure 1-4 Comparision between the relative coverage areas of a centralized and distributed network.
Any node located outside the maximum communications range of either the master or relay nodes is unable to communicate in a centralized network. In a distributed network, several paths exist between nodes provided the range between nodes does not exceed the maximum communications range of the acoustic modem . ... 22
Figure 1-5 Example of a complete hopping cycle using the spatially dynamic cellular clustering scheme. A hopping pattern with 3 clustering points was used in this example. (a) The distributed clustering algorithm clusters nodes into co-located cells using the position information of one-hop neighbor nodes. Once clusters, the nodes within a cell can
communicate using the resources allocated to that specific geographic cell. (b) The cellular pattern is repositioned to allow new node clusters to be formed by previously adjacent cells. (c) The process is repeated for each hopping point in the cellular hopping pattern. At the
completion of the hopping cycle the process of cell shifting and re-clustering has generated
multiple communication paths between all nodes within the network. ... 26
Figure 2-1 Seawater absorption versus frequency. ... 35
Figure 2-2 Homogeneous fluid layer bounded by arbitrary horizontally stratifieid media with plane wave reflection coefficients Rs and RB. The proximity of a vertical boundary to the source and the receiver in a shallow water channel gives rise to multiple propagation paths... 39
Figure 2-3 Example of the impulse response and frequency response for an UACC. ... 38
Figure 2-4 Functional block diagram of a direct sequence spread spectrum (DSSS) transmitter (top) and receiver (bottom ). ... 42
Figure 2-5 Example of 3 orthogonal PN codes generated using Walsh-Hadamard sequences with a spreading factor of 8... 42
Figure 2-6 Functional bloch diagram of a frequency hopping spread spectrum (FHSS) transmitter (top) and receiver (bottom )... 43
Figure 2-7 Functional block diagram of a RAKE based DSSS receiver... 46
Figure 2-8 Functional block diagram of a hypothesis feedback equalizer... 47
Figure 2-9: Typical m obile cellular network... 49
Figure 2-10 M ulitple access techniques ... 50
Figure 2-11 Cluster geometry. (a) clusters of sizes of 3, 7, and 12, (b) clusters of reuse size N=7 combined to cover a larger geographic area, and (c) the cell coordinate system... 52
Figure 3-1 Comparison between a traditional cellular system (a) and a distributed cellular system (b).
The transmitting nodes are represented in red while the receiving nodes are in green...57
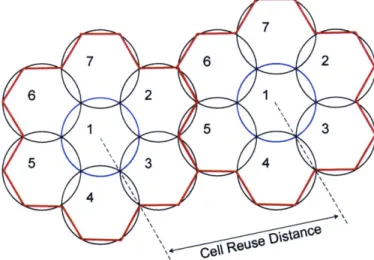
Figure 3-2 Allocation of PN codes in a K=7 cell reuse pattern. The number assigned to each cell represents the specific PN code that nodes can use to communicate in the co-located geogrpahic area. PN codes are reused as the cell clusters are adjoined to cover a larger geographic area. The cell reuse distance is the minimum distance between cells using the same PN code...60
Figure 3-3 Transmitter (red), receiver (green), co-channel interferers (blue), and adjacent channel interferers (black) in a distributed cellular network ... 63
Figure 3-4 Demonstration of a full hop cycle and the resultant network routing graph for Node 1. The solid red arrows indicate the next hop point. The red arcs in the Node Routing Graph indicate available 2 hop paths to distant nodes. ... 64
Figure 3-5 C ell hopping geom etry... 67
Figure 3-6 Determination of cell membership in a K=7 cell reuse pattern...69
Figure 3-7 Node cell membership matrix for 6 node in a K=7 cell reuse pattern...70
Figure 3-8 Minimizing the effects of the near-far problem with pre-clustering. (a) The distributed clustering algorithm compares the range proximity between each pair of nodes in the network to determine if a potential near-far problem exists. (b) Those nodes that are within too close of a proximity to one another are pre-clustered together as a supernode (red ring). (c) The clustering algorithm will uses these supernodes to then cluster nodes accoringly...72
Figure 3-9 Example of a node clustering conflict. The position of th nodes within the orange circle are know to node A ... 75
Figure 3-10 TDMA with reservations timing diagram. The maximum propagation delay guard time used in UANs consumes a significant portion of the total slot time ... 79
Figure 3-11 Diagram of how successive transmission priority scheme can reduce the time wasted from w aiting for the channel to clear. ... 80
Figure 3-12 Transmission timing diagram for a distributed cellular UAN of 4 nodes using a hybrid MSAP MAC protocol. The red dashed lines indicate the reset point of the minislot timing at each node for a significant transm ission event... 80
Figure 4-1 Node distributions used in the simulation of the spatially dynamic cellular clustering algorithm. The evenly distributed placement of nodes is useful for simulating a specific node density. The node placement in the random star distribution closely mimics the dispersion of several mobile nodes deployed from a specific point. The random index distribution is a general pupose distribution that is used to define the starting node placements for a random walk simulation. The nearly straight-line appearance of the random sequence distribution is used to simulate the placement of air dropped nodes ... 86
Figure 4-2 Example of a random walk using the parameters 0 and F to define the next northing and easting position of a node... 88 Figure 4-3 Worst-case positioning of transmitter (red), receiver (green), co-channel interferer (blue),
and adjacent channel interferer (black) in a K = 7 cell reuse pattern. The figure on the left
shows the relative position of the co-channel interferers while the one on the right shows the adjacent channel interfererd. The red ring represents the proximity limit between the receiver and nearby adjacent channel nodes... 89 Figure 4-4 Worst case SIR versus processing gain for K = 7, 12, and 19 cell reuse patterns ... 89
Figure 4-5 A comparison between the average time above SIR for co-channel and adjacent channel interferers. Adjacent channel users are the predominant source of interference at the receiver 91 Figure 4-6 Average time above SIR for K = 7, 12, and 19 cell reuse patterns. The close spcaing of
the SIR curves stems from the fact that the dominant component of the interference at the receiver is generated by adjacent channel users and is independent of the cell reuse pattern .... 92 Figure 4-7 Receiver SIR example for an UAN cosisting of 8 nodes ... 93 Figure 4-8 Diagram of hopping points (hoppoints) used in simulation. The hopping distance
(hopdistance) using the diagram was set to 75% of the cell radius (cell-radius). The blue cell is centered on the network reference coordinate with each red circle representing the relative shift, or "hop", in the layout of the cell pattern. ... 96 Figure 4-9 Diagram of hopping distance (hopdistance) for a 3 hopping point pattern. The blue cell
is centered on the network reference coordinate with each red circle representing the relative shift, or "hop", in the layout of the cell pattern. ... 97
Figure 4-10 Network connectivity versus node density for hopping points of 2, 3, 4, and 6. The hopping distance is set to 75% of the cell radius... 98
Figure 4-11 Network connectivity versus node density for hopping distances equal to 25%, 50%, 75%, and 100% of the cell radius and a hopping point pattern of 3...99 Figure 4-12 Uncertainty in the position of a node. The red ring represents the area of uncertainty
(AOU) generated by node I for each of its nearest neigbor nodes. The size of the AOU is based
on the maximum speed of the node, the age of the last fix, and the accuracy of the navigation eq u ip m en t...10 0
Figure 4-13 Position error versus average number of link changes for the 4 different node
distributions using 36 nodes. The results show that if the maximum error in a node's position does not exceed 21% of the cell radius then a stable network structure can be maintained by the distributed clustering architecture...102
List of Acronyms
ASW Anti-Submarine Warfare
AUV Autonomous Underwater Vehicle
AOU Area of Uncertainty
BPSK Binary Phase Shift Keying
CDMA Code Division Multiple Access
CML Concurrent Mapping and Localization
CTS Clear to Send
DADS Deployable Autonomous Distributed System
DSP Digital Signal Processing
DSSS Direct Sequence Spread Spectrum
EM Electromagnetic
FBE Fleet Battlegroup Experiment
FDMA Frequency Division Multiple Access
FEC Forward Error Correction
FHSS Frequency Hopping Spread Spectrum
FRONT Front Resolving Observational Network with Telemetry
FSK Frequency Shift Keying
GPS Global Positioning System
ISDN Integrated Services Digital Network
LAN Local Area Network
LBL Long Baseline
MAC Media Access Control
MAI Multiple Access Interference
MFSK Multiple Frequency Shift Keying
MSAP Minislotted Alternating Priorities
MSC Mobile Switching Center
PN Pseudonoise
PRD90 90% Probability of Detection
PSTN Public Switched Digital Network
RTS Request to Send
SIR Signal to Interference Ratio
SNR Signal to Noise Ratio
SLAM Simultaneous Localization and Mapping
SSP Sound Speed Profile
TDMA Time Division Multiple Access
UACC Underwater Acoustic Communications Channel
UAN Underwater Acoustic Network
UTM Universal Transverse Mercator
Chapter 1
Introduction
1.1 Motivation
The autonomous underwater vehicle (AUV) has evolved to become the preeminent research platform for exploring our undersea world. Archaeological exploration of ancient shipwrecks, detailed hydrographic mapping of deep-sea structures, and mine/counter-mine warfare within denied littoral waters are just a few of the missions that today's AUVs are engineered to perform. Although many AUVs are equipped to execute missions with little or no operator interaction, there still exists a need to efficiently communicate their findings in real-time for data processing and analysis by their human counterpart. At the same time, recent advances in spread spectrum underwater acoustic modem technology have greatly enhanced our ability to implement robust, moderate-capacity digital communication links between nodes operating within a harsh shallow water environment. The advantages of spread spectrum acoustic modems over their conventional fixed-frequency counterparts include excellent interference immunity, multi-user capability, and a lower probability of signal intercept [2, 3]. The combination of these two emerging technologies has led many military and civilian organizations to
Introduction
x I ,,
Figure 1-1 Military application of underwater acoustic communications technology. The information from land, air, space, and sea assets can be readily correlated by operators in the Tactical Infromation Network center to provide component commanders with an accurate detail of the undersea battlespace picture.
explore the development of rapidly deployable networks of undersea sensors that can provide sustained in-situ observations from within the harsh ocean environment. An example of how tactical intelligence from land, air, space, and sea assets can be exchanged during the conduct of coordinated anti-submarine warfare (ASW) operations can be seen in Figure 1-1. In the example, the operations of the enemy submarine (red) are closely monitored by the deployed network of undersea sensor nodes and barrier systems. These nodes communicate their finding back to a master node using acoustic modem links. The master node then relays this information onto air and surface assets via satellite using a RF buoy data link coupled to an acoustic modem. The combat commanders can then process the intelligence gathered and transmit the correlated information to ASW assets both above and below the surface for use in prosecuting the enemy submarine.
Motivation
1.1.1 Centralized Communication Networks
A key component of the above example that deserves further examination is
the method in which the various undersea sensor systems are networked together using acoustic modems. The underwater acoustic network (UAN) formed by these nodes is a crucial link in the sharing of valuable undersea intelligence. In the example, the UAN employs a centralized network topology whereby the centrally-located master node coordinates all communication transactions among the network nodes. In order for a sensor node to transmit it must first receive permission from the master node using either a request-to-send (RTS) clear-to-send (CTS) protocol or
by being directly polled for data by the master node. The master node is typically
located such that it can provide adequate acoustic communications coverage area to
Figure 1-2 Placement of relay nodes in a centralized network. The master node provides an information gateway between nodes in the UAN an operators on the surface or land. The anchored relay nodes coordinate communications between nodes that are beyond the communications coverage area afforded by the master node.
Introduction
all deployed nodes in the network. In situations where the coverage area required by the network exceeds the maximum effective acoustic communications range of the master node a series of fixed relay nodes must be deployed, similar to the setup found in Figure 1-2. Although simple in design, a centralized network topology has three major disadvantages:
1. The master node (and relay nodes) can only provide a limited
communications coverage area to the deployed network
2. The failure of the master node will result in a complete communications failure of the deployed network (network failure), or in the case of relay nodes, the failure of a relay node will result in a complete communications failure of those nodes it provides coverage (network degradation)
3. Nodes may only transmit their data when they have been authorized
(polled) by the master node
Consider the case where multiple AUVs are cooperatively searching for submerged objects along a vast stretch of coastline. Several of the AUVs are tasked to search together in "packs" to provided object localization, detection and classification support for one another. In addition, other specialized AUVs are tasked with providing navigational cueing using moving acoustic baselines and precision navigation equipment. These types of coordinated operations, by virtue, demand a certain degree of communications among the various contributing members to effectively accomplish the mission. In a centralized network topology, the potential exists that the "packs" of AUVs could eventually migrate beyond the communications coverage area of the master node. Several relay nodes would then need to be pre-deployed in conjunction with the AUVs to provide an adequate
Motivation
communications coverage area, increasing communications equipment complexity, cost, and deployment and retrieval times.
1.1.2 Distributed Communication Networks
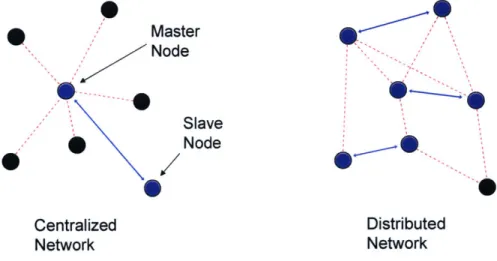
In contrast to centralized network topologies, decentralized or distributed ad-hoc networks are self-organizing, rapidly deployable multi-hop wireless networks that adaptively modify the structure of the network in response to node mobility, node additions, and node removals [4]. Unlike centralized network topologies, communications between nodes in a distributed ad-hoc network require no fixed infrastructure and do not rely upon specialized relay nodes for traffic routing. Instead, each node functions not only as a host, but also as a router that maintains communication routes to and forwards data packets from other nodes in the network that may not be within direct transmission range of one another. A comparison between a centralized network topology and a distributed network topology can be seen in Figure 1-3. In a centralized network topology, only the master node and the slave node can communicate at one time, or the master node may permit the slave
Master Node Slave Node Centralized Distributed Network Network
Figure 1-3 Comparison between a centralized and distributed network. The blue arros indicate the links that are actively engaged in communications and the red dotted lines indicate the available links that are not active at this time. In a centralized network only the master node and the slave node can communicate at one time, whereas in a distributed network several pairs of nodes many communicate at any given time.
Introduction
Master-Relay Master Node BackbomMaximum range of relay node Centralized &@ Network - - - - ' Relay Node Distributed Network
node to communicate with another slave node during that period of time. In the
Figure 1-4 Comparision between the relative coverage areas of a centralized and distributed network. Any node located outside the maximum communications range of either the master or relay nodes is unable to communicate in a centralized network. In a distributed network, several paths exist between nodes provided the range between nodes does not exceed the maximum communications range of the acoustic modem.
distributed network topology several pairs of nodes can be actively engaged in communications at any given time. In general, there are more available paths for communications between nodes in a distributed network than in a centralized
network.
Ad-hoc networks also provide a relatively larger communications coverage area since the network's span is determined by the number of member nodes and not
by the distance to the nearest master or relay node. Figure 1-4 illustrates a
comparison between the relative coverage areas of a centralized and distributed network topology. In a centralized network, those nodes located outside the communications coverage areas serviced by both the master and relay nodes are unable to communicate within the network. All nodes within a distributed network
Complexities of Underwater Acoustic Network Design
can communicate provided the maximum range between any pair of nodes does not exceed the maximum communications range of the acoustic modem. In addition, the use of shorter multi-hop links between adjacent nodes in the distributed network can reduce the amount of energy consumed in the transmission of packets. The combination of these advantages highlights the attractiveness of the distributed network topology for use in the development of an UAN.
1.2 Complexities of Underwater Acoustic Network Design
The underwater acoustic communications channel (UACC) poses several daunting challenges to UAN designers not often encountered in other communication channels. Unlike electromagnetic waves (EM) in air, the available bandwidth and range of acoustic signals within the UACC is highly dependent upon the transmission losses between the source and the receiver, and is generally limited to frequencies below 30 kHz [2]. Within this already limited bandwidth the acoustic signals are subject to reverberation that corrupts the acoustic signal at the receiver, subsequently leading to bit errors in the received transmission. The combination of a relatively low bandwidth and a higher probability for signal errors limits the practical data rate for digital communications in an UAN to around 2-20 kbps with an effective range of only a few kilometers.In general, the deployment of instrumentation and sensor systems in the ocean and on the seafloor for an extended period of time is primarily limited by the capacity of the on-board battery. It is important that the design and operation of sensor systems strive to be as energy efficient as possible to minimize the power drain on the battery. The UAN protocol must also do its part to be battery efficient
by minimizing the number of acoustic modem transmission required for network
Introduction
In addition to remaining parsimonious of communication, processing, and power resources the networking protocol must also determine network structure for coordinating the transfer of information between nodes. A priori knowledge of
network topology is essential for network management and communication resource allocation in a distributed network [5]. The process of topology discovery and routing in ad-hoc networks has been greatly enhanced with the advent of the Global Positioning System (GPS) and other progressive undersea navigation techniques, such as long baseline navigation (LBL) and simultaneous localization and mapping
(SLAM). The ability of undersea sensor systems to triangulate and fix their position
using these techniques is a significant advantage over wireless radio network designs that lack navigation cueing.
The relatively recent emphasis on synoptic, spatially sampled oceanographic surveillance has provided the impetus to the transfer of networked communication theory to the UACC [2]. Unfortunately, many of the high-efficiency networking protocols employed in modem wireless radio systems cannot be directly applied to the channel. The efficiency of these protocols stems from the fact that the signal propagation delay presented by EM waves in air is negligible (5 ps over 1.5 km) when compared to the transmission time of the data packet. Since the time it takes a packet to reach its destination is very small, the networking protocol can allot a dedicated portion of the communications channel for coordinating channel access without incurring a significant reduction in the efficiency of the network. In contrast, the signal propagation delay inherent to acoustic waves in water is significant when compared to the packet transmission time and cannot be ignored. The relatively slow speed of acoustic waves in water produces propagation delays that are five orders of magnitude slower than their EM counterparts in air. Over a distance of 1.5 km the propagation delay is as much as second! In addition, the relatively low data rates in the UACC produces a packet transmission time that can also be measured in seconds. The networking protocol cannot afford to dedicate a
Complexities of Underwater Acoustic Network Design
portion of the already limited communication resources to network management without a significant loss in network efficiency. The tradeoff between network management and network efficiency is the fundamental obstacle in the design of a networking protocol suitable for use in the UACC [6].
1.3 Spatially Dynamic Cellular Clustering
Spatially Dynamic Cellular Clustering is a novel distributed UAN protocol suitable for ad-hoc deployments of both stationary and mobile nodes dispersed across a relatively wide coverage area in a shallow water environment. The overall network architecture is similar in design to a modem mobile cellular network, except devoid of such fixed infrastructure as the centrally-located transmitter towers and interconnecting control stations.
Each communication node in the network employs the same spread spectrum acoustic modem capable of switching between multiple communications channels using orthogonal signaling techniques. Communication channel reuse throughout the network is accomplished through the geographic separation of cells. All cells within the network are geometrically identical and positioned relative to a common reference coordinate. Nodes communicating within a given cell exercise contention-free access to the localized communication channel by using a hybrid demand assignment MAC protocol based on Kleinrock's mini-slotted alternating priorities
Introduction
--- ---- --- 6
.. . . 6...
(a) (b) (c)
Figure 1-5 Example of a complete hopping cycle using the spatially dynamic cellular clustering scheme. A hopping pattern with 3 clustering points was used in this example. (a) The distributed clustering algorithm clusters nodes into co-located cells using the position information of one-hop neighbor nodes. Once clusters, the nodes within a cell can communicate using the resources allocated to that specific geographic cell. (b) The cellular pattern is repositioned to allow new node clusters to be formed by previously adjacent cells. (c) The process is repeated for each hopping point in the cellular hopping pattern. At the completion of the hopping cycle the process of cell shifting and re-clustering has generated multiple communication paths between all nodes within the network.
Nodes are dynamically clustered into cells based on their estimated global positions using a distributed clustering algorithm. In order to maintain an up-to-date account of node-to-node link states each node will periodically transmit its global coordinate position to neighboring nodes as either separate packets or imbedded within other types of packets. Each node executing the distributed clustering algorithm requires only a priori knowledge of one-hop neighbor nodes and not the position of every node within the entire network in order to cluster nodes and coordinate network connectivity. Inter-node connectivity among those nodes that are clustered within differing cells is accomplished by periodically relocating, or "hopping", the cell boundaries and then re-clustering nodes. An example of a complete hopping cycle using the spatially dynamic cellular clustering algorithm can be seen in Figure 1-5. Within a bounded period of time, the overall effect of cell boundary hops and node clustering will result in full communications connectivity among all network nodes.
Complexities of Underwater Acoustic Network Design
Network parameters, such as cell reuse pattern, cell radius, cell hopping pattern, and minimum and maximum link distance are characterized for general performance, optimized for the given UACC model, and then constrained through simulation to meet the following criterion:
1. Maximize signal-to-interference ratio (SIR) at a user
2. Maximize network connectivity
3. Maximize network stability
The contribution of this thesis is the development and validation of an distributed ad-hoc networking protocol suitable for use in an UAN based upon proven concepts extrapolated from classical cellular communications and network theory and conformed to the modeled UACC. The distributed networking protocol will address the problem of communication resource allocation, communication channel reuse, and the implementation of a MAC protocol suitable for use in a shallow water environment.
Although experimental data is preferred, validation of the network design is performed using simulations only due to the scale, complexity and cost required in physically implementing and testing the network design under in-water conditions. Where applicable, actual experimental data is provided to justify design selections and substantiate conclusions.
1.4 Related Work
Although the concepts of cellular design have been widely published, the distributed approach to mobile underwater acoustic networking presented in this thesis is unique. Nevertheless, this thesis does draw from a number of related papers that have been published recently. The work related to this thesis is classified into
Introduction
three major areas: adaptive clustering for ad-hoc networks, underwater acoustic networking, and spread spectrum signaling within the UACC.
1.4.1 Adaptive Clustering for Ad-hoc Networks
Adaptive clustering for ad-hoc networks deals with issues associated with bandwidth allocation, channel reuse, and packet routing. The proposed clustering scheme by Lin and Gerla [8] describes how various code division multiple access
(CDMA) techniques, coupled with distributed node clustering, can be used to control
access to communication resources within a mobile ad-hoc network. The clustering algorithm uses node ID numbers to deterministically cluster nodes that are reachable via two-hop paths into non-overlapping groups. The paper indirectly addresses the deleterious effects of interference from other user transmissions on network performance by comparing network connectivity versus the transmission range. The interference from other user transmissions is often referred to as multiple access interference (MAI) in the wireless networking community. Their results have shown that as the average transmission range between nodes increases, the connectivity among the nodes increases due to the reduced user interference. While this result is not surprising to cellular designs, it does show that there exists an exploitable link between adaptive distributed clustering and cellular networking.
The clustering scheme presented in [9] details a framework for dynamically organizing mobile nodes in a wireless ad-hoc network into clusters in which the probability of path availability can be bounded. The paper also demonstrates that under moderate levels of mobility the clustering algorithm converges to a stable network topology. More importantly, the mobility-based model used in the simulation of their network protocol provides valuable incite into the temporal and spatial variations in routing paths due to node mobility and density.
Complexities of Underwater Acoustic Network Design
1.4.2 Current Underwater Acoustic Network Designs
Several of the UANs currently in use employ a centralized network topology whereby a centrally-located node coordinates all communication transactions among deployed network nodes. The Deployable Autonomous Distributed System (DADS) is designed to provide undersea surveillance in littoral waters [10]. It consists of an underwater array of fixed sensor platforms interconnected by acoustic modems. Acoustic data is propagated through the network over multi-hop communications paths. The individual hops are configured as half duplex Code Division Multiple Access (CDMA) links between discrete modem pairs. Messages are relayed between paired platforms to minimize the transmit power requirements and reduce the impact of temporal, spatial, and frequency spreading of the signal as it propagates through the UACC. The network connects the remote sensor platforms to a command center through a gateway that relays data received from the acoustic network to the distant command facility across satellite links.
The Front-Resolving Observational Network with Telemetry (FRONT) is a non-military application of DADS that aims to accelerate technology development for numerous critical Navy applications such as littoral ASW and autonomous operations [11-13]. FRONT involves an operating environment, node spacing, and data rates similar to those of DADS and other undersea warfare applications. During the June 2001 Fleet Battle Experiment India (FBE-I), many of the DADS refinements implemented for FRONT were demonstrated in conjunction with two prototype DADS sensors networked with a shore-based ASW command center and a submerged US Navy fast-attack submarine. While qualitative results of the experiment were not readily available, the anecdotal evidence revealed the communications portion of the experiment was the ability to effectively link both undersea and land-based assets into an UAN.
Introduction
In general, a centralized network topology provides nodes with fair, contention-free access to the communication channel by allowing only one node to transmit at any given time. While DADS and FRONT are both effective communication network architectures for disseminating data within a centralized network of nodes, its quality of service is limited by high-latency telesonar links that use a request-to-send (RTS), clear-to-send (CTS) MAC protocol. Consequently, network performance in terms of data latency and throughput efficiency is diminished using the prescribed MAC protocol as nodes must wait in turn to transmit.
A series of papers by Sozer et al [3, 14] outline the development and
simulation of a centralized network protocol for an ad-hoc network of static nodes in a shallow water environment using OPNET Modeler/Radio. Their work detailed the considerations required in the discovery and initialization phases of an UAN protocol regarding topology discovery and node routing algorithms. These papers also address the key relationship between the operation of the network protocol and battery life, and provides qualitative simulation results comparing network activity with battery consumption.
A fixed assignment distributed network protocol described by Stojanovic et
al [15] addresses the exploitable relationship between network management and vehicle navigation. The protocol uses Time Division Multiple Access (TDMA) to allow multiple AUVs to locate one another by measuring inter-vehicle signal propagation delays and by exchanging self-generated localization maps. The propagation delay information gathered among the AUVs can then be used in concurrent mapping and localization (CML) operations as well as path discovery for routing data packets within the network. The paper also investigated a soft limit on
Complexities of Underwater Acoustic Network Design
the number of AUVs that can be effectively employed by this protocol per square kilometer and still be able to meet the desired communication timing criteria. The limit calculation accounted for the maximum speed of the AUVs, the desired localization map update rate, and the maximum expected distance between AUVs. While this particular protocol is well suited for a small group of AUVs tasked to conduct a moving group search, the use of TDMA as the multiple access method complicates the scalability of the UAN as there are no provisions for large-scale channel reuse. In addition, the temporal and spatial variations of the UACC can significantly affect the accuracy of inter-vehicle signal propagation delays. In this case, the use of on-board navigation functions is more ideally suited to triangulate the position of vehicles in the network.
1.4.3 Spread-Spectrum Acoustic Modems
Until recently, acoustic telemetry has relied primarily on incoherent modulation techniques such as frequency shift keying (FSK) to provide robust digital communications in an undersea environment. While FSK is effective in low data rate applications, the need for higher data rates has shifted acoustic mode design towards more spectrally efficient techniques found in coherent modulation. An excellent overview on the evolution of acoustic telemetry from incoherent to coherent modulation methods can be found in [2].
Smaller, more efficient digital signal processors (DSP) has facilitated the migration of spread-spectrum signaling from the airwaves into the UACC. There are many relevant papers addressing the design, implementation, and testing of
spread-' key timing criteria include: localization map update rate, TDMA slot length, and maximum channel guard time
Introduction
spectrum acoustic modems [1, 16-20]. In general, many of the same design principles used in a common cellular phones can be found in these modems, making their integration into UAN designs less rigorous.
1.5 Thesis Organization
The thesis is divided into five chapters, including this introduction. Chapter 2 provides the relevant background material used in the development of this thesis. It discusses the fundamental characteristics of the UACC as a communications medium, spread-spectrum communication techniques, and the cellular concept. Chapter 3 details the technical approach taken in this thesis in the design of an ad-hoc UAN using spatially dynamic cellular clustering. Chapter 4 discusses the network and UACC simulation models, collected data, and network performance analysis metrics. Finally, chapter 5 summarizes the simulation results, presents conclusions drawn from this work, and discusses future extensions.
Chapter 2
Background
This chapter provides the requisite background knowledge considered necessary in the development of the spatially dynamic cellular clustering scheme presented in this thesis. The physical limitations of the UACC as communications medium are discussed, and then related to its fundamental application in acoustic telemetry design. Spread-spectrum communication theory is presented in terms of parameters that directly affect multiple user communications in a harsh communications channel similar to the UACC. Finally, an overview of classical mobile cellular theory is presented with an emphasis on communication channel reuse.
2.1 Underwater Acoustic Communications
The physical characteristics of water as a communications medium complicate the design of an UAN. While mediums such air or space allow electromagnetic (EM) waves to propagate relatively unimpeded over vast distances throughout nearly the entire radio spectrum, seawater severely attenuates these waves through absorption processes to effective ranges of not more than a few meters [21]. Although radio signals below the very low frequency (VLF) band can
Background
be received at great distances underwater, the high-power antennae required are very large and the effective data rates are extraordinarily low making EM waves an impractical carrier for networked digital communications within the UACC. For these reasons, acoustic waves are predominantly used for digital communications in the UACC.
The UACC is typically characterized as a random time-varying medium that is bandwidth-limited and reverberant to acoustic waves [2]. The available bandwidth and range of sound within the UACC is highly dependent upon transmission losses from both attenuation and geometric spreading, and is generally limited to frequencies below 30 kHz. Within this limited bandwidth, the acoustic signals are subject to time-varying multipath propagation and Doppler spreading that corrupts the acoustic signal by inducing inter-symbol interference (ISI) and signal fading at the receiver. In addition, the relatively slow speed of sound in water produces propagation delays that are five orders of magnitude slower than that of their EM counterparts in air. Accordingly, the combination of these physical characteristics complicates digital communication network design in the UACC.
2.1.1 Attenuation Losses
The attenuation of acoustic energy is a combination of both absorption from the various molecular loss mechanisms associated with seawater and scattering interactions from marine biologics, entrained air bubbles, and vertical channel boundaries. The frequency-selective absorption of acoustic energy in seawater is the dominant component of transmission loss at the ranges and frequencies of typical acoustic modems and stems from three principle loss mechanisms: shear viscosity, structural relaxation of water, and ionic relaxation of salts [21]. The frequency-dependent nature of these loss mechanisms can be characterized using the semi-empirical expression for seawater absorption derived by Thorp [22]
Underwater Acoustic Communications 106 10 4 E 103 102 0 10 10 .0 10 0 0 cu S10,1 CO -0 10 Hz: 1 kHz 10 kHz 100 kHz Frequency (Hz) 1 MHz 10 Mhz
Figure 2-1 Seawater absorption versus frequency.
a=1.094 + 40f' +2.75x10⁴f2+0.003 (dB/km) (2.1)
+ f 2 4100+f2
where a represents the coefficient of absorption loss andf is the center frequency of the acoustic signal in kilohertz. A plot of seawater absorption versus frequency can be seen in Figure 2-1. The transmission loss (H) from absorption between a source and a receiver separated by a distance r can then be calculated by
H = ar (2.2)
As attenuation through absorption is the more limiting factor in transmission loss, a practical range limit in acoustic telemetry designs can be found using the empirical criterion [21]
ar =OdB (2.3)
The interaction of acoustic waves with their channel boundaries can introduce significant scattering losses. The scattering losses incurred due to interactions with the ocean surface are exceedingly variable due to their dependence
- - - --- --- ---- --- --- --- --- ---- --- -- -- --- -- -- --- --- --- --- --- - -- --- ---- - ---- --- --- -- - --- r ----- -- --- ----- --- ---Typical acoustic modem frequencies --- --- --- --- -- 7
-Background
on the magnitude and period of wave perturbations. In calm seas, acoustic waves are perfectly reflected by the free-release surface formed at the high-impedance air-sea boundary. However in rough air-seas, the scattering losses increase dramatically due to the variability in the specular angle at the surface, particular at the small-scale levels associated with higher frequencies. Bottom loss is a measure of the energy lost into bottom as the acoustic wave is reflected. While bottom loss in deep-water applications is not crucial, it can have a considerable effect on transmission losses in shallow water applications [23]. The transmission loss due to bottom interactions (bottom loss) is a function of the plane wave reflection coefficient (RB) for the given bottom type and is defined as
H = 20 log R.1 (2.4)
In this thesis, the effects of surface scattering and bottom loss will be neglected by assuming these losses are deterministic when compared to the dominant effect of spatial variability from absorption and spreading losses associated with mobile nodes within a uniform UACC. In addition, the range limit of the acoustic modems employed within the network design is based upon the 90% probability of detection limit for the given UACC conditions, which effective masks the losses from scattering.
2.1.2 Geometric Spreading Losses
The degree of transmission loss due to geometric spreading depends upon the ratio of the range between the source and receiver (r) and the ocean depth (D). In close range, deep water applications (r/D < 1) the geometric spreading losses are due
primarily from spherical spreading with the source and the receiver connected by a direct-path eigenray. The transmission loss from spherical spreading can be calculated by
Underwater Acoustic Communications
In shallow-water littoral applications (r/D > 1) spherical spreading gives way to
cylindrical spreading as acoustic wave propagation is constrained to within the vertical boundaries of the channel. The transmission loss between the source and the receiver is now defined as
H =10 log r +10 log(D cos,) (2.6)
where 0, is the minimum incident angle between the empirically dominant eigenray and the vertical boundary. The first term represents the losses over the entire range due to cylindrical spreading while the second term represents the additional loss incurred due to spherical spreading prior to the wave front interacting with the vertical boundary.
As an acoustic signal propagates from the source to its intended receiver, its energy is degraded by the combination of both frequency and range dependent transmission losses in seawater. In order for the receiver to properly detect and decode the transmission the signal strength of the received signal must be sufficiently stronger than the noise presented by other interfering sources in the
UACC. The ratio between the signal power received and the noise power from other
sources is known as the signal to noise ratio (SNR). Lower SNR levels result in a higher probability that the receiver will be unable to successfully decode the transmission without errors. If either the range between the source and receiver or the frequency of the acoustic signal increases, then the amount of transmission loss increases and the available SNR at the receiver will decrease. The Shannon-Hartley theorem states that the capacity (C) of a communications channel, in bits per second, is a function of the average received SNR and the bandwidth (W), and can be stated as
Background
It is theoretically possible to transmit information over the UACC at any bit rate (R), where R ; C, and incur a small bit error probability by using a sufficiently complicated coding scheme and a higher transmission power [24]. For these reasons the practical bandwidth of the UACC is generally limited to frequencies below 30 kHz.
2.1.3 Sound Speed
Spatial and temporal variations in the temperature, pressure, and salinity of seawater result in widely dynamic sound speed profiles (SSP) that are uniquely characterized in trait, time, and location. In deep water, variations in SSP are dominated by temperature in the upper 1000 meters and hydrostatic pressure in the deep ocean. In the upper tens of meters, the SSP is heavily influenced by solar heating and wind, and can vary on a daily basis [23]. Directly below this layer is the thermocline, followed by an isothermal region that extends to the ocean floor. Acoustic waves generated within the region below the thermal layer can become trapped, propagating vast distances without ever reflecting from a vertical boundary. Comparatively, acoustic waves generated in the region above the thermal layer alternately reflect from the surface towards the bottom only to be bent upward.
In shallow water less than 100m a seasonal thermal layer is generated in the upper 5 meters followed by a nearly isovelocity profile that extends to the seafloor. Depending on the geographic location and sufficient mixing from winds and currents the SSP may be completely isothermal. The UAN protocol developed in this thesis has been tailored to operate within the shallow water acoustic channel (< l00m) where the communication nodes are located within a nearly isovelocity SSP.
Underwater Acoustic Communications
2.1.4 Reverberation
---
r
-----Surface
D
Source ReceiverFigure 2-2 Homogeneous fluid layer bounded by arbitrary horizontally stratifleid media with plane wave reflection coefficients Rs and RB. The proximity of a vertical boundary to the source and the receiver in a shallow water channel gives rise to multiple propagation paths. Reverberation is a result of acoustic signals being spread in both time and frequency by the existence of multiple propagation paths and relative motion between the source and the receiver. The presence of a free-release surface, a hard bottom, and a depth-dependent sound speed profile (SSP) gives rise to multipath propagation, especially in shallow water channels (r/D > 1). Figure 2-2 provides an illustration of the multiple propagation paths present between a source and a receiver in a shallow water channel. Differences in reflected path lengths cause signal transmissions to arrive at the receiver with a finite temporal scattering called the delay spread (Td) of the channel. The channel delay spread is typically specified as the interval during which S(t) remains essentially nonzero [24, 25]. Intuitively, delay spread measures the approximate duration of channel "echoes" resulting from multipath arrivals. Figure 2-3 shows the magnitude impulse response of a simulated UACC, along with its corresponding magnitude frequency response. The delay spread of an UACC is
S(T) S(f)
T e i
Background
typically on the order of 100 ms or more. A time dispersive UACC generates two potentially deleterious effects at the receiver: frequency-selective amplitude and phase variations (fading) and inter-symbol interference (ISI). Frequency-selective fading is caused by delayed signal components adding out of phase at the receiver. This condition is evident in Figure 2-3 where deep spectral notches are observed. Since the spectral location of these notches is highly dependent on signal phase, the overall channel response is particularly sensitive to changes in receiver location and orientation. Meanwhile, ISI occurs whenever delayed arrivals from one symbol interval "spill over" into subsequent symbol intervals. ISI impedes the ability of the receiver to distinguish the desired signal from the echoes of the previously transmitted symbols.
The inverse of the channel delay spread is called the coherence bandwidth
(Bc0h) of the channel. When the coherence bandwidth is large relative to the signal
bandwidth the multipath arrivals are primarily confined to a single symbol interval [25]. In the frequency domain, this corresponds to a channel impulse response that remains approximately constant across the signal bandwidth of interest. This situation is referred to as frequency non-selective, or flat multipath fading. In this case, ISI is negligible and channel equalization can be accomplished using a single complex-valued gain multiplication. In narrowband applications, the primary concern of the receiver is not ISI but the impact of frequency-dependent channel amplitude variations. Since the entire narrowband signal can randomly drop into a deep channel notch, high performance receivers for narrowband signals require fast automatic gain control (AGC) circuitry, large dynamic range, and diversity reception. In wideband applications where the signal bandwidth is larger than the coherence bandwidth of the channel (e.g. spread spectrum) the receiver's primary concern becomes ISI and not the narrowband notches. In this case, the channel is characterized as being a frequency-selective fading channel since the channel magnitude response varies across the signal bandwidth. Signal distortion from
Underwater Acoustic Communications
frequency-dependent fading normally results in severe ISI at the receiver requiring complex wideband equalizers for acceptable receiver performance [26]. When the level of ISI is particularly severe the only solution may be to decrease the maximum symbol rate of a transmission. A general conclusion is that multipath effects increase the required complexity and power consumption of acoustic modems.
The interval over which the impulse response of the UACC remains correlated is called the channel coherence time (Tcoh). The channel coherence time provides a measure of the variation rate in the UACC impulse response. Channels are characterized as being either fast fading or slow fading depending on the length of the coherence time relative to a single symbol interval. The channel coherence times are strongly dependent on the relative motion between the transmitter, receiver, and other objects or surfaces in the channel. In narrowband applications, the fading rate directly affects the responsiveness and dynamic range of the receiver. In wideband applications, the fading rate primarily impacts the required convergence rate for adaptive receiver algorithms [26].
The product of BCOHTCOH, called the Doppler spreading factor, is used to determine whether the channel is either underspread (BCOHTCOH < 1) or overspread
(BCOHTCOH > 1)- In general, the impulse response of a significantly underspread
channel (BCOHTCOH << 1) can be readily obtained and exploited to optimize the
time-varying performance of the receiver [16]. However, the ability to characterize the rapid fluctuations in the impulse response of an overspread channel is an intractable problem for phase-coherent modulation.
Background
2.2
Spread Spectrum Communications
The following discussion seeks to offers insight into the advantages and application of spread spectrum communications in the UACC. A more in-depth presentation of spread spectrum theory can be found in [24, 27], with [16] providing a more detailed approach to the UACC. Spread spectrum communication techniques are highly attractive for use in an UAN due to their ability to accommodate multiple users at the same time, use of low probability of interception signals, and their relative immunity from the deleterious effects of multipath and Doppler spreading.
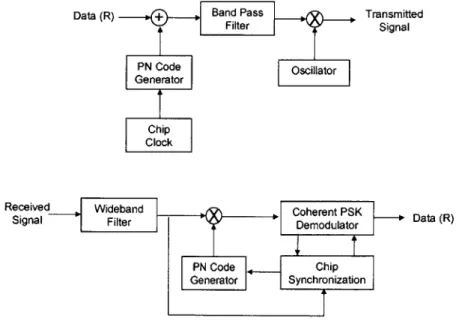
The modulation techniques used in spread spectrum communications can be classified into two categories: direct-sequence spread spectrum and frequency-hopping spread spectrum. In a direct-sequence spread spectrum (DSSS) system, the spectral bandwidth of a data sequence of rate R is spread by convolving it with a pseudo-noise (PN) code sequence whose symbol rate is much higher than that of the
Data (R) + Band Pass Transmitted
Filter Signal
PN Code Oscillator
Generator
Chip Clock
Re ceived Wideband Coherent PSK
Data (R)
Signal Filter Demodulator
PN Code Chip Generator Synchronizatio
Figure 2-4 Functional block diagram of a direct sequence spread spectrum (DSSS) transmitter (top) and receiver (bottom).
Spread Spectrum Communications
Code 1
Code 2
Code 3
Figure 2-5 Example of 3 orthogonal PN codes generated using Walsh-Hadamard sequences with a spreading factor of 8
data sequence. The resultant wideband pseudorandom signal of bandwidth (Wss) is then modulated using binary phase shift keying (BPSK) to produce a signal that has noise-like properties when compared to the data sequence. A function block diagram of a DSSS system can be seen in Figure 2-4. Although the resultant signal appears as random noise, each intended receiver can despread the data signal in a deterministic manner through cross correlation when provided with the proper PN code. The length of the PN code sequence is called the spreading factor with individual code elements referred to as chips. Three code sequences selected from the Walsh-Hadamard set are illustrated in Figure 2-5 for a spreading factor of 8. In most spread spectrum systems the code sequence elements are restricted to take on the value + 1 to simplify hardware implementation. Following modulation the information bandwidth of the signal is characterized by a factor approximately equal to the spreading factor. This explains the use of the term spread spectrum to describe these systems.
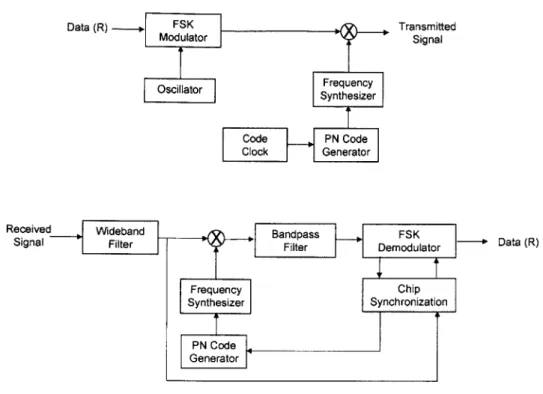
A frequency hopping spread spectrum (FHSS) system spreads the data signal