Table S2. Scale of concentration of various environmental properties measured in soils. Water and organic matter content were reported in percentage (%) and the metal results in ppm (μgmetal.gdryweight-1). Avg: average, Min: minimum, Max: maximum, MD: mean deviation, Med: median, VDC: vegetation density classes.
Environmenta l properties
VDC-1 VDC-2 VDC-3
Min-Max Avg ± MD Med. Min-Max Avg ± MD Med. Min-Max Avg ± MD Med.
pH 2.94-5.65 3.88± 0.58 3.91 3.66-7.34 4.95 ± 0.81 4.68 3.96-8.90 7.07±1.66 8.11 Water content 6.27-
28.08 15.93 ± 5.56 15.42 2.09- 56.65
19.21 ±
10.87 12.91 7.69-
32.51 18.07±3.99 17.22 Organic
matter content 1.00-3.30 1.96 ± 0.80 1.50 1.30-2.30 1.87 ± 0.24 1.80 0.80-3.10 1.92 ± 0.59 1.70 Total nitrogen <0.01 <0.01 <0.01 <0.01 <0.01 <0.01 <0.01-0.3 0.25 ± 0.05 0.25
23Na 0.30-
145.33 25.70 ±
25.53 10.87 0.33-
119.20 27.54 ±
15.87 23.09 0.08-
139.25 41.24 ±
33.30 31.01
24Mg 66.24- 4304.56
1230.22 ±
593.89 1064.63 447.35- 3965.78
1333.02 ±
561.17 1037.93 389.79- 5195.45
1959.52 ±
1291.33 1448.77
27Al 116.93- 6123.02
2061.57 ±
896.49 1824.79 965.14- 7011.41
2225.36 ±
651.09 1984.27 961.87- 4919.81
2000.86 ± 580.81
11879.3 7
31P 1.89-
156.54
18.74 ±
13.39 11.27 8.25-
77.70
25.77 ±
13.87 18.75 7.75-
102.96
62.15 ±
27.32 77.31
39K 2.76-
1260.31
248.89 ±
217.29 117.95 49.92- 1377.57
292.31 ±
178.15 192.04 4.45- 1319.92
453.01 ±
312.74 397.49
44Ca 6.54-
4902.04 301.26 ±
584.73 36.30 24.00-
14681.10 933.20 ±
1146.57 168.23 9.90-
55818.18 20979.08 ±
21123.48 2340.18
47Ti 1.09-
35.91 10.66± 6.22 8.86 2.14-
73.84 18.86 ±
14.23 13.71 1.41-
87.75 15.55
±11.58 11.05
51V 0.45-
21.61 4.00 ± 2.30 3.08 2.52-
17.68 4.51 ± 1.58 3.69 1.23-
21.80 8.65 ± 4.15 8.84
52Cr 0.33-
14.66 4.29 ± 2.72 2.81 1.98-
19.00 5.18 ± 2.20 4.24 1.18-
20.86 5.70 ± 2.74 5.08
55Mn 2.53-
162.42
57.65 ±
32.63 51.80 12.27-
742.91
139.08 ±
121.46 68.31 10.82- 1061.65
479.49 ±
426.51 338.17
57Fe 2249.64-
70039.68 31018.19 ±
11106.73 27298.8
5 19669.09-
65200.00 34910.89 ±
8183.13 32249.1
0 17029.05-
66792.45 29646.14 ±
10257.42 23788.8 4
59Co 0.11-
13.89 2.92 ± 1.67 2.56 0.78-
16.93 4.61 ± 3.21 2.90 0.46-
10.40 4.36 ± 2.79 5.48
60Ni 0.20-
24.42 6.57 ± 4.04 5.05 1.52-
15.92 6.71 ± 2.80 5.58 1.02-
13.55 6.61 ± 3.39 6.61
65Cu 12.26- 456.63
220.71 ±
83.71 201.73 113.84- 529.86
266.28 ±
74.30 251.40 24.39-6 11.62
164.12 ±
117.94 139.51
66Zn 1.37-
115.78
41.33 ±
17.15 34.95 19.47-
93.40
48.51-
17.11 42.42 12.74-
60.17
40.44 ±
10.89 42.55
75As 40.16- 1610.95
386.42 ±
238.56 265.25 219.10- 1950.95
487.95 ±
172.03 428.86 177.29- 1687.26
666.56 ±
241.87 568.16
82Se 0.68-7.41 4.50 ± 1.18 4.74 2.65-
12.30 5.10 ± 1.34 4.56 0.73-4.63 2.35 ± 1.14 2.07
95Mo 1.26-
24.49 10.76 ± 4.20 10.75 4.80-
32.93 12.82 ±
4.55 11.19 2.45-
17.29 9.28 ± 2.83 8.73
107Ag 0.32-6.32 3.10 ± 1.01 2.92 1.50-7.84 3.32 ± 1.16 2.81 1.23-3.42 2.06 ± 0.46 1.93
111Cd <0.01-
0.25 0.07 ± 0.04 0.070 0.01-0.36 0.13 ± 0.08 0.09 <0.01-
0.47 0.15 ± 0.11 0.12
121Sb 0.01-1.69 0.55 ± 0.33 0.40 0.11-1.58 0.56 ± 0.25 0.50 0.09-1.73 1.03 ± 0.39 1.19
137Ba 0.82-
46.41 13.88 ± 9.39 9.91 1.96-
43.91 13.50 ±
6.44 11.65 2.78-
52.80 23.48 ±
14.97 23.42
182W 0.02-0.51 0.17 ± 0.08 0.14 0.06-0.58 0.16 ± 0.05 0.14 0.03-0.53 0.25 ± 0.11 0.28
205Tl 0.09-1.52 0.71 ± 0.34 0.64 0.26-1.51 0.61 ± 0.23 0.55 0.11-0.54 0.28 ± 0.08 0.25
206Pb 2.63- 54.06
20.78 ±
10.29 15.67 7.20-
37.60
19.39 ±
6.35 18.46 5.31-
40.62 17.52 ± 5.46 16.36
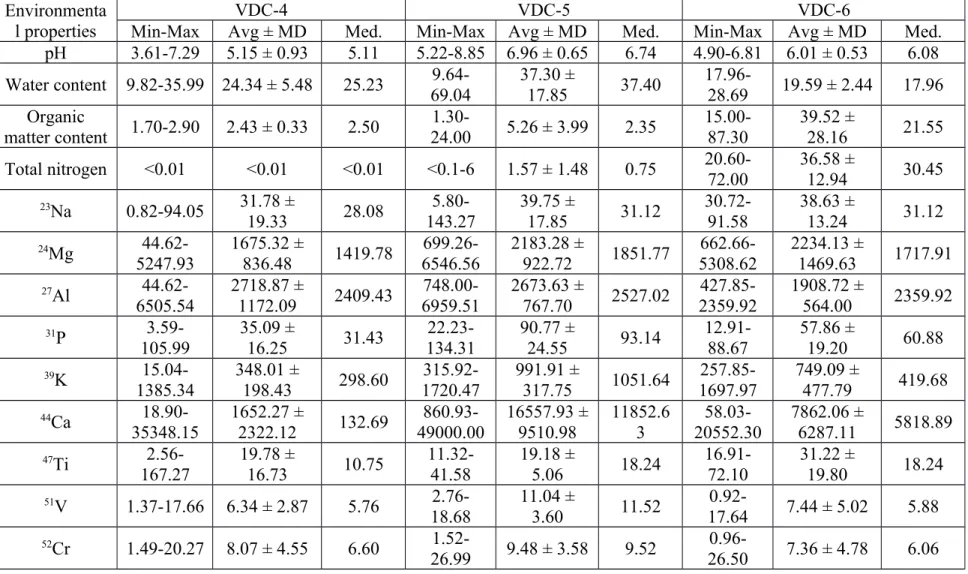
Table S3. Continued.
Environmenta l properties
VDC-4 VDC-5 VDC-6
Min-Max Avg ± MD Med. Min-Max Avg ± MD Med. Min-Max Avg ± MD Med.
pH 3.61-7.29 5.15 ± 0.93 5.11 5.22-8.85 6.96 ± 0.65 6.74 4.90-6.81 6.01 ± 0.53 6.08 Water content 9.82-35.99 24.34 ± 5.48 25.23 9.64-
69.04
37.30 ±
17.85 37.40 17.96-
28.69 19.59 ± 2.44 17.96 Organic
matter content 1.70-2.90 2.43 ± 0.33 2.50 1.30-
24.00 5.26 ± 3.99 2.35 15.00- 87.30
39.52 ±
28.16 21.55
Total nitrogen <0.01 <0.01 <0.01 <0.1-6 1.57 ± 1.48 0.75 20.60- 72.00
36.58 ±
12.94 30.45
23Na 0.82-94.05 31.78 ±
19.33 28.08 5.80-
143.27 39.75 ±
17.85 31.12 30.72-
91.58 38.63 ±
13.24 31.12
24Mg 44.62-
5247.93 1675.32 ±
836.48 1419.78 699.26-
6546.56 2183.28 ±
922.72 1851.77 662.66-
5308.62 2234.13 ±
1469.63 1717.91
27Al 44.62- 6505.54
2718.87 ±
1172.09 2409.43 748.00- 6959.51
2673.63 ±
767.70 2527.02 427.85- 2359.92
1908.72 ±
564.00 2359.92
31P 3.59-
105.99
35.09 ±
16.25 31.43 22.23-
134.31
90.77 ±
24.55 93.14 12.91-
88.67
57.86 ±
19.20 60.88
39K 15.04-
1385.34
348.01 ±
198.43 298.60 315.92- 1720.47
991.91 ±
317.75 1051.64 257.85- 1697.97
749.09 ±
477.79 419.68
44Ca 18.90- 35348.15
1652.27 ±
2322.12 132.69 860.93- 49000.00
16557.93 ± 9510.98
11852.6 3
58.03- 20552.30
7862.06 ±
6287.11 5818.89
47Ti 2.56-
167.27
19.78 ±
16.73 10.75 11.32-
41.58
19.18 ±
5.06 18.24 16.91-
72.10
31.22 ±
19.80 18.24
51V 1.37-17.66 6.34 ± 2.87 5.76 2.76-
18.68 11.04 ±
3.60 11.52 0.92-
17.64 7.44 ± 5.02 5.88
52Cr 1.49-20.27 8.07 ± 4.55 6.60 1.52-
26.99 9.48 ± 3.58 9.52 0.96-
26.50 7.36 ± 4.78 6.06
55Mn 4.19-
1013.64 169.80 ±
163.19 78.81 146.99-
1120.49 626.31 ±
240.98 593.20 35.51-
1421.68 326.78 ±
273.72 233.87
57Fe 445.75-
84649.12 43251.75 ±
15256.36 44452.4
2 2215.20-
24008.10 13628.88 ±
4747.87 12810.4
1 584.12-
36678.26 19984.08 ±
12484.15 21215.4 3
59Co 1.00-14.94 5.11 ± 2.84 4.57 1.55-
17.16 7.31 ± 2.53 7.33 0.70-4.94 3.40 ± 1.63 4.57
60Ni 2.08-32.25 13.16 ± 8.10 9.23 2.94- 26.40
13.36 ±
5.89 12.95 2.17-
31.44 14.64 ± 9.02 13.15
65Cu 40.31- 407.06
229.95 ±
72.31 235.64 12.51- 56.77
33.06 ±
9.83 31.32 20.46-
311.24
69.64 ±
60.40 33.00
66Zn 4.20-
125.46
58.70 ±
22.92 57.07 15.77-
126.93
60.90 ±
22.06 53.07 37.47-
130.07
96.08 ±
21.88 98.53
75As 43.32- 873.94
379.91 ±
114.13 350.32 4.11- 1376.10
473.80 ±
304.81 443.40 3.10- 276.87
62.51 ±
53.59 37.51
82Se 0.69-9.59 4.94 ± 1.77 4.62 <0.01-
2.78 1.43 ± 0.50 1.50 0.55-3.66 1.83 ± 0.95 1.43
95Mo 1.93-29.12 11.78 ± 4.18 10.77 0.36-
26.10 13.20 ±
6.11 12.57 0.83-
24.82 6.05 ± 4.89 4.15
107Ag 0.22-7.73 2.95 ± 1.08 2.86 0.03-3.96 1.61 ± 0.92 1.45 0.08-4.62 0.74 ± 0.97 0.21
111Cd 0.02-0.31 0.11 ± 0.06 0.09 0.09-2.48 0.28 ± 0.22 0.12 0.07-0.12 0.11 ± 0.01 0.12
121Sb 0.04-4.27 0.60 ± 0.33 0.47 0.01-2.40 1.50 ± 0.49 1.65 0.05-0.87 0.26 ± 0.17 0.23
137Ba 4.03-70.05 23.01 ±
14.64 16.36 9.61-
75.10
37.72 ±
14.42 34.15 5.57-
54.07 19.64 ± 8.61 16.36
182W 0.02-0.43 0.17 ± 0.08 0.14 0.03-0.53 0.22 ± 0.10 0.24 0.05-0.20 0.10 ± 0.03 0.09
205Tl 0.08-1.95 0.68 ± 0.33 0.60 0.03-0.70 0.31 ± 012 0.28 0.02-0.29 0.18 ± 0.09 0.20
206Pb 3.23-37.87 17.56 ± 6.07 16.70 8.18- 84.79
30.23 ±
13.96 20.38 13.31-
47.50 26.92 ± 8.54 26.36