Airport Access via Rail Transit: What Works and What Doesn't
By Joshua Schank BA Urban Studies Columbia University New York, New York (1997)
Submitted to the Department of Urban Studies and Planning in partial fulfillment of the requirements for the degree of
Master in City Planning at the
MASSACHUSETTS INSTITUTE OF TECHNOLOGY June 1999
@
Joshua Schank 1999, All Rights Reserveddeffbte uhlyPaper Ord
ebtctl
cop3. 0'C? th thesi AuthorDepartment of Urban Studies and Planning May 18, 1999 Certified by
Professor Nigel H. M. Wilson Department of Civil and Environmental Engineering Thesis Supervisor Accepted by
Associate Professor Paul Smoke Chair, MCP Committee Department of Urban Studies and Planning
MASSACHUSETTS INSTITUTE OF TECHNOLOGY
JUL 1 9
1999
RUTCM
Airport Access via Rail Transit: What Works and What Doesn't By Joshua Schank
Submitted to the department of Urban Studies and Planning on May 20, 1999 in partial fulfillment of the requirements for the degree of Master in City Planning Abstract:
Despite their potential for providing efficient and reliable airport access, rail connections to U.S. airports have consistently had trouble attracting a significant percentage of airport passengers. This thesis attempts find out which characteristics of airport rail links most strongly influence mode share so that future rail link plans can be assessed. These findings are then applied to the current plans for an airport rail link in San Juan, Puerto Rico.
The thesis begins by examining current airport rail links in the U.S. Detailed case studies are performed for the following airports: John F. Kennedy, Philadelphia, Boston Logan, Washington National, Chicago O'Hare, Chicago Midway, and San Jose. Smaller case studies are performed for Atlanta, Cleveland, St Louis, Baltimore-Washington, Miami, and Oakland.
The data collected for these airports is compared by looking for relationships between characteristics of the rail links and their mode shares. Two variables, rail travel time and the difference between rail and auto travel time, are apparently related to rail link mode share. Several propositions are advanced about the characteristics of airport rail links that affect mode share, and the way in which they affect mode share. The strongest of these propositions are that the lower the travel time difference between rail and auto the greater the rail mode share, that on-airport rail stations are likely to increase mode share, and that effectively serving population and employment centers is likely to increase airport rail link mode share.
Some further analysis is then performed on two of the propositions advanced. First, the relevance of the airport rail station location is tested by looking at the effect on mode share at Washington National when the rail station was, in effect, moved closer to the airport terminal. This analysis indicates that it is likely that the location of an airport rail station is related to mode share. Second, an analysis of population and employment around airport rail link stations is performed for Boston, New York City, and Chicago. This analysis indicates that the rail links examined serve a very small percentage of the population and jobs in their respective metro areas. This makes sense since rail links in these cities all have relatively low mode shares.
Finally, a case study of San Juan is presented. This case study is different than the previous ones since the San Juan link is in the planning stages. After the San Juan plan is presented, each proposition developed earlier is applied to the San Juan case to determine the potential effect of that proposition on mode share for the San Juan link. This analysis and a model for calculating mode share based on rail/auto time difference help to predict mode share for San Juan. The mode share for San Juan is likely to be between 2% and 5%. The thesis concludes with potential changes to the plan that might help increase that figure. Thesis Advisor: Nigel H. M. Wilson, Professor of Civil and Environmental Engineering Thesis Reader: Mark Schuster, Professor or Urban Studies and Planning
Acknowledgements:
Thank you Nigel Wilson for teaching me how to write a thesis, and for allowing me the opportunity to work on the Tren Urbano project.
Thank you Mark Schuster for your insights that helped to improve this work.
Thank you Renee Bowen for your work on the San Jose case study and the San Juan TransCAD analysis.
Thank you Kelly Davenport for the emotional support.
Thank you Mama for introducing me to the bus in Barbados, and thank you Papa for introducing me to the subway in Paris.
Finally, thanks to Richard DeNeufville, Richard Marchi, Aaron Gellman, Fred Salvucci, Greg Newmark, William Craven, Cathal Ridge, Suzannah Kerr, and Ken Kruckemeyer for their help with my research.
Table of Contents:
Chapter 1 - Introduction/Literature Review 5
Chapter 2 - Case Studies 20
2.1 Case Study Introduction 21
2.2 Detailed Case Studies 24
2.3 More Airport Rail Links 54
2.4 Airport Worker Mode Shares 60
2.5 Planned Airport Rail Links 61
Chapter 3 - Case Study Analysis 64
3.1 Case Study Comparison 64
3.2 Propositions 72
Chapter 4 - Further Analysis 80
4.1 Washington National Case Study Extension 81
4.2 Population and Employment Data 92
Chapter 5 - The San Juan Case 105
5.1 Current Plans for San Juan 106
5.2 Luis Munoz Marin International Airport 110
Chapter 6 - San Juan Analysis 118
6.1 Analysis of the San Juan Plans 118
6.2 Mode Share Predictions for a San Juan Link 125
6.3 San Juan Conclusions 127
Chapter 7 - Thesis Conclusions 130
7.1 Airport Rail Access - Summary and Conclusions 130
7.2 Airport Rail Access - Recommendations for Future Work 133
Chapter 1 - Introduction and Literature Review
Getting people to and from the airport would seem to be an ideal role for mass transit. Airports are such a significant destination in most cities that rail connections to them would seem to be good ideas. Yet airport rail links do not carry a significant percentage of airport passengers in this country, and traffic congestion en route to most U.S. airports continues to worsen. If rail is to play a role in improving airport access in the U.S., the experience with existing airport rail links needs to be understood, and lessons learned for future projects. This research will investigate the characteristics and performance of existing U.S. airport rail links to see what may be learned from them. The lessons learned from this investigation will then be applied to the city of San Juan, which is currently in the early stages of developing a rail system that may eventually include an airport link. Not only will this research address the likely effectiveness of a San Juan airport rail link, but it will also provide a framework for determining the future role of rail in U.S. airport access.
1.1 The Problem
Aviation is the swiftest mode of public transportation available on Earth. Unfortunately, airplanes cannot land at your home or office. The need for adequate landing space pushes airports well away from where people typically want to start and end their trips. For many inter-city trips, due to the high velocity of aircraft and relatively low velocity of ground vehicles, the airport access time can account for as much, if not more time than the actual flight time. Moreover, airport design makes pedestrian access to airports impracticable virtually everywhere. Therefore, almost every single airport
passenger or worker must be transported by vehicle to and from the airport, and often during peak hours. This means that airport access and egress times grow ever larger with respect to the time devoted to actual flying. Traffic congestion, or the fear of its occurrence, can add large amounts of time to any air trip by causing passengers to leave extra slack time.
The value of this extra time is ver high. Air travel can be a stressful experience even without traffic. Passengers are especially anxious because the consequences of missing a flight can often be so large. Lateness due to traffic may not be welcome for any trip, but if one is late for a meeting or a baseball game, this may not be a serious problem. Easy remedies do not exist for the late air traveler, however. Passengers are also stressed out because they know that the majority of the time they will have to wait on lines, fight crowds, and generally feel uncomfortable before they get to what for some is the most stressful part of all- flying. Moreover, human beings are generally uncomfortable with any kind of long-distance travel, since it tends to displace them from their familiar, comfortable environment. People face high stress on any airport access or egress trip, and the value of their time on these trips is likely to be higher than on a typical ground transportation trip.
Besides being important to each individual, airport access and egress time is vital to the economic well being of a city and its metropolitan area. Imagine a fictitious city with the nearest airport 100 miles from the edge of the metropolitan area. This city would not survive in the modem world for very long, since it would be considered isolated. Although no major American city faces this kind of absurd physical setup, many of them face comparable access times due to traffic congestion. For example,
traffic in the Callahan tunnel can occasionally force Bostonians to sit in traffic for an hour in order to travel the 3 miles from Logan to downtown. Since automobiles can usually average at least 50 miles per hour on the highway, Logan could be considered the equivalent of 50 miles away when the traffic is this bad. Taken to the extreme, we can see that worsening traffic could have the same isolating effect on a city as a distant airport.
This means that good airport access is important to the economic life of a city. But what exactly makes airport access "good"? Clearly there should be a limited distance, if possible, between the airport and points to which passengers are going on the ground, but this is very difficult to change. Speed could be important, but ground transportation modes do not vary greatly in their potential velocity. Most major airports already have expressways, the fastest available ground transportation (with the exception of high-speed rail, which is virtually non-existent in the U.S.) leading to them. Therefore, speed, unless high-speed rail is implemented, cannot be significantly changed either. Considering the importance of time to the air traveler, consistency in airport access is vital for people and cities alike. Even potential traffic congestion can lead to extra travel time. But if every traveler knew, for example, that it would never take more than 30 minutes to get to the airport, this would make travelers much more comfortable
and potentially increase the economic viability of the city that the airport serves.
Therefore, airport rail access, or an exclusive right-of-way for a rubber-tired vehicle, could theoretically stabilize the airport access time for cities, ensuring a less stressful trip, and helping to preserve and increase economic vitality. Exclusive rights-of-way could ensure airport travelers a consistent, reliable connection to the airport via mass
transit. With adequate rail or busway access in place, travelers could always count on a fast, consistent trip to the airport.
Unfortunately, this is not reality in this country. An overwhelming majority of Americans, both workers and passengers, use automobiles to access the airport. Rail links have been built at many major airports in this country, yet they have failed to garner significant mode share when compared to airport rail links in other countries, and airport access traffic continues to worsen. The consequences for travelers are continued stress. The long-term consequences for cities are potentially deeper and more detrimental. With landside congestion increasing and rail access ineffective, businesses and residences may continue to move away from congested cities towards less congested and smaller cities. These newer cities often have sprawling development patterns. Until larger and denser cities can provide effective access to the airport, small but sprawling cities will have a competitive advantage. These cities, which are heavily auto-dependent and land consuming, will continue to grow, damage our environment, and arguably promote societal isolation.
Any city that continues to grow will eventually have a landside capacity problem at its airport. Most airports in the U.S. were constructed without considering landside access as an important element. Moreover, the construction of a new runway can bring about a very large increase in airside capacity. The addition of a new lane onto an expressway leading to the airport provides a relatively small increase in landside capacity. Most major airports already have expressways leading to them, and after a point, adding lanes to these expressways becomes impractical or infeasible. Airline load factors and the number of flights are increasing, but the single occupancy vehicle that
carries most passengers to the airport is becoming more dominant. The expandability of airside capacity relative to landside capacity implies that major landside congestion may await all airports that wish to grow.
Therefore, landside congestion is, or will eventually be, a problem for most U.S. airports. Rail, or a different high-occupancy mode with its own right-of-way, would seem to be a potential solution to the landside congestion problem. Rail should be able to make a significant contribution to solving this problem, but so far it has not. If the landside congestion issue is to be solved via rail, we must first figure out why previous attempts at solutions have failed, and whether or not we can achieve greater success with modified strategies.
1.2 The Approach
This research will investigate why airport rail links in the U.S. have failed to attract significant percentages of airport passengers, and will attempt to accomplish two important things. First, it will help to solve the problem outlined above by recognizing what it may take to create a viable airport rail link, as well as what makes most U.S. airport rail links unattractive. Second, the results of this research will be applied to a U.S. airport rail link currently in the planning stages. This proposed rail link would be part of the new Tren Urbano heavy rail system in San Juan, Puerto Rico. This research will attempt to address the question of whether it makes sense to build rail access into a future Tren Urbano extension, and if, so, how it should be done to ensure that such a link carries significant numbers of airport passengers.
Based on what is learned from researching U.S. airport rail links, a determination will be made as to the ability of a Tren Urbano airport rail link to attract significant numbers of airport passengers. This determination will be made for the existing airport rail link plan in San Juan. However, the research presented here should show the key characteristics necessary for an airport rail link to attract significant airport passengers. The characteristics that are applicable to San Juan will be identified, and modifications to the airport rail link plan, if they are necessary, will be suggested.
The positive and negative aspects of current U.S. airport rail links will be determined through a series of case studies. An airport rail link is defined to be any rail service that either provides a station within walking distance of an airport terminal, or where a designated airport shuttle vehicle connects the rail station to an airport terminal. The purpose of this definition is to exclude airports at which an airport rail link does not even have the advantage of offering consistency in the face of traffic congestion on airport access roadways. It is assumed that if rail gets close enough to an airport terminal for there to be a designated shuttle service, then this rail link may have a consistency advantage over the automobile. A good example of an excluded airport is LaGuardia Airport in New York, where a city bus connection to the subway is available. It is excluded because this bus is not designated as an airport shuttle, and must navigate through congested city streets for a significant distance. Although this definition might exclude a bus connection that was short but not designated as an airport shuttle, this is not a problem since such a connection is very unlikely (airports usually take the opportunity to promote rail links with free shuttles) and no such example is known. More importantly, this definition serves to include airport rail link connections that can clearly
provide more consistent service than access roadways even if the airport train station is not inside the airport terminal.
The case studies examine the characteristics of all U.S. airport rail links that fall under this definition for the purpose of determining propositions about airport access that can then be applied to potential airport rail links. The conclusions drawn from the case studies and to some extent the information from the case studies represent the perspective of the airport, as opposed to the perspective of the city or the individual. The perspective of the city would draw in too many additional factors that could obscure the airport access problem. The individual's perspective is also too broad. An individual may prefer an airport rail link in order to have the option of using it, while he or she continues to take a taxi under most circumstances. An airport should have the main objectives of growth and improving landside access, which are the same objectives as this research. This is why this perspective is adopted.
The case studies analyze the characteristics of each city and airport in terms of factors that can be changed and those factors that cannot be changed. This way, the lessons from these case studies will not imply that proper planning can produce high ridership on any given airport rail link. The case studies will help to highlight the characteristics of certain cities and their airports that can make even the best airport rail links poorly used. They will also help realize the city and airport characteristics that are most amenable to airport rail link construction.
The major value of this overall approach is that it establishes a body of knowledge about airport rail links from which others can draw. Although this research is geared towards establishing the factors necessary to create a successful airport rail link in San
Juan, the information should help others in future American airport rail planning. A pure modeling approach focused only on San Juan might help to determine whether or not the San Juan link should be built, but it would not answer the more general question.
1.3 Literature Review
One of the stimuli for this research is that airport rail links in Europe often garner much greater mode shares than American airport rail links. Therefore, we know that high airport rail link ridership is possible. In theory, it should be possible to learn from the European experience and design an airport rail link that is comparable in San Juan. However, Coogan's research (1995) in this area showed that European airport rail links are more likely to attract significant mode shares due to the extensive public transit and rail network that exists independent of the airport rail link (see Table 1-1)1. Coogan explains that mode shares for European rail links are typically twice as high as those for American airport rail links due to the fact that European travelers are more likely to use rail to get to their final destination. In other words, since American travelers usually require an automobile at some point within a journey to/from the airport or during their stay, they have a lower probability of using an airport rail link. His research prompts the question of how high a mode share is achievable for an airport rail link in San Juan simply because of the lack of an extensive rail system there and high car ownership rates.
Coogan's research does not, however, provide a framework for determining whether or not a potential airport rail line in the U.S. will be able to improve on, or match the highest mode share figures of its peers. His research sought to explain the differences between European and American airport rail link mode share. He does not
attempt to explain in detail whether this gap can be filled and if so how. In fact, he suggests working towards the closing of this gap by performing research such as that presented here; an attempt to build on the limited successes of U.S. airport rail links in order to increase mode share in future rail link plans. Coogan also stops short of making suggestions that might improve rail access in the U.S., which is the focus of this research. Table 1-1 Coogan's Airport Rail Link Comparison (1995)
Europe Mode Share U.S. Mode Share
Zurich 34% Washington National 15%
Munich 30% Atlanta Hartsfield 9%
Frankfurt 29% Boston Logan 6%
London Gatwick 26% Chicago O'Hare 5%
Amsterdam Schipol 25% Philadelphia 5%
Harvey (1986) also performed significant work in the field of airport access. Harvey attempted to model airport access choice for departing passengers in the Bay Area2. He obtained survey data for these passengers, and then estimated a multinomial logit model to reflect the relative importance of factors that led to their decision about which mode to use to access the airport. The logit equation calculates the probability (P) that a decision-maker (i) will choose mode (j) given a utility (U) for each mode:
P[i,j]= Nexp(U[i, j U[ij] is defined as a linear function as follows:
Eexp(U[i, k]) k=I
U[ij] = bo + bi + Xi[i, j]+...+bm* X[i, j]
Where m is the number of variables that affect utility, X's are relevant attributes of the alternative and the decision-maker, and b's are parameters to be estimated. Five utility functions were estimated for five distinct access modes: Drive, Drop-off, Transit, Airporter, and Taxi. Harvey estimated two different models, B 1 and B2, for two samples: "business" (passengers indicating "business" or "convention" as their trip purpose) and
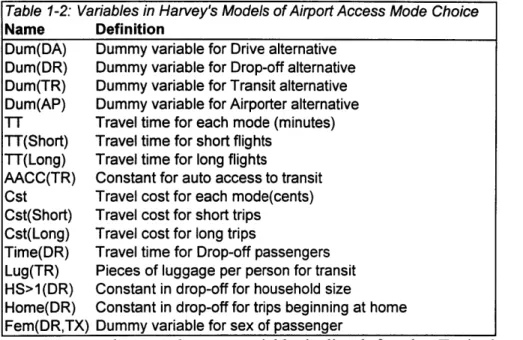
"non-business" (all others) passengers. The sixteen variables used in the models are shown in Table 1-2. The difference between the two models is that B 1 does not account for differences in airport access mode choice that may be associated with longer or shorter flight times. The variables TT(Short), TT(long), Cst(Short), and Cst(Long) appear only in model B2. B2 does not incorporate the variables TT or Cst. The "business" models do not use the Fem(DR,TX) variable.
Table 1-2: Variables in Harvey's Models of Airport Access Mode Choice
Name Definition
Dum(DA) Dummy variable for Drive alternative Dum(DR) Dummy variable for Drop-off alternative Dum(TR) Dummy variable for Transit alternative Dum(AP) Dummy variable for Airporter alternative TT Travel time for each mode (minutes) TT(Short) Travel time for short flights
TT(Long) Travel time for long flights
AACC(TR) Constant for auto access to transit Cst Travel cost for each mode(cents) Cst(Short) Travel cost for short trips
Cst(Long) Travel cost for long trips
Time(DR) Travel time for Drop-off passengers Lug(TR) Pieces of luggage per person for transit HS>1(DR) Constant in drop-off for household size
Home(DR) Constant in drop-off for trips beginning at home Fem(DR,TX) Dummy variable for sex of passenger
Note that no dummy variable is listed for the Taxi alternative - this was
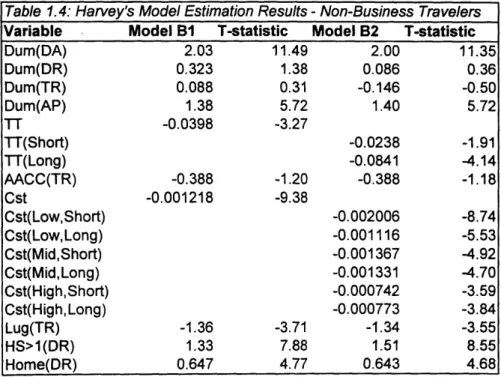
considered as the base mode. Several additional variables are incorporated into the "non-business" model. Both non-business models use the dummy variable for sex of the passenger, and neither incorporates the Time(DR) variable. Several additional variables for cost (Cst (Low, Short), Cst (Low, Long), Cst(Mid, Short), Cst(Mid, Long), Cst(High, Short), Cst(High, Long)) are used in model B2 to highlight the greater cost sensitivity for this group. The estimation results for both models, using both the "business" and "non-business" samples, are presented in Tables 1-3 and 1-4.
Table 1-3: Harvey's Model Estimation Results - Business Travelers Variable Model B1 T-statistic Model B2 T-statistic
Dum(DA) 1.44 9.69 1.36 9.02 Dum(DR) 0.158 0.52 -0.086 -0.27 Dum(TR) -1.17 -3.37 -1.43 -3.97 Dum(AP) 0.662 2.51 0.571 2.13 TT -0.069 -3.73 TT(Short) -0.0493 -2.25 TT(Long) -0.0987 -3.41 AACC(TR) -1.42 -2.30 -1.36 -2.20 Cst -0.000995 -8.52 Cst(Short) -0.001444 -7.31 Cst(Long) -0.000897 -7.20 Time(DR) -0.0159 -4.81 -0.0148 -4.40 Lug(TR) -0.473 -1.03 -0.456 -1.00 HS>1(DR) 0.489 2.02 0.506 2.08 Home(DR) 0.794 4.35 0.806 4.40
Table 1.4: Harvey's Model Estimation Results - Non-Business Travelers Variable Model BI T-statistic Model B2 T-statistic
Dum(DA) 2.03 11.49 2.00 11.35 Dum(DR) 0.323 1.38 0.086 0.36 Dum(TR) 0.088 0.31 -0.146 -0.50 Dum(AP) 1.38 5.72 1.40 5.72 TT -0.0398 -3.27 TT(Short) -0.0238 -1.91 TT(Long) -0.0841 -4.14 AACC(TR) -0.388 -1.20 -0.388 -1.18 Cst -0.001218 -9.38 Cst(Low,Short) -0.002006 -8.74 Cst(Low, Long) -0.001116 -5.53 Cst(Mid,Short) -0.001367 -4.92 Cst(Mid,Long) -0.001331 -4.70 Cst(High,Short) -0.000742 -3.59 Cst(High,Long) -0.000773 -3.84 Lug(TR) -1.36 -3.71 -1.34 -3.55 HS>1(DR) 1.33 7.88 1.51 8.55 Home(DR) 0.647 4.77 0.643 4.68
From these figures, Harvey reached several conclusions about airport access relevant to this research. First, he showed that travel time and travel cost are both strong explanatory variables in airport access mode choice. Second, time-sensitivity for airport access time was found to be high relative to typical travel time-sensitivities, especially for business travelers. This sensitivity was found to increase with the length of the flight
travelers were trying to catch. Moreover, the value of time for air travelers accessing airports was found to be at least as high as the average wage, and often higher. Finally, travelers carrying more than one piece of luggage are substantially less likely to use transit.
Harvey's work, the most comprehensive available on the subject airport access, is helpful but not definitive in terms of looking at the potential for proposed airport rail links. First, his analysis used survey data from three airports in the San Francisco area. Of these three airports, at the time of Harvey's study, only one had a true rail link (Oakland), which had an off-airport train station. This may have made it difficult for Harvey to examine a potentially important variable: reliability. Since it does not take into account a potentially important advantage of rail (the transit alternative at several U.S. airports), his model may not be valid in analyzing airport rail links. This research, by contrast, focuses on rail in order to account for transit's potential comparative advantage. Furthermore, mode choice by passengers at Bay Area airports, though helpful, may not be applicable to all parts of the U.S. This research attempts to be more comprehensive, and therefore more useful for the planning of any U.S. airport rail link.
Second, Harvey looks at airport access only from the perspective of the individual. The survey he analyzed asked individuals to indicate the mode of transportation they used to access the airport. This method is valuable, but it misses some points that could help an airport authority and a metropolitan area determine whether or not and/or how to build an airport rail link, as described above. Harvey's perspective fails to account for the tendency of certain airport characteristics to affect transit mode share. He does examine long versus short flights, but this is not the whole
picture. For example, airports with more low-cost carriers may tend to attract more transit riders. Since Harvey did not examine airport characteristics in detail, his study does not account for the potential influence of these factors. Airport characteristics may have an important effect on airport rail link mode share that will hopefully be uncovered in this work.
Mandalapu and Sproule (1995) performed more recent work on this topic3. In their paper (based on an unpublished Ph.D. dissertation4) on rail transit access, they
sought to define when rail transit connections to airports make sense from a cost perspective. They examined three generic rail transit access alternatives: 1) An exclusive airport link to the CBD, 2) An extension of an existing line to the airport, and 3) A shuttle bus or people mover connection to a nearby rail line. The research used multi-criteria analysis with travel time, cost, reliability, baggage convenience, accessibility, and parking as the criteria. These criteria were assigned values and weights based on quantitative and qualitative data collected by the researchers. The values were multiplied by the weights to give final values for each alternative, which is really a measure of attractiveness on a relative scale. Each rail alternative was compared with bus, auto, and taxi using a range of distances, demands, business/vacation traveler ratios, and baggage handling facilities. The different ratios of business to leisure passengers used were 90/10, 50/50, and 10/90.
For each of these different ratios, based on demands for airport access at different distances, the relative "attractiveness" of different types of rail access was determined. The authors use "attractiveness" to refer to whether or not it makes sense to build a rail link from a cost perspective. For example, they concluded that if an airport attracts
mostly vacationers, it must have passenger demand of over 50,000 passengers per day that wish to go where the link goes in order to make an exclusive rail link attractive. By contrast, for an airport with mostly business travelers, exclusive rail links become attractive at demands from 2,500 to 18,000 per day. At an airport with an equal mix of business and vacation travelers, demands of 15,000 passengers per day for a 10km distance, or 30,000 passengers at a 50km distance are required to make the link attractive. Some general conclusions were: 1) Rail alternatives are more attractive at lower demand levels if an airport has more business passengers, and 2) For low demands, rail extensions are more attractive than exclusive links, and shuttle buses are more attractive than people mover connections.
This analysis of when demand levels at an airport will make a rail link attractive does not attempt to address the issue of why many rail links at the nation's busiest airports do not carry significant numbers of passengers. Also, this analysis considers only one characteristic of airports: the ratio of business to leisure passengers. Although this is useful, it is but one of many airport characteristics that can influence rail link demand. Many differences between airports that may have more to do with airport rail links include long vs. short haul, domestic vs. international, and low-cost vs. major airlines, none of which are examined by Mandalapu and Sproule.
1.4 Thesis Structure
After this introduction, case studies of all American airport rail links (according to the definition presented previously) are presented in Chapter 2. First, an explanation of the case study information is given. Then in-depth case studies of some key cities are
presented, followed by short summaries of the remaining rail links. Finally, some information is provided about airport rail links currently under construction.
Chapter 3 draws some preliminary conclusions from the case studies. First, the case studies are compared and analyzed to try to determine which factors in each of the case studies play a large role in determining mode share. Then propositions that can be proposed based on the comparison and the case studies are presented. Chapter 4 takes the propositions a step further. First, the notion that airport train station location is an important factor in rail link mode share is assessed. This is done through an analysis of Washington National Airport. Second, population and employment data for three cities is analyzed to determine the how much the ability of an airport rail link to serve population and employment centers affects mode share.
In Chapter 5 the focus shifts to San Juan. First the plans for the San Juan airport rail link are described, and then a case study of the San Juan airport is presented. Chapter 6 examines the San Juan airport rail link proposal in detail. First, the propositions developed in Chapter 3 are applied to San Juan. Secondly, from this analysis a mode share prediction for San Juan is developed. Third, conclusions about the San Juan rail link are discussed.
Chapter 7 is the final chapter where conclusions about the entire thesis are drawn. A summary and general conclusions from the thesis and the San Juan case study are presented.
Chapter 2 - Case Studies
This chapter contains the case studies that will provide a substantive look at the current state of U.S. airport rail access. In the first section, the procedure for analyzing each link is described. Following this are six detailed case studies of what are seen as some of the most interesting and significant airport rail links: John F. Kennedy Airport in New York City (JFK), Philadelphia International Airport (PHL), Washington National Airport (DCA), Boston Logan Airport (BOS), Chicago O'Hare (ORD), Chicago Midway (MDW), and San Jose International Airport (SJC). JFK was chosen for detailed analysis because New York City is the biggest public transit market in the U.S., and it is important to assess the role of such a market in determining airport rail link viability. Philadelphia was chosen because it is the only U.S. example of a commuter rail, in-terminal airport rail link. Washington National has the highest mode share of any U.S. airport rail link and thus deserves detailed analysis. Boston Logan was chosen because it was the first U.S. airport rail link, and because information about it is easily accessible. Chicago provides the only opportunity to analyze two airport rail links in one city, and thus could not be left out. Finally, San Jose allows an in-depth look at a new light rail system in an auto-dominated environment.
Following the detailed case studies are short summaries that provide limited information about every other U.S. airport rail link. For the purposes of this analysis, an airport rail link is defined as was described earlier: the rail service must provide a station within walking distance of an airport terminal, or a designated shuttle bus must connect the rail station to an airport terminal. All other U.S. rail links that fall under this definition are briefly described in this section. The last section in this chapter is a
description of two airport rail links currently under construction: JFK (a new link) and San Francisco (SFO).
2.1 Case Study Introduction
In the analysis of all rail links, the factors describing each link are separated into two categories (see Table 2-1).
Table 2-1: Fixed and Design Factors
Fixed Factors Design Factors
location of the airport relative to the city speed and reliability relative to other access modes productions and attractions along link location of airport train station
local cultural factors transit fare(s) airport characteristics parking rates ease and availability of connections
state of local transit
Aspects of an airport rail link that are considered permanent or very difficult to change are termed fixed factors. These include the location of the airport relative to the city, the attractions and origins along the rail link, local cultural factors, airport characteristics, ease and availability of connections, and the state of local transit. Aspects that are, at least to some extent, controllable are termed design factors. These include speed and reliability relative to other access modes, location of the airport rail station, transit fares, and parking rates. The location of the airport rail station is usually reduced to either "on-airport" or "off-airport". In reality, however, there are some rail stations that have shuttle bus connections and also pedestrian access. For the purposes of this research, in order to qualify as "on-airport" a train station must provide pedestrian access to the airport terminal.
Most of these factors are self-explanatory, but "location of the airport relative to the city," "ease and availability of connections", and "productions and attractions along
rail link" need further specification. Location can be measured in two separate ways: 1) Miles from the airport to the central business district(s) and 2) the location of the airport relative to the metropolitan area population and employment locations. The second of these ways is analyzed in more detail after the case studies are presented. Ease and availability of connections will be used to refer to the facility with which passengers can access points other than the downtown central business district. Since all airport rail links examined serve downtown directly, connections are only relevant to the extent that they serve other destinations. Productions and attractions are discussed in terms of the chances that airport passengers might use the airport rail link to access some other part of the city besides the central business district (or alternatively, the chances that local residents live on or near the airport rail line). In all cases, the major productions and attractions along the links are likely to be in the central business district.
Some quantitative data are also presented. The figure given for airport passengers per year is the total number of passengers handled at that airport. A separate
figure is given for origin and destination passengers at the airport per year, since this figure is more relevant when discussing access to the airport. Transit Fare is defined as the full one-way cost of off-peak travel by rail (including necessary bus connections)
6
from the airport to the city center . Peak fares (as in Washington D.C.) are ignored because airport passengers are not subject to the excessive peaking that typifies commuter patterns, and the peak fares only apply during small portions of the day. Auto travel time is the time that it takes, under typical daytime conditions, to drive from the airport to the center city area. This figure is especially relevant for comparison of taxi and rail. Rail travel time is indicated for the purposes of comparing it with auto travel
time. It is an approximation of the time from the point the passenger begins waiting for an initial vehicle boarding at the airport terminal to the exit at a downtown station'. This means that any shuttle bus time and waiting time are included in this figure, but not walking time. The reason for this is that walking time at an airport is generally equivalent for auto (non-taxi) and rail passengers (where this is not the case, it is noted). Walking time within the downtown area is also excluded, because both auto and rail passengers may have to spend extra time after arrival within the downtown area before reaching a final destination. Whereas a rail passenger may need to walk from the station to an apartment or office, an auto passenger will also experience some supplemental time subsequent to entering downtown (traversing congested city streets, parking, etc...). This reasoning holds for trips in the opposite direction (city to airport) as well. Taxi travel time is typically 5 to 10 minutes shorter than the auto travel time.
The distance from the airport terminal(s) to the city center is reported as miles to CBD8. Three parking rates are reported. The first is for short-term parking, a dollar amount that corresponds to the cost of one-hour parking at the airport in a short-term lot. This is used as a measure of the parking cost for meeters and greeters. The cost reported for mid-term parking indicates the cost of one day of parking for those passengers least sensitive to price. These are drivers that chose to park in a more expensive, more convenient airport lot. A dollar amount for long-term parking indicates the lowest available long-term parking rate per day at the airport (rates at off-airport lots are not reported). This figure is meant to measure parking cost for local residents who drive to the airport and are price sensitive. At some airports, this figure may be the same as the mid-term parking rate.
The final figure reported for each case study is the mode share9. This indicates the percentage of travelers going to and from the airport who choose to use the available rail link. This figure does not include airport workers. It does, however, provide a good measure of the relative success of an airport rail link, and mode share figures are used to compare rail links with one another. Where available, other results of the latest passenger survey are also presented. These results usually indicate the mode share of every available access mode. The share garnered by public transportation is calculated where possible -this figure does not include taxis or private limousines, but it does include all access modes that are available to the general public. Where possible, different mode shares for residents and non-residents are also presented. The category termed "residents" refers to people who live within the metropolitan area that the airport serves.
Mode share figures are typically determined by conducting air passenger surveys, and are not precise. An awareness of the lack of precision of mode share figures is vital to understanding the case studies. These figures are used to make important determinations about rail link characteristics, but they are only estimations of the percentage of people using rail links. These estimates are generally accurate to within 2 percentage points.
2.2 Detailed Case Studies
2.2.1 John F. Kennedy Airport (JFK)
New York's largest airport is a fascinating piece of the American rail access puzzle. New York City has the greatest transit usage of any city in North America, and a vast subway and commuter rail system on par with any city in the world. Kennedy Airport is the largest international gateway in the country. Yet since most of the subway
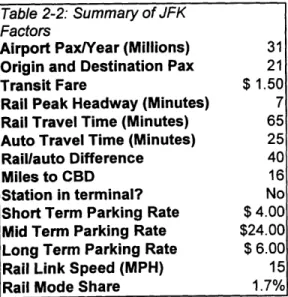
system was built well before JFK, Kennedy Airport is not effectively connected to it. Plans are currently well underway (see section 2.5.1) to make a much more effective airport connection with a light rail line. However, for years JFK has been weakly connected to the New York City subway system by a shuttle bus to the Howard Beach station. The failure of this line to attract significant numbers of the passengers traveling to JFK is a story from which we can learn much about rail access to U.S. airports. Many people would not consider the current JFK transit link to be a true airport rail link, since the subway station is so far from the airport. However, the lessons about rail access in the largest city in the country are important, even if it is not true airport rail access that is being analyzed. Table 2-2 summarizes the key attributes of JFK and its existing access characteristics.
Table 2-2: Summary of JFK Factors
Airport PaxlYear (Millions) 31
Origin and Destination Pax 21
Transit Fare $ 1.50
Rail Peak Headway (Minutes) 7
Rail Travel Time (Minutes) 65
Auto Travel Time (Minutes) 25
Raillauto Difference 40
Miles to CBD 16
Station in terminal? No
Short Term Parking Rate $4.00
Mid Term Parking Rate $24.00
Long Term Parking Rate $ 6.00
Rail Link Speed (MPH) 15
Fixed Factors
Location relative to city:
Kennedy is located sixteen miles from lower Manhattan0. It is officially within the New York City limits, but it lies in the farthest reaches of Queens, the New York borough with the greatest area (see Appendix 2-A). However, Brooklyn (also very close to the airport) and Queens are home to more New York City residents than the other three boroughs combined, and the vast suburban area of Nassau County is immediately adjacent to the airport. Therefore, JFK is located quite close to a significant resident population. However, despite housing only one million of New York City's twenty million people, Manhattan is the center of commerce for the entire region. Many business travelers (especially international passengers) arriving in the New York area at JFK are heading to lower Manhattan.
Productions and Attractions along Rail Link:
The rail link to Kennedy is New York's famous "A" train (see Appendix 2-B). This train is the longest subway line in a vast subway system of 722 miles, and it passes through very dense population centers". The line begins across Jamaica Bay in the Rockaways. It crosses over the bay and past the airport, winding its way towards downtown Brooklyn through some very low-income neighborhoods. It then passes through lower Manhattan, along Central Park through the Upper West Side and ends at the very northern tip of Manhattan. At different points on its journey, this line connects to every other subway line in the city, as well as to Penn Station, where most regional commuter trains arrive and depart.
State of Local Public Transit/Cultural Factors:
New York City is the most transit-oriented city in the United States. Owning and operating a car in Manhattan is prohibitively expensive and unnecessary for most residents, and even the outer boroughs have relatively low car ownership rates. However, the airport is far from Manhattan on the border between Nassau and Queens Counties. These two counties are heavily car dependent relative to Manhattan and Brooklyn. Therefore, most New York area residents close to JFK are likely to own vehicles, despite living in the most transit dependent city in the U.S.
There is probably no city in the world more culturally diverse than New York City. However, New Yorkers generally agree that time is limited, and are well-known for always being in a hurry. They are therefore very sensitive to the amount of time it takes to get anywhere, especially to the airport.
Ease and Availability of Connections:
The "A" train passes through so much of New York City that it connects with every other subway line and all Long Island Rail Road (LIRR) and New Jersey Transit trains through Penn Station. However, the New York subway system is designed such that most connections must be made in Manhattan. Since only one million of the twenty million people in the metropolitan area actually live in Manhattan, most of these connections typically do not allow effective paths between the airport and most residences. Residents of Long Island, for example, are very unlikely to take the "A" train towards Manhattan in order to transfer to the LIRR. Residents of Queens, the Bronx, and
Westchester County north of the city would also have to make circuitous journeys if they wanted to take rail to JFK.
Airport Characteristics:
Kennedy Airport serves primarily international passengers and long-haul destinations. The Port Authority of New York and New Jersey runs Kennedy and the two other airports in the region, Newark and LaGuardia. LaGuardia airport, which is also in Queens but much closer to Manhattan, serves most of New York's domestic passengers. Newark is slightly closer to downtown Manhattan than JFK, and has seen a recent surge in traffic, but does not handle nearly as many international passengers as JFK, or as many domestic passengers as LaGuardia. Kennedy is the premier international gateway in the United States, but it is also consistently ranked by travelers as one of the worst airports in the world due to its extreme congestion and outdated facilities.
Design Factors
Location of airport train station:
This is one of the factors which makes the "A" train an ineffective airport rail link. The closest station to the airport is the Howard Beach station, three miles from the airport, and it is connected to the airport terminals with a free shuttle bus. This bus is equipped with luggage racks, and timed to leave upon the arrival of a train. But the bus also serves the long-term parking facility, and is the means, apart from walking, to transfer between terminals at JFK. Travel on the bus takes approximately 15 minutes (including wait time).
Speed relative to Other Modes:
The "A" train is very slow. Although it runs on express tracks and makes many fewer stops than the corresponding local train, it still takes over an hour to get to lower Manhattan from JFK by subway. The train itself is scheduled for approximately 35
minutes to lower Manhattan, but the shuttle bus increases this time by fifteen minutes, and travel time to midtown is an additional 15 minutes2. Congestion on the highways leading to JFK is quite common, and at some times the subway may actually be faster than a taxi. However, the majority of the time, even traffic cannot make this rail connection look good. Since there are many different routes from JFK to Manhattan and traffic in the city is extremely variable, a passenger can never be certain that a trip to downtown via taxi will be slow. The same passenger knows for certain that the train will take more than an hour under the best possible conditions.
The speed of this link was temporarily altered in 1978, when a concept called the "JFK express" was introduced. This train ran every twenty minutes from 57*I Street and 6* Avenue in Manhattan, with only seven stops to the airport. The run took 44 minutes end to end, which means running time was probably close to 25 minutes from lower Manhattan and 20 minutes from downtown Brooklyn (plus the shuttle bus ride of 15 minutes). The fare for this train was about five times the regular subway fare, and was payable upon boarding the train. The "train to the plane" was heavily marketed, had "first-class" service with four person crews, and was on time more than 90% of the time in an excellent display of reliability3. The experiment was a major financial loser
Mode Share Survey Results:
Table 2-3: JFK Ground Access Mode Split Mode Shares
Mode All Passengers Local Residents Non-residents
Private Car - Drop-off Only 28.5% 39.1% 19.2%
Taxi 22.1% 15.3% 27.1%
Private Limo/Car Service 16.9% 19.6% 14.2%
Private Car - Daily Parking on Airport 8.7% 10.8% 6.8%
Scheduled Airport BusNan 4.8% 2.7% 6.5%
Charter Bus 3.7% 1.2% 5.6%
Shared Limo/Car Service 3.0% 2.6% 3.3%
Rental Car 2.9% 0.7% 4.7%
Private Car - Long Term Parking 2.6% 3.8% 1.7%
Private Car - Parked Off-Airport 2.3% 2.5% 2.1%
Hotel Courtesy Vehicle 1.8% 0.1% 3.1%
A Train 1.7% 1.2% 2.1%
Local City Bus 0.5% 0.2% 0.7%
Other 0.4% 0.2% 0.5%
Helicopter 0.0% 0.0% 0.1%
The mode shares calculated from the latest JFK passenger survey, taken between May 1997 and April 1998, are shown in Table 2-3. About 84% of all JFK origin/destination (O-D) passengers access the airport using some form of private automobile or taxi. Airport buses account for the largest portion of the remaining passengers, but charter buses account for a similar share. Public transportation's mode share is approximately 10% (taxis, charter buses and hotel vehicles are excluded from this figure).
Non-residents appear to be more likely than residents to use JFK's airport rail link, and non-residents are almost twice as likely to use public transportation to JFK (13% of residents vs. 7% of residents). Most of this difference is attributable to non-resident use of airport buses.
2.2.2 Philadelphia International Airport (PHL)
Philadelphia has the fifth largest metropolitan population in the United States 4, and is typical of several East Coast cities in the way its center city has declined. Philadelphia is analyzed in detail because it provides a good example of a commuter-rail airport connection. The airport is a major hub for US Airways, the nation's sixth largest air carrier. It is connected to the city center by an extension of the local commuter rail system. Table 2-4 summarizes the airport and access characteristics for Philadelphia. Summary of PHL Factors
Airport Pax/Year (Millions) 22
Origin and Destination Pax 17
Transit Fare $ 5.00
Rail Peak Headway (Minutes) 30
Rail Travel Time (Minutes) 42
Auto Travel Time (Minutes) 17
RaillAuto Difference 25
Miles to CBD 7
Station in Terminal? Yes
Short Term Parking Rate $ 5.00
Mid Term Parking Rate $14.00
Long Term Parking Rate $ 6.50
Rail Link Speed (MPH) 10
Rail Link Mode Share 2.0%
Fixed Factors
Location Relative to City:
The airport is located seven miles from the central business district,'5 south of the city, near the Delaware River. PHL is well located with respect to the metropolitan region and downtown.
Productions and Attractions along Rail Link:
Since the Philadelphia rail link is an express line to downtown, there is a very limited effective population along the link. The line makes two stops (Eastwick and
University City) outside the airport before reaching downtown, where it stops in five different locations. Downtown Philadelphia is not a major residential area, but is clearly a major business destination. At most times, the line continues past downtown into the northern suburbs just outside the city, where it terminates (not reaching as far into the suburbs as most local commuter lines). At other times, the line terminates downtown.
State of Local Transit/Ease of Connections:
Like other northeastern cities, Philadelphia has a solid public transportation system. The rail network includes seven commuter rail lines, two subway lines, and eight trolley lines (see Appendix 2-C). However, almost all commuter rail connections go through the three major downtown stations in the very center of the city, making suburb to suburb commuting very time consuming. The subway system is much less extensive, and covers only a part of the city.
Cultural Factors:
No significant cultural factors affect Philadelphia's airport rail link.
Airport Characteristics:
PHL handled more than 22 million passengers in 1997, but the since the airport serves as a major hub for US Airways, that figure is much higher than the actual number of passengers arriving and departing from the metropolitan area (17 million). It accommodates more than 25 carriers serving over 100 destinations. The airport is owned by the city, and operated by the Department of Commerce's Division of Aviation.
Terminal A is the international terminal, but the number of international carriers is quite limited and some domestic carriers also use the terminal. Terminals B and C are dominated by US Airways, with B handling domestic and commuter flights and C handling international flights. All major carriers along with some low-cost airlines fill out the rest of the airport. The airport is currently consolidating terminals B and C into one terminal.
Design Factors
Location of airport train station:
Philadelphia is unique in this category. Not only does the airport rail link take passengers straight to the terminals, but it even has three different stations within the airport (see Appendix 2-D). One station is between terminals A and B, one between terminals C and D, and the terminus is at terminal E. From the first airport train station to the third is a distance of three tenths of a mile'6.
Speed Relative to Other Modes:
The airport train takes forty-two minutes to get from the Market East station in downtown Philadelphia to the airport terminals". It is a slightly shorter ride from the 30* Street station, the rail hub of Philadelphia. PHL is well connected to the local highway network, since it is directly off 1-95 and close to the Pennsylvania Turnpike. Traffic along this corridor can slow travel times from the city center to below those of the rail link during peak hours.
The effective speed of this link is dramatically reduced by thirty-minute headways. However, unlike other rail links that are subject to the peak hours of non-airport travelers, since this line serves the non-airport almost exclusively, it has a schedule that is tailored to the needs of airport travelers. This is reflected in constant thirty-minute headways at all times (:09 and :39 past the hour) during which the link operates. In using these consistent headways, the line does not reflect the peaking of commuters. However, neither does it cater to the peaking of aircraft arrivals and departures.
Mode Share:
Table 2-5: PHL Mode Share Survey Results (1997 - Int'l Terminal Only)
Mode Mode Share
Private Car 46.4% Public Bus 0.0% Train 9.2% Taxi 2.0% Tour Bus 0.0% Limousine 14.3%
Hotel Courtesy Van 15.2%
Off-airport Parking Shuttle 0.7%
Rental Car 4.7%
Other 7.4%
The PHL survey results (presented in Table 2-5) are the most recent that are available, but should be analyzed cautiously. First, the results are from a survey taken over a period of two days, and only between 2:30pm and 7:30pm. This small time period may bias the results. Also, the survey is only for the international terminal at PHL, so the results are quite different from those for the entire airport.
According to this survey, 9.2% of all people accessed PHL by public transportation, and all public transportation mode share is assumed by rail. This is a questionable result since the rail mode share at PHL is known to be much lower (2.0%)
according to more rigorous surveys, and since some other form of public transportation would be expected to account for at least some mode share. The reliability of this survey is questionable.
2.2.3 Washington National (DCA)
Washington National is unparalleled on this continent in terms of its airport rail link mode share. Since it opened in 1977, metro-rail has carried up to 15% of all passengers traveling to and from National Airport1 8, although it now carries closer to
9%19. From looking at DCA, we can learn what factors are necessary to attract significant numbers of passengers to an airport rail link. Table 2-6 summarizes the relevant access characteristics for Washington.
Table 2-6: Summary of DCA Factors
Airport PaxlYear (Millions) 16
Origin and Destination Pax 15
Transit Fare $1.10
Rail Peak Headway (Minutes) 3
Rail Travel Time (Minutes) 17
Auto Travel Time (Minutes) 10
Rail/auto Difference (7)
Miles to CBD 4.5
Station in terminal? Yes
Short Term Parking Rate $4.00
Mid Term Parking Rate $12.00
Long Term Parking Rate $ 8.00
Rail Link Speed (MPH) 16
Fixed Factors
Location Relative to City:
National is located 4.5 miles south of Washington D.C.2 0, just across the Potomac
River in Virginia. Its proximity to downtown makes it well located with respect to both businesses and residences in the area.
Productions and Attractions along Rail Link:
Two rail lines -the Blue Line and the Yellow Line, serve the airport station. Both of these lines operate on the same track when they arrive at the airport (see Appendix 2-E). The Yellow Line is the direct connection to downtown. The Blue Line gets to downtown only after heading through Arlington Cemetery and the Northwest part of the city near George Washington University. It then parallels the Orange Line through downtown and out to the eastern Maryland suburbs. Both lines continue past the airport to Alexandria and other Virginia suburbs. This is the only airport in the country with two distinct subway lines directly serving it, which not only increases the number of people directly served by the rail link, but eases connections for others who may be close to major mass transit lines. For example, riders boarding in the Virginia suburbs along the Orange Line need not enter the city of Washington to access National Airport by rail because the Blue Line provides this connection. On the other hand, riders along the Green Line need not pass through the Western Virginia suburbs along the Blue Line, since the Yellow Line whisks them directly from downtown to the airport. The airport station accounts for approximately 1.3% of the ridership on the Yellow and Blue Lines combined.
State of Local Transit/Ease of Connections:
Washington's metro is a high quality, modem subway system. The system was built in the 1970's, and stations tend to be further apart than those on older rail systems, so that the subway functions almost like commuter rail service in the suburbs. A true commuter rail system (MARC) also extends out from Union Station in the heart of the city. The subway system has five lines, and since they were designed to coordinate, every line connects with every other line. These connections are mostly in the center of the city, which makes many airport to suburb trips via Metrorail circuitous. Furthermore, many Metrorail stations in suburban areas are not located in dense pedestrian centers, meaning another mode of transportation is almost always required to get from these stations to a final destination.
Airport Characteristics:
National Airport is one of three airports in the Washington area. Dulles Airport is a newer facility located in the Virginia suburbs and Baltimore - Washington International (BWI) is located northeast of the capital, in Maryland. Each of these airports plays a specific role. Dulles is primarily an international airport and a hub for United Airlines, BWI is Baltimore's airport and a hub for Southwest Airlines and USAirways, and National is for short-haul domestic departures. Flights over 1,500 miles from D.C. are not permitted from National, but due to the city's location along the most heavily populated corridor in the U.S., these shirt-haul flights represent an enormous amount of traffic - more than 16 million passengers per year. National dominates the local airport scene and can sustain much higher fares than those to neighboring airports2.