A Network-based Approach
on Opportunity Recognition
Dirk De ClercqPia AreniusABSTRACT. This paper argues that individuals differ in terms of their perception of opportunities because of the differences between the networks they are embedded in. We focus on two aspects of individuals’ embeddedness in networks, that is, (1) individuals’ belonging to residential areas that are more or less likely to be characterized by network cohesion, and (2) individuals’ differential access to network contacts based on the level of human capital they hold. Our analyses show that the nature of one’s resi-dential area influences the perception of entrepreneurial opportunities. Further, we find a positive effect for educa-tion, i.e., people with a higher educational level are more likely to perceive entrepreneurial opportunities compared to those with a lower educational level.
KEY WORDS: entrepreneurship, networks, opportunity recognition
JEL CLASSIFICATION: M13
1. Introduction
Shane and Venkataraman (2000) posited that a unique aspect of entrepreneurship research per-tains to the question of how individuals recognize opportunities for business creation. Prior research on entrepreneurial opportunity recogni-tion has focused on the role of the individual,
e.g., the role of her prior knowledge (Shane, 2000) and her alertness to entrepreneurial oppor-tunities (Kirzner, 1973). In this paper, we add to the literature on entrepreneurial opportunity rec-ognition by using a network perspective. Whereas the existing research on networks and entrepre-neurship has already examined the relationship between networks and various aspects such as the creation of new firms (Johannisson and Ramirez-Passilas, 2001), resource acquisition (Birley, 1985; Aldrich and Zimmer, 1986), perfor-mance (Podolny et al., 1996) and firm survival (Reese and Aldrich, 1995; Ingram and Baum, 1997), we believe that the relationship between networks and opportunity perception has not been sufficiently addressed. In this study, we intend to fill this gap in the literature by examin-ing how networks influence individuals’ recogni-tion of opportunities.
We build on the literature that speaks to the importance of individuals’ embeddedness in net-works of relationships with others (Granovetter, 1973; 1985). This literature explains that an indi-vidual’s personal network consists of all people that the individual knows (Barnes, 1972), and focuses on the fact that people may differ in terms of the personal contacts they have with others (Burt, 1986). The entrepreneurship research has pointed to the importance of net-works to entrepreneurs, and even argued that social networks may be the most significant source of knowledge for entrepreneurs (Johannis-son, 1990). For instance, Nahapiet and Ghoshal (1998) discussed how social capital and networks create favorable conditions for the combination and exchange of knowledge, and therefore also for the creation of new knowledge. Further, it has been argued that social encounters between an individual and her network contacts may be an important source of new ideas (Christensen
Final version accepted on February 9, 2005 Pia Arenius HEC Lausanne 522-BFSH-1 CH-1015 Lausanne-Dorigny Switzerland E-mail: [email protected] Dirk De Clercq
Vlerick Leuven Gent Management School and Ghent University
Reep 1
9000 Gent, Belgium
E-mail: [email protected] DOI 10.1007/s11187-005-1988-6
and Peterson, 1990), and networks have also been linked with the number of new opportuni-ties perceived by entrepreneurs (Singh et al., 1999). The rationale is that an individual’s net-work can provide access to knowledge that is not currently possessed, thus leading to the potential for opportunity recognition.
In general, prior researchers have argued that networks differ in terms of their characteristics and that these differences may reflect the extent to which effective knowledge exchange takes place (e.g., Coleman, 1988; Burt, 1992; Davids-son and Honig, 2003). Furthermore, recent research on regional topics has examined differ-ent elemdiffer-ents that contribute to the ‘‘competence’’ of a region (Lawson, 1999), and special attention has been devoted to the opportunity for new knowledge generation based on the combination of existing knowledge bases (Lawson and Lorenz, 1999). In this study, we argue that differences among individuals in terms of the network they are embedded in, affect the likelihood for oppor-tunity recognition. We examine two aspects of individuals’ embeddedness in networks. First, we focus on differences across individuals in terms of the type of network they belong to. More spe-cifically, we look at the cohesiveness of the net-work individuals belong to. Second, we examine individual differences in opportunity recognition in terms of the extent to which individuals are potentially exposed to network contacts. More specifically, we argue that an important mecha-nism through which individuals’ human capital affects opportunity recognition pertains to the potential access to network contacts.
2. Theoretical background
2.1. Network cohesiveness
Entrepreneurship is an activity that involves the discovery, creation and exploitation of opportu-nities aimed at the introduction of, e.g., new goods and services, new ways of organizing, or new processes (Venkataraman, 1997; Shane and Venkataraman, 2000). In this paper, we focus on the first part of the entrepreneurial process, namely on opportunity discovery. We adopt the Kirznerian (1973) view to opportunity recogni-tion according to which entrepreneurial
opportu-nities arise from individuals’ differential access to information. That is, people discover opportuni-ties through the recognition of the value of new information that they are exposed to (Shane, 2000). We argue that an important reason for why some people are more likely to be exposed to new information and therefore to perceive entrepreneurial opportunities results from the dif-ferent structure of the network they are embed-ded in.
The network literature suggests that individu-als gain access to information through interac-tion with other people, who in turn are linked to others, and that network characteristics influence the availability, timing and quality of informa-tion access. To date, the literature on individuals’ embeddedness in networks has offered two views, i.e., Burt’s (1992) structural hole argument and Coleman’s (1990) network closure argument. Both views build on the assumption that the nat-ure of networks affects the flow of information among individuals, and therefore the extent to which individuals can use this information to beneficial ends. However, the two views provide a contrasting perspective on how networks affect individuals’ access to information. We will develop two competing hypotheses, then, relating network structure to individuals’ perception of opportunities. More specifically, the focus will be on the cohesiveness of individuals’ networks, i.e., the extent to which one’s network is mainly char-acterized by weak ties and structural holes (i.e., low cohesive networks) versus strong ties (i.e., high cohesive networks).
Burt’s (1992) structural hole argument builds on the notion of the ‘‘strength of weak ties’’ as originally developed by Granovetter (1973). Granovetter (1973) argued that new information is more easily obtained through casual acquain-tances (weak ties) than through close personal friends (strong ties). More specifically, he posited that given the high maintenance costs associated with close relationships, there exists a maximum in the number of ‘‘strong ties’’ one can have with others. However, it is possible for individuals to have many ‘‘weak ties’’ within their social net-work (Granovetter, 1973). Furthermore, Grano-vetter (1973) argued that because an individual does not interact with weak ties on a regular basis, weak ties may give better access to unique
information compared to strong ties. Thus, based on the above and since we maintain that the per-ception of entrepreneurial opportunities requires new information, we reason that individuals who possess more weak ties are more likely to per-ceive entrepreneurial opportunities compared to individuals who possess less weak ties.
Burt (1992) extended Granovetter’s argument by further explaining that a network tie provides access to new information if the tie is non-redun-dant, i.e., if it spans a structural hole. Burt (1992) explained that network ties between two individ-uals are redundant if they are structurally equiva-lent (i.e., the individuals have the same contacts) and cohesive (i.e., the relationship is character-ized by emotional closeness). He argued that net-work ties are more likely to be functional and provide access to new information if they are non-redundant. Consequently, networks rich of structural holes are more likely to yield new information, which can lead then to the discovery of entrepreneurial opportunities. Burt (1992) also pointed out that the information benefits stem-ming from structural holes are a product of both primary and secondary structural holes. Whereas primary holes pertain to a person’s direct con-tacts, secondary holes pertain to his or her sec-ondary contacts (i.e., relationships between the direct contacts and third parties). In other words, the notion of individuals’ secondary network (which potentially includes ‘‘secondary holes’’) speaks to how network characteristics at the regional level may affect the network configura-tion individuals are confronted with. Further-more, Burt argued that these secondary structural holes are most likely to exist in networks charac-terized by low cohesion (Burt, 1992). Based on the above arguments, we hypothesize:
Hypothesis 1a: Individuals who are embedded in less cohesive networks are more likely to recog-nize opportunities compared to individuals who are embedded in more cohesive networks. An alternative view on networks and their provi-sion of information was provided by Coleman who advanced his ‘‘network closure argument’’ (Coleman, 1988, 1990). Coleman pointed out that close interactions with others are valuable in terms of the quality of the information that is
provided (Coleman, 1990). For example, a social scientist who is interested in being up-to-date in terms of research in related fields can benefit from her everyday interactions with colleagues, given that these colleagues are reliable exchange partners (Coleman, 1990: 310).
Coleman argued that network cohesion encourages people’s access to information in a timely manner and at the same time in a manner that improves the accuracy of information retrie-val (Coleman, 1988). Dense networks of strong ties facilitate the flow of information between individuals as they imply obligations and mutual understanding among individuals, and therefore a reduced risk of uncertainty. Empirical support for this notion has been found in the literature on interpersonal and interfirm relationships, which showed that when a relationship is predi-cated on a belief in the other’s goodwill, the need to establish monitoring activities to protect one-self against the other’s opportunistic behavior becomes less relevant, and the parties will be more likely to engage in extensive communication and to learn from one another (Zaheer et al., 1998).
Following Coleman’s arguments, we would expect that networks with a high level of cohe-sion are thus effective rather than ineffective in terms of the generation of new knowledge and ideas. In other words, individuals embedded in more cohesive networks would be more likely to generate opportunities for new business creation compared to individuals who belong to less cohe-sive networks. The above arguments lead to the following hypothesis.
Hypothesis 1b: Individuals who are embedded in more cohesive networks are more likely to rec-ognize opportunities compared to individuals who are embedded in less cohesive networks.
2.2. Human capital
In the above paragraphs, we hypothesized how differences among individuals in terms of the nat-ure of the network they are embedded in affect the perception of opportunities. In the following paragraphs, we argue that differences among individuals in terms of their human capital are also important to explain differences in opportunity
recognition (Shane, 2000; Shane and Venka-taraman, 2000). We hereby reason that one important, but not the only, mechanism through which human capital affects opportunity recogni-tion is individuals’ overall exposure to network contacts. More specifically, whereas the hypothe-ses given above pertain to individual differences in terms of the type of network one belongs to (i.e., the cohesiveness of the network), the follow-ing hypotheses pertain more generally to individ-ual differences in terms of the extent to which individuals are potentially exposed to network contacts. More specifically, we argue that, besides other mechanisms, an important mechanism through which individuals’ human capital affects opportunity recognition pertains to the potential access to network contacts.
The role of human capital in explaining indi-viduals’ behavior dates back to Becker’s (1964) work in which the idea was advanced that factors such as education and experience are important aspects in economic analysis, just like equipment or other material assets. Becker (1964) argued that human capital is comprised of attributes which can be associated with individuals’ behav-ior and success; in this study we examine the influence of individuals’ human capital in the opportunity discovery process. More specifically, we examine two dimensions of individuals’ human capital that may influence the access to network resources, and thus increase opportunity recognition, i.e., education and work status. Edu-cation and workplace experience indeed are indi-cators of human capital that have been used in labor force participation analyses, and these dimensions have been associated with the behav-ior and success of (potential) entrepreneurs (Evans and Leighton, 1989; Bates, 1997; Greene, 2000).
2.2.1. Education
The existing literature on education and opportu-nities has focused more on the exploitation of opportunities (i.e., actual business creation) rather than the discovery of opportunities by potential entrepreneurs. For instance, it has been argued that educational credentials may make it easier to find employment which entails working for others, thereby reducing the motivations to
engage in self-employment (Bates, 1995; Bates and Servon, 2000). Shane and Venkataraman (2000) argued that individuals’ propensity to exploit opportunities depends on factors such as the trade-off between the value of the opportu-nity versus the cost to create that value, as well as individual differences in terms of risk propen-sity and optimism. However, before opportunities can be realized, they first need to be discovered. The focus of this paper is on the latter rather than the former aspect. That is, we provide sev-eral arguments for why individuals’ differences in terms of education play an important role in explaining the discovery of new ideas.
First, there is a network argument that relates education to opportunity recognition. Whereas prior research has often focused on how access to resources is important after opportunities for business creation have been recognized (Steven-son and Jarillo, 1990), we argue that opportuni-ties are recognized by some individuals and not by others based on their differential access to resources. More specifically, we reason that indi-viduals’ education may enhance opportunity rec-ognition through the facilitation of access to knowledge, e.g., connections to other ‘‘knowl-edgeable’’ others such as alumni network con-tacts (Cohen and Levinthal, 1990; Burt, 1992). Therefore, one important role of human capital played in stimulating entrepreneurship pertains to one’s access to information necessary to dis-cover opportunities in the market place.
Second, we argue that individuals’ educational level will positively affect the likelihood to per-ceive opportunities because highly-educated indi-viduals have a broader knowledge base to draw from and thus a higher likelihood that they can relate this knowledge to potential entrepreneurial opportunities (Cohen and Levinthal, 1990). Although one could argue that in some cases an expanded knowledge base may lead to market myopia and a difficulty to ‘‘unlearn’’ existing behavior (Prahalad and Bettis, 1986), we reason that education may provide knowledge that is complementary with new information included in entrepreneurial opportunities, and therefore enhance opportunity recognition. Shane and Venkataraman (2000) already emphasized the importance of one’s knowledge base in the opportunity recognition process. More
specifi-cally, they reasoned that individuals’ prior knowledge strongly contributes to their ability to recognize opportunities in that such knowledge creates mental schemas from which new informa-tion can be recognized and processed (Shane and Venkataraman, 2000). Therefore, since individu-als do not possess the same knowledge, they will differ in their ability to recognize the potential of opportunities. Furthermore, a related argument for why individuals’ educational credentials may increase the discovery of opportunities is that highly-educated individuals have more self-confi-dence to possess the capabilities to come up with good ideas for new venture creation (Bandura, 1978).
Based on the arguments given above, we con-tend that there is a positive relationship between individuals’ educational level and the likelihood to perceive opportunities.
Hypothesis 2: Individuals with higher educa-tional levels are more likely to recognize oppor-tunities compared to individuals with lower educational levels.
2.2.2. Work status
The reasoning for the relationship between indi-viduals’ work status and opportunity recognition is similar to the one given above for education. We hypothesize that someone’s work status posi-tively affects the likelihood to be exposed to a wider set of knowledge, and thus, to perceive opportunities for business creation. We define work status in terms of whether the individual plays an active versus passive role in the labor market; an active role could include one’s partici-pation in the work force as employee or employer, whereas a passive status may include unemployment. We reason that people with an active work status will have more opportunities to develop valuable contacts, compared to people who are ‘‘outside’’ the working system (Burt, 1992). First, the work place may form a natural environment for opportunity recognition, since this environment allows people to spot new opportunities in their own or contiguous indus-tries. Furthermore, the work place constitutes a setting conducive to building network contacts based on professionally oriented relationships (Nahapiet and Ghoshal, 1998). Individuals who
are not part of the active economic system will be less likely to build such network contacts. Therefore, we hypothesize that individuals who have an active work status will be more likely to perceive opportunities compared to others who are not part of the working system.
Hypothesis 3: Individuals with an active work sta-tus are more likely to recognize opportunities com-pared to individuals with a passive work status.
3. Methodology
3.1. Sample
Our analyses are undertaken on a representative sample of the adult population in two countries, Belgium and Finland. Our unit of analysis per-tains to the individual level, and we used data collected as part of the 2002 Global Entrepre-neurship Monitor (GEM) study. We collected data in Belgium and Finland with telephone interviews during the Summer of 2002 using a standardized questionnaire translated from Eng-lish into the native language(s) of each country (i.e., Dutch and French for Belgium; Finnish for Finland). A representative sample of the adult population was surveyed (for Belgium N¼ 4057 and for Finland N¼ 2005). In this paper, we focus on those respondents who are members of the labor force (i.e., those between 18 and 64-years-old at the time of the interview). This led to a total number of 3102 eligible responses in Belgium and 1434 in Finland. In order to assure that the respondents correctly reflected the popu-lation from which they were drawn, GEM assigns each respondent a weighting factor that takes into account gender and age. More specifi-cally, the age and gender distribution of the sam-ples were compared to the U.S. Census International Database 2002 and weights were calculated in order to match our sample to this standardized source of population structure esti-mates. Further, the weights were also adjusted according to the country to which the respondent belonged, i.e., the weights were normalized among the Belgian and Finnish respondents respectively. More information about the GEM study and its methodology will be provided in Reynolds et al. (2005).
3.2. Measures
In the following paragraphs, we explain how we operationalized the different variables. A short description of the variables and their measure-ment is also given in the Appendix.
3.2.1. Dependent variable
Opportunity recognition: We asked the respon-dents whether ‘‘in the next six months there would be good opportunities for starting a busi-ness in the area where they lived.’’ This measure is a binary variable (1¼ Yes, 0 ¼ No).
3.2.2. Predictor variables
Nature of residential area: In this paper we use the ‘‘nature of the residential area’’ to which the individual belongs as a proxy for the network cohesion variable. Our measure of residential area has three categories: (1) ‘‘rural location’’, (2) ‘‘urban location’’, and (3) ‘‘big agglomerate’’. The allocation of the respondents to these three categories was based on the population charac-teristics of the locations where the respondents reside.1
We associate the category ‘‘rural location’’ with areas likely characterized by high network cohesiveness whereas the category ‘‘big agglomer-ates’’ reflects areas with low network cohesive-ness (Niebuhr and Stiller, 2003). On one hand, we assume that rural areas are more likely to be characterized by networks with strong relation-ships and less structural holes among their resi-dents. The reasoning is that the residents of rural areas are more likely to have lived in their cur-rent area for a longer period of time, so there is more potential for close relationships to have developed over time. Furthermore, since the pop-ulation density in rural areas is lower than in agglomerate areas and (to a lesser extent) urban areas, it is less likely that the network in which rural residents are embedded allows for the bridging of structural holes. On the other hand, big agglomerates are more likely to be character-ized by networks with weak relationships and more structural holes among their residents. Since the population size and density is high in these areas, residents are more likely to have indirect contacts with one another through third parties, and thus they are more likely to be
embedded in networks with loose ties and struc-tural holes. In short, agglomerate areas may be more likely to have extensive networks of ‘‘loose’’ contacts among their residents and thus their networks are characterized by a lower level of network cohesion.2
Education: The respondents were assigned to three categories in terms of their educational level: (1) some secondary education, (2) second-ary degree, and (3) post-secondsecond-ary degree. In the regression analyses (see further) we entered the variables as binary variables with the third cate-gory being used as the base case.
Work status: Work status was coded as a bin-ary variable. A value of ‘‘1’’ was assigned to respondents with an ‘‘active’’ work status (i.e., employed on a full-time or part-time basis), and a value of ‘‘0’’ to respondents with a ‘‘passive’’ working status (i.e., unemployed, student, retired, or disabled).
3.2.3. Control variables
We also included three control variables in order to check whether our hypothesized predictor variables affect the level of opportunity recogni-tion beyond the impact of these controls. Age was measured as a continuous variable (ranging between 18 and 64). Gender is a binary variable: male respondents were assigned a value of ‘‘0’’, and female respondents a value of ‘‘1’’. Finally, in the analysis on the whole sample (i.e., Belgium and Finland, see further) we included a binary variable to control for the country in which the respondent resided (‘‘0’’ for Belgium and ‘‘1’’ for Finland).
3.3. Data analysis
We formally tested our hypotheses using binomi-nal logistic regression models. The binomibinomi-nal logistic regression estimates the probability of an event happening which, in our case, is the pres-ence or abspres-ence of opportunity recognition. Since our dependent variable is discrete, we could have used an ordinary least squares regression to fit a linear probability model. However a linear prob-ability model is heteroskedastic and may predict probability values beyond the (0,1) range (Stynes and Peterson, 1984; Greene, 1997).
In order to test our hypotheses, we ran two binominal logistic regression models on the
different samples. Whereas Model 1 includes only the control variables, Model 2 contains the pre-dictor variables along with the control variables. In assessing the overall adequacy of the model and the significance of the individual variables, we used the instructions of Hosmer and Leme-show (2000). We assessed the goodness of fit of the models using the Model v2test. The Model v2 is the difference between the )2LL (minus two times the log likelihood of the model) of the fit-ted model and the )2LL of the null hypothesis model. We further report the Nagelkerke-statistic, which indicates the variance explained by our models, as well as the overall rate of correct clas-sification of the models. In order to test whether the addition of the predictor variables led to a significant improvement of the model, we exam-ined the Block v2test. The Block v2 is the differ-ence between the)2LL (minus two times the log likelihood of the model) of the full model and the)2LL of the control model.
In order to test the significance of the individ-ual regression coefficients, we used the Wald test. In order to make the interpretation of the results easier, we also report the odds ratio [i.e., Exp(b)] for each of the predictor variables. The odds ratio is the exponent of the regression coefficient. For binary variables, it approximates how much more likely (or unlikely) it is for the outcome (i.e., opportunity recognition) to be present among those respondents with a predictor value equal to one compared to respondents with a predictor value equal to zero. For example, in the case of ‘‘gender’’ as predictor variable
(0¼ male, 1 ¼ female), a value of Exp(b) ¼ 0.50 would mean that women are half as likely to per-ceive opportunities compared to men.
We ran three sets of binomial logistic regres-sion analyses, one for the pooled data (i.e., Belgium and Finland, Table II), and one for each of the countries separately (Tables III and IV). Preliminary examination of the data had indi-cated that the overall level of opportunity percep-tion was much higher in Finland compared to Belgium. In Finland, 51.2% of all respondents perceived good opportunities to start a business, compared to only 16.7% in Belgium (F¼ 914.52, d.f.¼ 3584, P< 0.001) Therefore, we also wanted to test whether our findings were consis-tent between ‘‘high-opportunity’’ versus ‘‘low-opportunity’’ countries. Furthermore, preliminary cross-tabulation analyses indicated that the dif-ferences in opportunity recognition were signifi-cant across regions in Finland but not in Belgium. Therefore, the country-specific analyses (Tables III and IV) could indicate to what extent country-related differences may influence the rela-tionship between residential areas and opportu-nity recognition. In the analyses on the pooled data, we included a ‘‘country’’ dummy variable to control for country effects (Table II).
4. Results
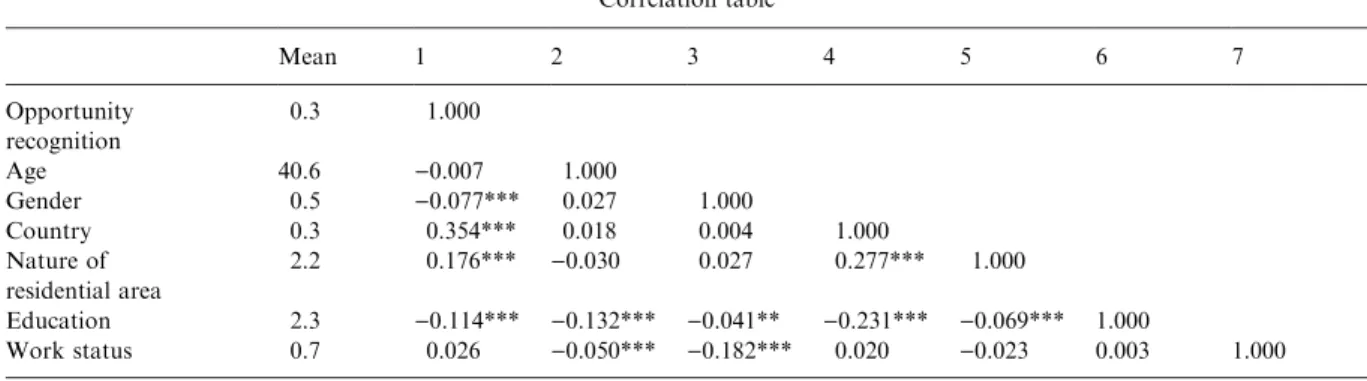
Table I reports the descriptive statistics of the variables and the results of the correlation analy-sis. It can be seen that our average respondent is 41 years and has a secondary or above secondary
Table I Correlation table Mean 1 2 3 4 5 6 7 Opportunity recognition 0.3 1.000 Age 40.6 )0.007 1.000 Gender 0.5 )0.077*** 0.027 1.000 Country 0.3 0.354*** 0.018 0.004 1.000 Nature of residential area 2.2 0.176*** )0.030 0.027 0.277*** 1.000 Education 2.3 )0.114*** )0.132*** )0.041** )0.231*** )0.069*** 1.000 Work status 0.7 0.026 )0.050*** )0.182*** 0.020 )0.023 0.003 1.000 * significant at P£ 0.05. ** significant at P£ 0.01. *** significant at P£ 0.001.
level educational level. Further, women and men are equally represented in our sample.
As mentioned above, the results for the pooled sample are presented in Table II, the results for Belgium and Finland in Tables III and IV respec-tively. For each predictor variable, we report the maximum likelihood estimates (b), the
signifi-cance of the estimate, the estimates of the stan-dard errors of the estimated coefficients (in parentheses), the Wald statistic, and the odds ratio [Exp(b)]. Since the focus of the paper was not on the examination of country effects, we primarily used the results from the pooled sample to test our hypotheses.
Table II
Results of the logistic regression analyses (dependent variable: opportunity recognition) (pooled sample) Variables Variable
categories
Model 1 Model 2
Coefficient b S.E.
Wald Exp(b) Coefficient b S.E. Wald Exp(b) Age )0.002 (0.004) 0.431 0.998 0.001 (0.004) 0.046 0.999 Gender (0 = Male, 1 = Female) )0.327*** (0.093) 12.260 0.721 )0.375*** (0.096) 15.146 0.687 Country (0 = Belgium, 1 = Finland) 1.603*** (0.092) 295.804 4.968 1.483*** (0.099) 225.616 4.406 Nature of residential area Big agglomerate (base case) 15.749 1.000 Urban location )0.375** (0.123) 9.244 0.687 Rural location )0.390*** (0.113) 11.946 0.677
Education Post secondary (base case) 20.676 1.000 Secondary degree )0.463*** (0.104) 19.749 0.629 Some secondary )0.348* (0.151) 5.300 0.706 Work status )0.122 (0.105) 1.338 0.885 Constant )2.626*** (0.241) 119.070 0.072 )1.809*** (0.333) 29.536 0.164 Model v2 [d.f.] 322.264 *** [3] 363.585 *** [8] Block v2 [d.f.] 41.321 *** [5] Nagelkerke R2 0.167 0.187 % correct predictions 70.5 73.3 * significant at P£ 0.05. ** significant at P£ 0.01. *** significant at P£ 0.001. ysignificant at P£ 0.10.
4.1. Pooled sample
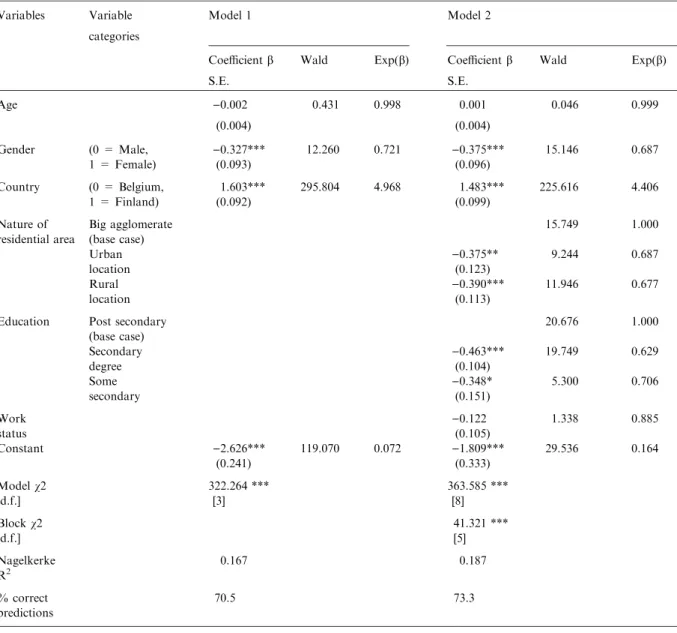
From Table II it can be seen that Model 2, including both the control and predictor variables, is significant at the 0.001 level (Model v2¼ 363.585, P < 0.001) and that it predicts 73.3% of the responses correctly. The significance of the Block v2indicates that the inclusion of the predictor variables in Model 2 leads to a signifi-cant improvement of the model compared to Model 1 (Block v2¼ 41.321, P < 0.001).
Furthermore, we found that the relationship between the nature of residential area and the perception of opportunities is significant (Model 2). More specifically, individuals living in big agglomerates are more likely to perceive opportu-nities compared to those living in urban areas (b¼)0.375, P < 0.01) and those living in rural areas (b¼)0.390, P < 0.001). In other words, we find support for Hypothesis 1a (i.e., ‘‘network cohesiveness is negatively related to opportunity
Table III
Results of the logistic regression analyses (Dependent variable: Opportunity recognition) (Belgium) Variables Variable
categories
Model 1 Model 2
Coefficient b S.E.
Wald Exp(b) Coefficient b S.E. Wald Exp(b) Age )0.015** (0.005) 7.922 0.985 )0.014** (0.005) 6.755 0.986 Gender (0 = Male, 1 = Female) )0.911*** (0.139) 43.055 0.402 )0.879*** (0.143) 37.948 0.415 Nature of residential area Big agglomerate (base case) 3.517 1.000 Urban location )0.348y (0.186) 3.515 0.706 Rural location )0.120 (0.148) 0.655 0.887 Education Post-secondary (base case) 12.321 1.000 Secondary degree )0.466*** (0.140) 11.071 0.627 Some secondary )0.574y (0.301) 3.631 0.563 Work status )0.016 (0.155) 0.011 0.984 Constant 0.282 (0.289) 0.953 0.627 (0.444) 1.987 1.871 Model v2 [d.f.] 53.418*** [2] 70.425*** [7] Block v2 [d.f.] 17.007** [5] Nagelkerke R2 0.052 0.068 % correct predictions 83.2 83.2 * significant at P£ 0.05. ** significant at P£ 0.01. *** significant at P£ 0.001. ysignificant at P£ 0.10
recognition’’) rather than the competing Hypoth-esis 1b.
Hypothesis 2 stated that people with higher educational levels are more likely to recognize opportunities than people with lower educational levels. The findings from the pooled sample sup-port this hypothesis. Individuals with a post-sec-ondary degree are more likely to perceive entrepreneurial opportunities compared to those
with a secondary degree (b¼)0.463, P < 0.001) and those with some secondary education (b¼)0.348, P < 0.05).
Hypothesis 3 stated that people with an active work status are more likely to recognize opportu-nities compared to people with a passive work status. We find no support for this hypothesis. The coefficient of the work status variable is insignificant (b¼)0.122, P < 0.10).
Table IV
Results of the logistic regression analyses (Dependent variable: Opportunity recognition) (Finland) Variables Variable
categories
Model 1 Model 2
Coefficient b S.E.
Wald Exp(b) Coefficient b S.E. Wald Exp(b) Age 0.009y (0.005) 3.028 1.009 0.012* (0.005) 5.251 1.102 Gender (0 = Male, 1 = Female) 0.235y (0.133) 3.133 1.265 0.132 (0.139) 0.895 1.141 Nature of residential area Big agglomerate (base case) 22.502 1.000 Urban location )0.388* (0.172) 5.088 0.679 Rural location )0.842*** (0.183) 21.247 0.431 Education Post-secondary (base case) 4.046 1.000 Secondary degree )0.312y (0.162) 3.688 0.732 Some secondary )0.233 (0.190) 1.508 0.792 Work status )0.317* (0.152) 4.368 0.728 Constant )0.716* (0.293) 5.954 0.489 0.215 (0.417) 0.266 1.240 Model v2 [d.f.] 6.222* [2] 41.307*** [7] Block v2 [d.f.] 35.084*** [5] Nagelkerke R2 0.009 0.059 % correct predictions 52.4 59.3 *significant at P£ 0.05. ** significant at P£ 0.01. *** significant at P£ 0.001. ysignificant at P£ 0.10.
In terms of the control variables, we found a gender effect but no age effect (Model 1, Table II). That is, men are more likely than women to per-ceive opportunities (b¼)0.327, P < 0.001). Fur-thermore, as expected, we found a strong country effect: individuals living in Finland are more likely to perceive opportunities compared to their coun-terparts in Belgium (b¼)1.603, P < 0.001). 4.2. Country level analysis
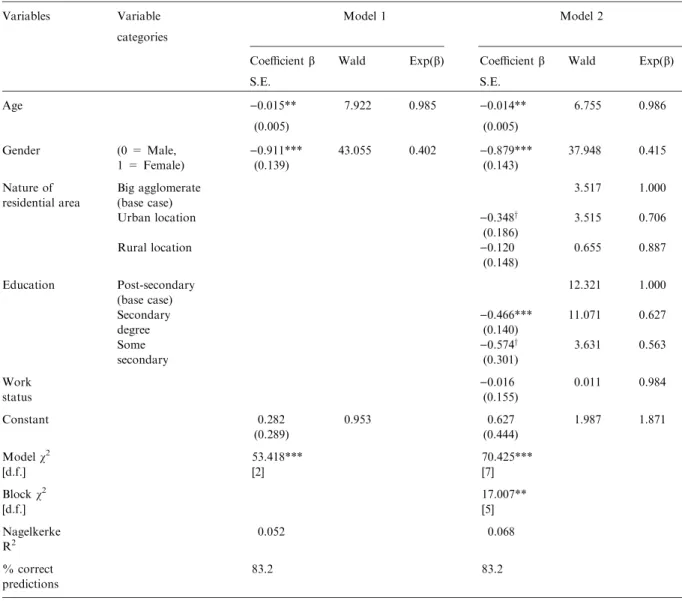
Table III reports the results of the logistic regres-sion analysis on the Belgian data. The Model v2 shows that Model 2, which contains both the predictor and control variables, is significant at the 0.001 level (Model v2¼ 70.452, P < 0.001) and predicts 83.2% of the responses correctly. Based on the Block v2, we conclude that the
inclusion of the predictor variables leads to a sig-nificant improvement of the model (Block v2¼ 17.007, P < 0.01).
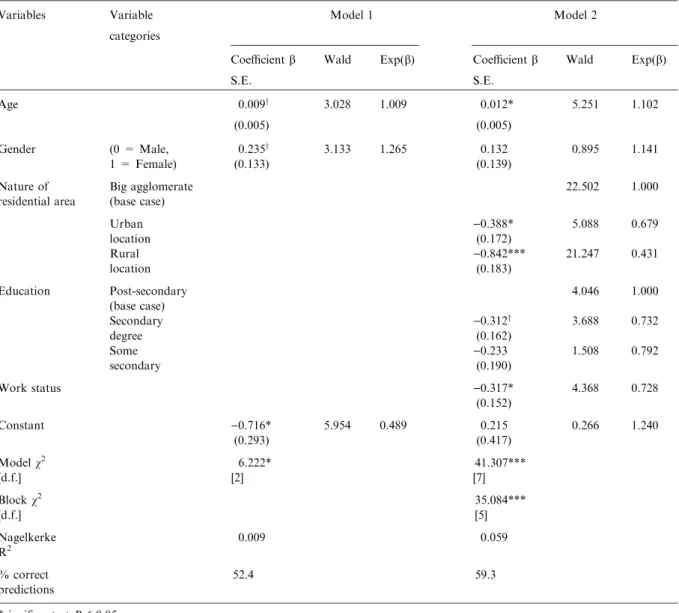
Table IV reports the results of the logistic regression analysis on the Finnish data. The Model v2shows that Model 2 is significant at the 0.001 level (Model v2¼ 41.307, P < 0.001) and predicts 59.3% of the responses correctly. Based on the Block v2, we can also conclude that the inclusion of the predictor variables leads to a sig-nificant improvement on the model (Block v2¼ 35.084, P < 0.001).
In terms of the role of the nature of residential area (i.e., our proxy for network cohesiveness), we found only a weak effect on the perception of opportunities (Model 2, Table III) for the Bel-gian data. Individuals living in an urban area are somewhat less likely to perceive opportunities compared to those living in a big agglomerate, but this finding is only weakly significant (b¼)0.348, P < 0.10). Surprisingly, whether one lives in a rural area or big agglomerate in Belgium does not make a difference with respect to the perception of opportunities (b¼)0.120, P< 0.10). In contrast, for Finland we found a strong relationship between the nature of the res-idential area an individual belongs to and his or her perception of opportunities (Model 2, Table IV). Individuals living in an urban area are significantly less likely to perceive opportunities than those living in a big agglomerate (b¼)0.388, P < 0.05), and individuals living in
a rural area are significantly less likely to per-ceive opportunities compared to those living in a big agglomerate (b¼)0.842, P < 0.001).
In terms of the role of education, the results are also somewhat different between Belgium and Finland. In Belgium, individuals with a second-ary degree are significantly less likely to perceive opportunities compared to those having a post-secondary degree (b¼)0.466, P< 0.001) (Model 2, Table III). Furthermore, individuals with only some secondary education are also less likely to perceive opportunities compared to those with a post-secondary degree, but this dif-ference is only weakly significant (b¼)0.574, P< 0.10). For Finland, the relationship between education and opportunity perception is weaker than for Belgium (Model 2, Table IV). Individu-als with a secondary degree are less likely to per-ceive opportunities compared to those having a post-secondary degree, but this result is only weakly significant (b¼)0.312, P < 0.10). We find no significant difference between those hav-ing only some secondary education and those holding a post secondary degree in terms of opportunity recognition.
In terms of the role of work status, the results for the Belgian sample are consistent with the pooled sample. That is, there is no relationship between individuals having an active versus pas-sive work status and their likelihood to perceive opportunities (b¼)0.016, P > 0.10) (Model 2, Table III). However, in Finland we find a sur-prisingly negative effect for work status: individu-als with an active work status are less likely to perceive opportunities compared to those with a passive work status (b¼)0.317, P < 0.05).
Finally, in terms of the control variables, we find that in Belgium, both age and gender are significant predictors for opportunity recognition (Model 1, Table III). That is, older respondents are less likely to perceive opportunities compared to their younger counterparts (b¼)0.015, P< 0.01), and women are less likely than men to perceive opportunities (b¼)0.911, P < 0.001). For Finland, we find only very weak effects for the control variables, and in the opposite direc-tion compared to Belgium (Model 1, Table IV). More specifically, older respondents are some-what more likely to perceive opportunities com-pared to younger ones (b¼ 0.009, P < 0.10).
Interestingly, in Finland women are somewhat more likely to perceive opportunities compared to men (b¼ 0.235, P < 0.10).
5. Discussion
In this study, we adopted a network-based approach in examining why some individuals are more likely to perceive opportunities aimed at business creation compared to others. That is, we intended to contribute to the entrepreneurship lit-erature by applying a network view to study entrepreneurial opportunity recognition. We explained the rationale for and empirically exam-ined why networks are important in terms of individuals’ recognition of opportunities. We focused on two aspects of individuals’ embedded-ness in networks, that is, (1) individuals’ belong-ing to residential areas that are more or less likely to be characterized by network cohesion, and (2) individuals’ differential access to network contacts based on the level of human capital they hold. Whereas the first aspect pertains to the type of regional network one belongs to, the second aspect pertains more generally to the extent to which individuals are potentially exposed to net-work contacts. In terms of the role of netnet-work cohesiveness, our results suggest that individuals who reside in big agglomerates are more likely to perceive opportunities compared to their counter-parts in rural areas (and this effect was much stronger in Finland compared to Belgium). In terms of the role of human capital, our results suggest that individuals’ educational level, but not their work status, positively affects the likeli-hood to perceive opportunities. In the following paragraphs, we give some further discussion on our findings.
5.1. Effect of network cohesion
Before we discuss the findings pertaining to the role of network cohesion, we want to re-iterate how we operationalized this variable. In this paper we related network cohesiveness to the ‘‘nature of residential area’’, i.e., we associated the category ‘‘rural location’’ with areas high in network cohesiveness, the category ‘‘big agglom-erates’’ with areas low in network cohesiveness, and the category ‘‘urban areas’’ as an
intermedi-ate cintermedi-ategory (Niebuhr and Stiller, 2003). We real-ize that this operationalization of ‘‘network cohesiveness’’ is rather crude and open to discus-sion. For instance, as indicated in the literature, there are examples of agglomerations that are characterized by myopia and cohesiveness, which may explain why some agglomerations have shown a decline over time, such as the Ruhr Val-ley (Grabher, 1993). The results pertaining to the ‘‘network cohesion’’ construct therefore warrant extreme caution in their interpretation. That is, our findings should be interpreted more in terms of ‘‘how regional areas that differ in terms of their population structure make it more or less likely that their residents have access to new information’’ rather than in terms of ‘‘how very specific network structures (e.g., in terms of the number of structural holes or the absolute level of cohesiveness) affect opportunity recognition.’’
Despite the weakness of our measure, our finding that individuals residing in big agglomer-ate areas are more likely to perceive opportuni-ties compared to individuals residing in rural and (to a lesser extent) urban areas may provide some tentative support to Granovetter’s (1973) reason-ing that ‘‘weak ties’’ can function as ‘‘bridges’’ to knowledge that are not included in someone’s personal network of contacts. More specifically, in regional settings where it is more likely that new information will be provided through one’s network (e.g., because of the higher number of possible contacts or the higher ‘‘in-stream’’ of new contacts), there may be more potential to perceive entrepreneurial opportunities (Niebuhr and Stiller, 2003). Furthermore, our findings in terms of the effect of ‘‘the nature of residential area’’ may also give some very tentative support to Burt’s (1992) research on ‘‘structural holes’’. In short, despite the apparent weaknesses of our ‘‘cohesiveness’’ measure, our results could suggest that individuals who live in ‘‘big city areas’’ may have more possibility to broker information through their indirect network contacts, which may give them an advantage then in terms of their ability to perceive opportunities compared to individuals living in rural areas. Obviously, there may also be additional reasons why individ-uals in big agglomerations are more likely to perceive opportunities; for instance, the presence of various organizations (universities, research
facilities, service providers) in more densely pop-ulated areas may provide more possibilities to discover and exchange new information.
We would also like to emphasize that our results in terms of the effect of the nature of resi-dential area are particularly strong for Finland and not for Belgium. In other words, the varia-tion in opportunity recognivaria-tion due to the effect of residential area that we found for our total sample (Table II) seems to be driven by the Finn-ish (Table IV) rather than the Belgian (Table III) respondents. A possible explanation for the dif-ferential effect of residential area between Bel-gium and Finland may lie in the fact that Belgium is a country which is much more homogenous in terms of its regional structure compared to Finland where the differences between regions have been increasing (see foot-note 3). More generally speaking, our findings suggest that countries in which there are bigger differences between ‘‘agglomerate’’ versus ‘‘rural’’ areas may show higher within-border differences in terms of how easy individuals can get access to new information and opportunities.
5.2. Effect of human capital
Overall, we found a positive relationship between someone’s educational level and the likelihood to recognize opportunities, and this relationship was stronger for Belgium compared to Finland. More specifically, we found that individuals who have a post-secondary degree are more likely to per-ceive opportunities compared to those who have a lower educational degree. We provided several arguments to explain the positive effect of educa-tion, such as the increased exposure to ‘‘knowl-edgeable others’’ through networks such as alumni organizations (Burt, 1992), the broader knowledge base to draw from and thus the higher likelihood to relate current knowledge to potential entrepreneurial opportunities (Cohen and Levinthal, 1990), and the increased self-con-fidence to have the skills to successfully come up with new ideas for business creation (Bandura, 1978).
Further, our findings showed that someone’s work status does not play an important role in the perception of entrepreneurial opportunities. We had argued that individuals’ active
participa-tion in the economic system (i.e., by being employed rather than being without occupation) may offer the potential to recognize opportunities which are related to one’s current business activi-ties. Also, we reasoned that the work place may function as an environment conducive to the development of network contacts with others. One explanation for the lack of an effect of our ‘‘work status’’ variable on opportunity recogni-tion may be that the work environment may be only one of the potential sources of information relevant for start-up activities. That is, most ple have many personal contacts with other peo-ple through a combination of professional as well as more informal (friends- or family-related) rela-tionships (Burt, 1992; Davidsson and Honig, 2003). Furthermore, we used a rather crude proxy for determining the working experience of our respondents, i.e., being employed (full-time or part-time) versus being unemployed, student, retired or disabled at a given point in time. The work status of an individual – i.e., whether one works or not – is perhaps not as good an indica-tor for one’s propensity to recognize opportuni-ties as his or her specific professional experiences. Future research could thus include a wider range of possible environments (besides the immediate work environment) to which individuals belong and assess the influence of different types of experience (e.g., industry-specific experience, prior experience as entrepreneur) on opportunity recognition.
Finally, it is also interesting to look at the results for our control variables. Interestingly, the regression analysis with the controls for the pooled sample (Model 1, Table II) showed no sig-nificant difference between younger and older respondents in terms of the likelihood to recog-nize opportunities. However, we found that in Belgium younger individuals are more likely to perceive opportunities compared to their older counterparts; one speculative explanation for this finding could be that older employees in Belgium are not encouraged to think ‘‘out of the box’’, and thus are less inclined to perceive opportuni-ties for new business creation. Furthermore, we found that, for the pooled sample, males are more likely than females to be opportunity-minded (Model 1, Table II). This finding is consistent with Crosa et al.’s (2002) finding that gender
affects the likelihood of business formation. Our results confirm that, especially in Belgium, there may be a huge untapped potential among women in terms of opportunity recognition for start-ups. There are no objective reasons as to why women would be less able than men to recognize entre-preneurial opportunities. Perhaps cultural factors may explain why women are less ‘‘opportunity-minded’’ than men in some countries.
5.3. Limitations, future research and implications As mentioned earlier, an important weakness of this study lies in how we related different levels of network cohesiveness to different types of resi-dential areas. Nevertheless, at a minimum level, we have shown that where a person lives does influence the likelihood that one perceives oppor-tunities. It is clear that future research would highly benefit from more fine-grained measures of regional network characteristics and network-ing opportunities. For instance, regional varia-tion in network density and diversity are both likely to be related to individual-level differences in opportunity recognition (Dubini, 1989; Hug-gins, 2000). Also, in our study we did not take into account that regions of the same population size (e.g., big agglomerates) may vary greatly in terms of industrial and occupational structure. Future research could examine to what extent the spatial division of labor – whereby different kinds of work and different kinds of workers are located in different places – affects the level of opportunity recognition in a region (Massey, 1995).
Further, prior research has argued that per-sonality differences, e.g., whether an individual is an extrovert or an introvert, affects the extent of one’s network, one’s reliance on the current set of contacts and the tendency to extend that net-work in times of need or crisis (Malecki and Poehling, 1999). One could thus expect that personality differences would also influence the likelihood of perceiving entrepreneurial opportu-nities. In this paper, we focused more on the effect of knowledge-related factors on opportu-nity recognition. Future research would benefit from combining knowledge and personality related factors to study individual opportunity recognition.
Finally, an interesting result of our study was that the Finnish respondents were much more likely to perceive opportunities compared to their Belgian counterparts. This suggests that there are country-specific factors influencing the perception of entrepreneurial opportunities. Future researchers should compare the drivers for opportunity recognition across a wider vari-ety of countries and cultures than the ones included in this study. This could allow to examine whether cultural factors (e.g., accep-tance of uncertainty, social norms) or other fac-tors (e.g., distribution of population density, immigration patterns) affect the extent to which a country’s citizens recognize opportunities to start new businesses.
From a practical point of view, our findings suggest that the extent to which individuals per-ceive opportunities depends on the nature of the residential area to which they belong. Most decisions to start a new venture are quite com-plex and ask for the access to information from more than a single source. Consequently, indi-viduals who plan to engage in start-up activity need to pool information from a variety of sources. While few persons may be able to search for this information on their own, it is often more expedient to get the information from knowledgeable others (Davidsson and Honig, 2003). Our results gave some indication that information useful for opportunity recogni-tion may be more easily obtained when one resides in a big agglomerate rather than rural area. One potential explanation for the differ-ence between residential areas in terms of the ease with which residents recognize opportuni-ties may be that these areas differ in terms of the channels used to communicate information across individuals. At a general level, public policy aimed at stimulating entrepreneurial activity may need to pay more attention to how different parties, interested in or knowledgeable about entrepreneurship, should be brought together. Although we do not suggest that pub-lic authorities should play an interventional role in such a private sphere as individuals’ personal networks, government could play a role in creating a general environment that stimulates information exchange among individuals inter-ested in entrepreneurial activity.
Acknowledgement
The authors would like to thank Edward Male-cki and the two anonymous reviewers for their valuable comments. Pia Arenius gratefully acknowledges financial support from the Minis-try of Trade and IndusMinis-try Finland, Tekes and the Academy of Finland (Grant number 207424). Dirk De Clercq gratefully acknowledges financial support from the Ministries of Economic Affairs in Flanders and Wallonia.
Notes
1
For Belgium, the allocation occurred based on the population size at the locality level (i.e., ZIP code). Rural areas include localities with less than 25,000 inhabitants, big agglomerates include the five main agglomerations (i.e., with at least 200,000 inhabitants), and the urban areas represent the intermediate category (i.e., between 25,000 and 200,000 inhabitants). For Finland, the alloca-tion occurred at the regional level, i.e., based on the pro-portion of the population living in urban settlements and the population of the largest locality in the region. Rural areas are (a) regions in which less than 60% of the lation lives in urban settlements, and in which the popu-lation of the largest urban settlement is less than 15,000, as well as (b) regions in which at least 60% but less than 90% of the population lives in urban settlements, and in
which the population of the largest urban settlement is less than 4000. Urban regions are regions in which at least 60% but less than 90% of the population lives in urban settlements, and in which the population of the largest urban settlement is at least 4000 but less than 15,000. Big agglomerates are regions in which at least 90% of the population lives in urban settlements, or in which the population of the largest urban settlement is at least 15,000.
2
Although the focus of recent European policy has been on the decrease of economic and social differences across regions in Europe (Stewart, 2002), there are indi-cations that European regions often still differ in terms of important characteristics (Niebuhr and Stiller, 2003). For Belgium, the research focus has often been on the struc-tural differences between the Flemish and the Walloon region in terms of their employment structure and overall economic prosperity (D’Addio and Nicaise, 2003). Fur-thermore, attention has been given to the case of the Brussels agglomeration in comparison with Flanders and Wallonia, e.g., in terms of its unemployment rate (Mar-age and Meulders, 2001). Compared to Belgium, the dif-ferences between regions in Finland are even more outspoken. More specifically, in Finland the recovery from the recession of the early 1990s has increased the regional differences (Valtioneuvosto, 2000). For example, between 1992 and 1997 the total output grew by 40% in the capital region, against a national average of 30%. Outside the university cities and particularly in the rural areas, the output rose only by 20%. In big agglomerates the level of employment reached the pre-recession level already in 1998. However, in the rural and in most of the Appendix: Below a description is given of the variables included in this study. The first column gives the name of the variable. The second column describes the variable. All variables have been collected through a phone survey.
Variable Description
Opportunity recognition Response to the question: ‘‘In the next six months there will be good opportunities for starting a business in the area where you live’’ 1 = Yes, 0 = No
Age Age of the respondent
Gender Binary variable describing the respondent’s age: 0 = Male 1 = Female Country Binary variable describing the respondent’s country: 0 =Belgium 1 = Finland Nature of residential area Categorical variable describing the nature of the respondent’s residential area:a
1 = Rural location 2 = Urban location 3 = Big agglomerate (used as base in regressions)
Education Categorical variable describing the respondent’s educational level:a1 = Some secondary education 2 = Secondary degree 3 = Post-secondary degree (used as base case in regressions)
Work status Binary variable describing the respondent’s work status: 0 = Student, homemaker, retired, or disabled 1 = Full or part-time employed
a
The values ‘‘1’’ to ‘‘3’’ were assigned to the categories in order to calculate the variable means (Table 1). In the regressions, the categories ‘‘1’’ and ‘‘2’’ were entered as binary variables and compared to the base category ‘‘3’’.
urban areas the level of employment is still 15% short of the pre-recession level. Furthermore, the concentration of production and jobs has spurred migration, which has led to a differentiation in population structure. In big agglomerates, people are young and well-educated. In urban areas the population structure tends to be slightly weaker. Worst-off are the rural areas, in which the people tend to be older and poorly educated.
References
Aldrich, H. and C. Zimmer, 1986, ‘Entrepreneurship through Social Networks’, in D. Sexton and R. Smilor (eds.), The Art and Science of Entrepreneurship, Cam-bridge, MA: Ballinger Publishing, pp. 3–23.
Aldrich, H., B. Rosen and W. Woodward, 1987, ‘The Impact of Social Networks on Business Foundings and Profit: A Longitudinal Study’, in J. Churchill et al. (eds.), Frontiers in Entrepreneurship Research, Welles-ley, MA: Babson College, pp. 154–168.
Bandura, A. 1978, ‘Reflections on Self-efficacy’, Advances in Behavioral Research and Therapy 1, 237–269. Barnes, J., 1972, Social Networks, Philippines:
Addison-Wesley.
Bates, T., 1995, ‘Self-Employment Entry Across Industry Groups’, Journal of Business Venturing 10, 143–156. Bates, T., 1997, ‘Financing Small Business Creation: The
Case of Chinese and Korean Immigrant Entrepre-neurs’, Journal of Business Venturing 12, 109–124. Bates, T. and L. Servon, 2000, ‘Viewing Self-Employment
As a Response to Lack of Suitable Opportunities for Wage Work’, National Journal of Sociology 12, 23–55. Becker, G. S., 1964, Human Capital, Chicago: U. of
Chi-cago Press.
Birley, S. 1985, ‘The Role of Networks in the Entrepre-neurial Process’, Journal of Business Venturing 1(1), 107–117.
Burt, R., 1986, ‘A Cautionary Note’, Social Networks 8, 205–211.
Burt, R., 1992, ‘Structural Holes: The Social Structure of Competition’: Cambridge Harvard University Press. Christensen, P. S. and R. Peterson, 1990, ‘Opportunity
Identification: Mapping the Sources of New Venture Ideas’, Frontiers of Entrepreneurship Research, Welles-ley, MA: Babson College, 567–581.
Cohen, W. M. and D. A. Levinthal, 1990, ‘Absorptive Capacity: A New Perspective on Learning and Innova-tion’, Administrative Science Quarterly 35, 128–152. Coleman, J. S., 1988, ‘Social Capital in the Creation of
Human Capital’, American Journal of Sociology 94 (Special Supplement), 95–120.
Coleman, J. S., 1990, Foundations of Social Theory, Cambridge: The Belknap Press of Harvard University Press, MA.
Crosa, B., H. E. Aldrich and L. Keister, 2002, ‘Is There a Wealth Affect? Financial and Human Capital as Determinants of Business Startups’, Frontiers of
Entrepreneurship Research, Wellesley, MA: Babson College.
D’Addio, A. C. and I. Nicaise, 2003, ‘Regional Differ-ences in Belgium: A Point of View’, Working Paper, European Union, Employment Observatory.
Davidsson, P. and B. Honig, 2003, ‘The Role of Social and Human Capital among Nascent Entrepreneurs’, Journal of Business Venturing 18, 301–331.
Dubini, P., 1989, ‘The Influence of Motivations and Envi-ronment on Business Start-ups: Some Hints for Public Policies’, Journal of Business Venturing 4, 11–26. Evans, D. S. and L. Leighton, 1989, ‘Some Empirical
Aspects of Entrepreneurship’, American Economic Review 9, 519–535.
Grabher, G., 1993, ‘The Weakness of Strong Ties. The Lock-in of Regional Development in the Ruhr Area’, in G. Grabher, (ed.), The Embedded Firm. On the Socioeconomics of Industrial Networks, London: Routledge.
Granovetter M., 1973, ‘The Strength of Weak Ties’, American Journal of Sociology 78, 1360–1380.
Granovetter M., 1985, ‘Economic Actions and Social Structure: The problem of Embeddedness’, American Journal of Sociology 91, 481–510.
Greene, W. H., 1997, Econometric Analysis, 3rd Edition Prentice Hall.
Greene, P. G., 2000, ‘Self-employment as an Economic Behavior: An Analysis of Self-employed Women’s Human and Social capital’, National Journal of Sociol-ogy 12, 1–55.
Hosmer, D.W. and S. Lemeshow, 2000, Applied Logistic Regression, 2nd Edition, New York: Wiley.
Huggins, R., 2000, ‘The Success and Failure of Policy-implanted Inter-firm Network Initiatives: Motivations, Processes and Structure’, Entrepreneurship and Regio-nal Development 12, 111–135.
Ingram, P. and J. C. A. Baum, 1997, ‘Chain Affiliation and the Failure of Manhattan Hotels, 1898–1980’, Administrative Science Quarterly 42, 68–102.
Johannisson, B., 1990, ‘Economics of Overview – Guiding the External Growth of Small Firms’, International Small Business Journal 9, 32–44.
Johannisson, B. and M. Ramı´rez-Pasillas, 2001, ‘Network-ing for Entrepreneurship: Build‘Network-ing a Topography Model of Human, Social and Cultural Capital’, in Frontiers of Entrepreneurship, Wellesley MA: Babson College.
Kirzner, I. M., 1973, Competition and Entrepreneurship. Chicago: University of Chicago Press.
Lawson, C., 1999, ‘Towards a Competence Theory of the Region’, Cambridge Journal of Economics 23, 151–166. Lawson, C. and E. Lorenz, 1999, ‘Collective learning,
tacit knowledge and regional innovative capacity’, Regional Studies 33, 305–317.
Malecki, E. J. and R. M. Poehling, 1999, ‘Extroverts and Introverts: Small Manufacturers and Their Informa-tion Sources’, Entrepreneurship and Regional Develop-ment 11, 247–268.
Marage, F. and D. Meulders, 2001, ‘Evaluation of the Belgian Action Plan for Employment 2001’, European Commission, Expert Group of Gender and Employ-ment (EGGE).
Massey, D., 1995, Spatial Divisions of Labour: Social Structures and the Geography of Production, London: MacMillan.
Nahapiet, J. and S. Ghoshal, 1998, ‘Social capital, Intel-lectual Capital, and the Organizational Advantage’, Academy of Management Review 23, 242–268.
Niebuhr, A. and S. Stiller, 2003, ‘Territorial Disparities in Europe’, Intereconomics 38, 156–164.
Podolny, J. M., T. E. Stuart and M. T. Hannan, 1996, Networks, Knowledge, and Niches: Competition in the Worldwide Semiconductor Industry, 1984–1991. Amer-ican Journal of Sociology 102, 659–689.
Prahalad, C. and R. Bettis, 1986, ‘The Dominant Logic: A New Linkage Between Diversity and Performance’, Strategic Management Journal 7, 485–501.
Reese, P. and H. Aldrich, 1995, ‘Entrepreneurial Net-works and Business Performance: A Panel Study of Small and Medium-sized Firms in the Research Trian-gle’, in S. Birley and I. Macmillan (eds.), International Entrepreneurship, London: Routledge, pp. 124–144. Reynolds, P. D., N. S. Bosma, and E. Autio, 2005,
‘Glo-bal Entrepreneurship Monitor: Data Collection Design and Implementation 1998–2003’, Small Business Eco-nomics, in press.
Shane, S. 2000, ‘Prior Knowledge and the Discovery of Entrepreneurial Opportunities’, Organization Science 11, 448–469.
Shane, S. and S. Venkataraman, 2000, ‘The Promise of Entrepreneurship as a Field of Research’, Academy of Management Review 25, 217–226.
Singh, R., G. E. Hills, R. C. Hybels and G.T. Lumpkin, 1999, ‘Opportunity recognition through Social Net-work Characteristics of Entrepreneurs’, Frontiers of Entrepreneurship Research. Wellesley, MA: Babson College.
Stevenson, H. H. and J. C. Jarillo, 1990, ‘A Paradigm of Entrepreneurship: Entrepreneurial Management’, Stra-tegic Management Journal 11, 17–27.
Stewart, K, 2002, ‘Measuring Well-being and Exclusion in Europe’s Regions.’ ‘Case Paper’, No. 53’ London School of Economics.
Stynes, D. J. and G. L. Peterson, 1984, ‘A Review of Lo-git Models with Implications for Modeling Recreation choices’, Journal of Leisure Research 16, 295–310. Valtioneuvosto, 2000, ‘Alueellinen kehitys ja
alu-epolitiikka Suomessa’, Valtioneuvoston kanslia sarja, 6 (in Finnish) (A English summary: Regional Develop-ment and Regional Policy in Finland. 2001. Prime Minister’s Office: Publications).
Venkataraman, S., 1997, ‘The Distinctive Domain of Entrepreneurship Research’, in J.A. Katz (ed.), Advances in Entrepreneurship, Firm Emergence, and Growth, Greenwich, CT: JAI Press, pp. 119–138. Waldinger, R., H. E. Aldrich and R. Ward, 1985, ‘Ethnic
Business and Occupational Mobility in Advanced Soci-eties’, Sociology 19, 586–597.
Zaheer, A., B. McEvily and V. Perrone, 1998, ‘Does trust matter? Exploring the Effects of Interorganizational and Interpersonal Trust on Performance’, Organization Science 9, 141–159.