Development of a Total Landed Cost and Risk Analysis Model for Global Strategic Sourcing
Brian Feller
BS Industrial Engineering, Texas A&M University, 1995
Submitted to the MIT Sloan School of Management and the Department of Engineering Systems in Partial Fulfillment of the Requirements for Degrees of
Massachusetts Institute of Technology
v
Master of Business Administration and
Master of Science in Engineering Systems
June 2008
M A m c k l U m S
IN ST^'
OF T E O t l ~ ~ t m v
pi-Fiq
LIBRARIES
8 2008 Massachusetts Institute of Technology. All rights reserved In conjunction with the Leaders for Manufacturing Program at the
Signature of Author:
May 9,2008 Department of Engineering ~ ~ s t e m s ~ i v i s i o n
MIT S l ~ a n School of Management
- , -a
Certified by: --. .
A,:/- WE* Donald Rosenfield, Thesis Supervisor J
Senior Lecturer, MIT Sloan School of Management n Director, Leaders for Manufacturing Fellows Program
Certified by: -
-
//
David Simchi-Levi, Thesis Supervisor Co-Director, Leaders for Manufacturing Fellows Program Senior Lecturer in Engineering Systems and Civil & Environmental Engineering
a A
Accepted by: __
p b b i e Berechman, Executive Director of the Masters Program
n a MIT Sloan School of Management
_.
Accepted by: -
Dr. Richard Larson, Professor of Engineering Systems Chair, ESD Education Committee
Development of a Total Landed Cost and Risk Analysis Model for Global Strategic Sourcing
Brian Feller
Submitted to the MIT Sloan School of Management and the Department of Engineering Systems on May 9,2008 in partial fblfillment of the requirements for the degrees of Master of Business
Administration and Master of Science in Engineering Systems.
Abstract:
Total landed cost and supply chain risk analysis are methods that many companies use to assess strategic sourcing decisions. For this project, landed cost is defined as those costs associated with material movement from a supplier to a designated PerkinElmer, Inc. (PKI) manufacturing site. Tools or models that are available in the technology marketplace are often too cumbersome to incorporate with a company's existing technology architecture or are too simplistic to compute an accurate landed cost. For PerkinElmer, as their Analytical Sciences business continues to grow globally, they are continuously reviewing their supplier portfolio and assessing their procurement strategy.
The landed cost and risk analysis tool consists of two components, a cost model and a risk analysis model. Both models were developed to allow PKI to better understand the savings opportunities associated with a supplier selection. When performing supply chain modeling and cost optimization, it was necessary to be able to evaluate multiple scenarios that can influence a sourcing decision. Therefore, by changing parameters such as transportation mode, lead time, inventory carrying cost, fieight cost, order frequency, and order quantities in the dynamic cost model, PKI is able to understand supply chain cost trade-offs. The model developed for this project is dynamic to allow multi-variable scenarios to be assessed simultaneously, thus increasing the overall analysis efficiency.
For the risk analysis model, approximately 20 different factors were considered as a part of a risk portfolio. This concept adapts traditional financial investment portfolio management theory by considering how much operational impact one factor may have on PKI. The concept is to consider a diversified portfolio, so all of the possible risk incurred by a sourcing decision does not reside in any one "category" (logistics, inventory, etc.). The outcome of the model is an index and adjusted cost, providing PKI with an estimate of the potential cost of doing business with a supplier based on
their
risk profile.Thesis Advisors: Donald Rosenfield
Senior Lecturer, MIT Sloan School of Management Director, Leaders for Manufacturing Fellows Program
David Simchi-Levi
Senior Lecturer in Engineering Systems and Civil & Environmental Engineering Co-Director, Leaders for Manufacturing Fellows Program
Acknowledgements:
I would like to thank PerkinElmer, especially my internship supervisor John Marciniak and my project sponsor Brian McGrattan, for sponsoring this internship. This project was well defined, enabling me to make the most of the internship period. John and Brian were extremely
supportive throughout the project and allowed me the opportunity to learn, develop, and implement the resulting sourcing model.
There are many others at PerkinElmer that I would like to recognize: Charlie Mangarella, Rich Jorge, Amandio Capela, Paul
Berry,
Ned Martino, Karen Moyher, Bob Hylwa, Jackie Janeczko, Britton Shelton, Mike Tarczali, Carlo Acervida, Rob Gambardella, Frank Giamrnarco, Bob Coppola, Frank Calzone, Bob Van Egghen, Ross Mannino, Nick Lax, Don Hellerman, Gitesh Kumar, John Widomski, Erik Greenfield, Leslie Kenny, Neil Vegliante, A1 Liberty, Tom Kelly, and Pat Rousseau. Each of these individuals willingly offered their time, support, and expertise to the project.I would like to thank my thesis advisors, Don Rosenfield and David Simchi-Levi. Both were invaluable throughout the project, providing me guidance, subject matter expertise, direction, and feedback. Their dedication to the project and interest in the outcome allowed me to exceed my expectations for the project. Also, I would like to acknowledge the entire Leaders for Manufacturing Program for its support of this work.
Further, I would like to thank my peers in the LFM Class of 2008, especially those that
participated in the Strategic Sourcing structured internship group. Victor Mroczkowski, Amber Obermoller, Andy Stonn, and Leon Villegas helped me with perspectives on cost and risk from their projects that contributed to my model development.
I would also like to acknowledge the tremendous support I have received from my executive sponsors at Dell, Inc. I am grateful for their dedication to my continued education and leadership development.
Finally, I would like to thank my wife Amber, son Zachary, daughter Brenna, and my entire family for their support during our two year adventure at MIT. Their patience, love, and
flexibility have helped me balance the incredible educational experience that MIT offers with the opportunity to grow as a husband and father.
Biographical Note:
Brian Feller was born in Everett, Washington and has lived in various parts of the United States, including California, Idaho, Connecticut, Texas, and Massachusetts. Brian attended Texas A&M University and received a BS in Industrial Engineering. While at Texas A&M, Brian was an intern at Perot Systems where he developed simulation models for a variety of applications. Brian started his professional career with Arthur Andersen Business Consulting and focused on Supply Chain and Operations consulting for over six years. His experience included work in many different industries, including Consumer Electronics, Telecommunications,
Pharmaceutical, Oil and Gas, and High Tech. Prior to coming to the Leaders For Manufacturing program at MIT, Brian worked for Dell, Inc. as a Strategy Manager, Operations Supervisor, and Master Scheduler. While at Dell, Brian earned his 6-sigma Green Belt certification and served as a mentor for other 6-sigma project leaders.
Brian is an avid golfer and sports fan who enjoys home improvement projects, landscaping, and travel. Upon graduation in June 2008, Brian will be continuing his employment at Dell, Inc.
Table
of Contents
Abstract....
3...
Acknowledgements: 5...
Biographical Note: 7 Table of Contents . . . . . . . . a . . . . . . . a . . ~ ~ ~ ~ ~ ~ ~ a ~ ~ ~ ~ ~ ~ ~ ~ ~ ~ ~ ~ ~ ~ ~ ~ ~ ~ ~ ~ ~ ~ ~ ~ ~ ~ ~ ~ a ~ ~ ~ ~ ~ ~ ~ ~ ~ ~ ~ ~ ~ - m ~ ~ ~ m ~ ~ a ~ ~ ~ ~ ~ ~ ~ ~ ~ - ~ ~ ~ ~ ~ ~ ~ a ~ ~ ~ ~ ~ ~ a ~ ~ ~ ~ ~ ~ ~ ~ ~ ~ ~ ~ ~ ~ ~ ~ ~ m ~ ~ ~ ~ ~ ~ ~ m ~ ~ ~ ~ ~ ~ ~ 9 List of Figures...
....
...
11 List of Tables...
12Chapter 1: Company Background
...
13Chapter 2: Project Orientation
...
.~~.~...~....~....~~...~~....~..~...~..~~.~...m.~.~..m~..~.~.~...~.~~...~~.~~~.~m..~152.1 Project Objectives
...
16Chapter 3: Literature and Supply Chain Model Review
...
183.1 Risk Management Research
...
183.2 Landed Cost Research ... 22
3.3 Chapter Summary
...
24Chapter 4: Project Methodology and Timeline
...
0254.1 Define
...
254.2 Measure
...
254.2.1 Cost Model Component Identification
...
264.2.2 Risk Model Component Identification
...
27...
4.3 Analyze 33 4.3.1 Cost Model Analysis...
354.3.2 Risk Model Analysis
...
364.4 Design
...
394.4.1 Hypothesis Identification
...
4 0 4.5 Verify...
4 1 4.6 Chapter Summary...
41Chapter 5: Organizational Assessment and Change Management
...
42. .
5.1 Organization Analysis...
43...
5.2 Cultural Analysis 44 5.3 Political Analysis...
46 5.4 Chapter Summary...
47Chapter 6: Model Attributes and Functionality
...
486.1 Landed Cost Model Features and Functionality
...
496.2 Risk Analysis Model Features and Functionality
...
536.2.1 Phase I: Risk-Adjusted Cost Development
...
566.2.2 Phase 11: The Efficient Risk Frontier
...
58Chapter 7: Landed Cost Model Development
...
647.1 Data Entry
...
64...
7.2 Freight and Trade Compliance Cost Calculation 74 7.2.1 Material Origin - Component 1...
75...
7.2.2 Carton Configuration and Shipment Frequency - Components 2 and 5 75 ... 7.2.3 Freight Rate - Component 3 76...
7.2.4 Delivery fiom Ocean Port - Component 4 77...
7.2.5 Shipment Weight Determination - Component 5 77...
7.2.6 Minimum Freight Cost - Component 6 77...
7.2.7 Duty Recognition - Component 7 78...
7.2.8 Freight and Trade Compliance Cost Calculation - Component 8 78 7.3 Inventory Management Cost Calculation ... 797.3.1 Safety Stock ... 79
...
7.3.2 Cycle Stock 80...
7.3.3 In-Transit Inventory 81...
7.4 Purchasing Cost Calculation 82...
7.5 Financial Analysis Cost Calculation 83 7.5.1 Tooling and Fixtures...
837.5.2 Payment Terms ... 83
7.5.3 Discounts
...
847.6 Chapter Summary
...
86...
Chapter 8: Risk Analysis Model Development 88 8.1 Supplier Data Gathering...
88...
8.2 Risk Index Computation 89...
8.2.1 Purchasing and Organizational Risk 90 8.2.2 Inventory and Quality Risk...
95...
8.2.3 Finance Risk 100...
8.2.4 Logistics Risk 103...
8.2.5 Trade Compliance Risk 104...
8.2.6 Research and Development Risk 105...
8.3 Risk Index Analysis 106...
8.3.1 Overall Supplier Risk Index 107...
8.3.2 Risk Indices by Category 107...
8.3.3 Risk Indices by Tier 107...
8.3.4 Risk Indices by Individual Factor 108...
8.4 Chapter Summary 108 Chapter 9: Case Study...
110Chapter 10: Conclusion and Next Steps
...
113Appendices
...
116Appendix 1 . Definition of Assist
...
116Appendix 2 . Risk Model Questionnaire
...
117...
...
Appendix 4 . Multi-part Quote Comparison Model 120
Appendix 5 . Data Elements Required for Landed Cost Model
...
121Works Cited
...
122List of Figures
...
Figure 1 : PKI Global Manufacturing Sites 14 Figure 2: Industry Risk Survey Results (Rodysill)...
20Figure 3: Project Timeline
...
25...
Figure 4: Comparison of Risk Factors from FMEA Analysis 32...
Figure 5: Model Data Flow 39...
Figure 6: Processes Included in Multiple Applications 48...
Figure 7: Data Flow between Applications 49...
Figure 8: Landed Cost Model Functionality Matrix 52...
Figure 9: Demand Analysis Using the Landed Cost Model 53...
Figure 10: Cost Inflection Point Analysis 53...
Figure 1 1 : Risk Portfolio 54...
Figure 1 2: FMEA Results/Portfolio Weight 55...
Figure 13: Cost and Corresponding Risk Category 56...
Figure 1 4: Calculating Risk- Adjusted Cost 57 Figure 15: Efficient Frontier...
60...
Figure 16: Efficient Supplier Frontier 60 Figure 17: Sourcing Strategy Alternatives Using Cost and Risk Index...
61...
Figure 18: Landed Cost Main Menu 64 Figure 19: Common Data Entry Screen...
67Figure 20: Unique Data Entry Screen
...
69Figure 2 1 : Standard Ocean Container
...
71Figure 22: Landed Cost Scenario Selection
...
74Figure 23: Freight Cost Calculations
...
75Figure 24: Freight Rate Lookup
...
76Figure 25: Payment Term Impact
...
84Figure 26: Value of Payment Discounts
...
85Figure 28: Utility Interpolation Example
...
90...
Figure 29: Geopolitical Risk Evaluation 91. . .
...
Figure 30: Capacity Utilization 91...
Figure 3 1 : Supplier Revenue Representation 92...
Figure 32: Supplier Technology Capability 92...
Figure 33: Supplier Experience 93 Figure 34: Supplier Organization Structure...
94...
Figure 3 5 : Supplier Quality Assessment 96 Figure 36: Product Quality Assessment...
97...
Figure 37: Lead Time Risk Scale 99. .
Figure 38: Inventory Position Scale...
99Figure 39: Process Quality Scale
...
100...
Figure 40: Financial Strength Scale 101...
Figure 4 1 : Currency Volatility Scale 102...
Figure 42: FDI Investment Scale 103 Figure 43: Import/Export Experience...
104...
Figure 44: New Product Development Scale 105...
Figure 45: Risk Dashboard 106 Figure 46: Case Study Output . Risk Dashboard...
110Figure 47: Case Study Output
.
Landed Cost Model...
111List of Tables
Table 1 : Cost Components Included in Landed Cost Model...
27...
Table 2: FMEA Results 29 Table 3: Risk Portfolio Composition...
30Table 4: Description of Costs fiom the Analyze Phase of the Project
...
34Table 5: HTS Code Consolidation
...
66Table 6: Common Data Field Descriptions
...
68Table 7: Available Freight Class by Region
...
72Table 8: In-transit Inventory Adjustment Factors
...
81Chapter
1:
Company Background
PerkinElmer, Inc. (PKI) is a leading provider of scientific instruments, wnsumables and services to the pharmaceutical, biomedical, academic research, environmental testing and general
industrial markets, commonly referred to as the health sciences and photonics markets. They design, manufacture, market and service products and systems within two businesses, each constituting a separate reporting segment:
Life and Analytical Sciences (LAS). The LAS business provides precision
instrumentation, reagents and chemistries, software and services for a wide range of scientific and industrial laboratory applications, including genetic screening, drug discovery and development, environmental monitoring, food and beverage quality, and chemical analysis.
Optoelectronics. PKI provides a broad range of digital imaging, sensor and specialty lighting components used in the biomedical, consumer products and other specialty end markets.
The health sciences markets include all of the businesses in the Life and Analytical Sciences segment and the medical imaging business, as well as elements of the medical sensors and
lighting businesses in our Optoelectronics segment. The photonics markets include the remaining businesses in the Optoelectronics segment.
PKI is a global manufacturer with each site (shown in Figure 1) manufacturing unique products to complete the company product portfolio. Generally, manufacturing volumes tend to be relatively low, while the variation in product, or product mix, tends to be very high. PKI
provides a very broad portfolio of products tailored to meet the specific needs of scientists. As a result of this manufacturing strategy, procurement volumes are often relatively small, ranging in quantity fiom 50 to 2,000 per year. However, demand tends to be relatively predictable, which enables PKI to pursue strategic buys, forward buying, and longer-term supplier relationships.
-
Ii,
-
Figure 1 : PKI Global Manufacturing sites1
PKI is a Massachusetts based corporation, founded in 1947 with headquarters in Waltham, Massachusetts. Currently, PKI markets products and systems in more than 125 countries,
employs approximately 8,500 employees worldwide, and has revenues of approximately $1.5 5B. The information provided above and additional information about PerkinElmer, Inc can be found at www .perkinelmer.com.
Chapter
2: Project Orientation
PerkinElmer originally proposed a project to develop a total landed cost model to assist the organization with making strategic sourcing decisions. For the purposes of this project, total landed cost is defined as the major cost factors associated with procuring, moving, and storing material between a supplier site and the designated PKI manufacturing site. The original scope of the project was to include those manufacturing sites that are associated with the EcoAnalytix division of the Life and Analytical Sciences (LAS) business only. Specifically, these sites are located in Shelton, Connecticut, Llantrisant, Wales, and Singapore. Ideally, the outcome of the project would incorporate the operational uniqueness associated with each of these sites and to make the model scalable for other business segments.
Due to the growth through acquisition that PerkinElmer has experienced throughout its history, the many acquisitions and divestitures have resulted in an exhaustive but fkagmented supply base with many suppliers providing materials to each of the individual PKI manufacturing sites. PKI needed a sourcing tool that would help them evaluate this supply base, considering a
comprehensive list of costs and risks, and support the corporate strategy to consolidate suppliers and leverage spend among strategic suppliers.
The project was championed by the Global Strategic Sourcing team and was based in the Shelton, CT site. However, many of the other LAS sites were heavily involved in the project. Shelton was chosen because it contributes approximately 50% of the sourcing cost annually to the LAS business.
The expected outcome of the project was a technology enabled model that would be available to all geographic regions and PKI manufacturing sites to evaluate sourcing costs and decisions. Knowledge of the model and its fimctionality would be transferred through user documentation, training, and project involvement by subject matter experts and model users. Ultimately, the primary means of determining project success were the accuracy and utility of the model, adoption by purchasing and sourcing teams, and support/buy-in from business functions that were represented in the model
In the following section, the specific objectives of the project will be outlined.
2.1
Project Objectives
At the outset of the project, there were nine primary objectives established by the project team. 1. Facilitate global sourcing decisions by including major costs associated with a supplier selection in a simple to use model - The intent of the model was to be as comprehensive as possible and to include as many relevant costs that would contribute to the sourcing decision. Ultimately, including every cost was not feasible, but those that were included contributed the most significant portions of cost.
2. Create a common supplier evaluation tool for all global manufacturing sites - By
including three LAS sites, the site's processes, data requirements, and supplier challenges will be included in the model.
3. Standardize the supplier selection process - By consolidating demand and supply
requirements for each site and engaging common suppliers, PKI can leverage their global buying power and pool risk from demand variability.
4. Promote supply chain risk to be considered in sourcing decisions - Each supplier goes through an initial evaluation process, but PKI did not have a standard process that could be used to consider supplier risk in the sourcing decision?
5. Leverage spending with suppliers capable of developing long-term partnerships with PerkinElmer - Many times suppliers may be chosen for their long-term partnership capabilities. To support these decisions, PKI wanted a model that would help evaluate supplier cost and risk when establishing these partnerships.
6. Engage suppliers in low-cost countries after balancing landed cost, supply chain risk, and material complexity - One of the original intentions of the model was to confirm the benefits of using suppliers in low-cost countries. However, the overarching objective was to understand the cost differences between suppliers anywhere in the world, not just low-cost countries.
2
In a recent survey among CEOs and COOS, managing supply chain and supplier risk is the number one concern. "Executive Issues Survey, April 2006, Accenture and "Countering the Risk of Offshoring & Lean Manufacturing, Simchi-Levi, 2008 MIT Risk Management Conference
7. Raise awareness of the impact on sourcing decisions related to all other cost factors beyond material cost (e.g. trade compliance, finance, inventory, etc.) - As mentioned above, PKI made sourcing decisions, in the past, primarily on material cost variance. Going forward, PKI desired to have a much more comprehensive view of costs to make strategic sourcing decisions.
8. Provide a learning opportunity for the entire project team - Many concepts and
methodologies used in the model are new to the PKI team. Using the model provided an opportunity for each team member to grow their skills and knowledge of global supply chain processes, risks and cost.
9. Utilize the DMADV (Simon) @efine, Measure, Analyze, Design, and Wfy) 6-sigma project execution methodology - This process is a slight variation of the more commonly used DMAIC (Define, Measure, Analyze, Improve, and Control) process, but is more appropriate for this project. The DMAIC process implies an improvement over an existing process while the DMADV process implies a new design or process is being established. Since PKI did not have a formal strategic sourcing model in place, the design and verify steps were critical to ensure the model was accurate and robust in its capabilities.
Chapter
3: Literature and Supply Chain Model Review
Prior to developing a landed cost and risk model, a significant mount of research was conducted to understand models that have been developed in the past, processes for assessing risk, cost components that should be considered in a landed cost model, supply chain risk studies that have been done and how they might be incorporated in the model, theories on strategic sourcing, and the differences between total cost of ownership (TCO) and total landed cost. There are many articles that focus on these topics, especially dealing with risk management. Many state statistics on revenue loss and operational challenges that arise when supply chain disruptions materialize. Some models are heavily focused on statistical analysis while others are qualitative and more strategic in nature. The challenge when dealing with developing a complex model is striking a balance between a robust, comprehensive design and ease of use. In the following sections, research on landed cost and risk assessment will be reviewed, focusing on the analysis and findings that influenced the development of the landed cost and risk model presented in this thesis.
3.1 Risk Management Research
Many articles have been written about the inherent risks of conducting business on a global basis. Commonly researched risks include geo-political risk, natural disasters, transportation capabilities and currency volatility. More broadly, risks are often categorized as physical,
financial, relational, intellectual property related and innovational, but generally describe random events that may impact an organization (Fiskal and Rosenfield 1-8). All of these types of risks are included in the model developed for PKI. Interesting research done by Tuomo Aho describes "Wolfe's Paradox" as the situation where supply chains are designed to be robust, but are fi-agile at the same time because of the interdependencies and risks inherent within numerous supply chains, and often times those dependencies may only become apparent in a crisis (1 7). The paper also discusses the importance of Business Continuity Management (BCM), which will be supported by the model described in the following chapters. Creating awareness of the most critical risk factors supports development of mitigation strategies and recovery plans throughout the organization. The model developed for PKI attempts to strike a balance between cost and risk management, by creating a tool that integrates both to understand the potential impact of identified risks and by helping prioritize mitigation activities. Although risk management is
well-researched and studied, a survey of purchasing executives in 2004 reported that only 50% monitor supply chain risk often while 30% monitored risk rarely (de Waart 27-33). As lean and Six Sigma practices have reduced inventory levels, a traditional buffer against risk, throughout the value chain, executives are beginning to dedicate more attention to understanding supply chain risk. Consequently, many companies are tempering their lean initiatives because supply chain and transportation reliability around the world do not support the aggressive goals initially set for inventory reduction. In a 2005 report by the Council of Supply Chain Management Professionals (CSCMP), it was shown that inventory levels are rising to buffer against risk (Crone 28-35). However, inventory accumulation cannot be the sole counter measure to risk. The model developed for PKI helps to understand the trade-offs of inventory cost with logistics, materials, and other costs and associated risks. Understanding these trade-offs and prioritizing risks associated with each supplier is critical to maintaining supply continuity.
Many risk management models attempt to prioritize risks relative to each other to create a hierarchy structure. One model by Sarkis and Talluri suggests a sourcing decision maker use pair wise comparisons of risks to determine which is more important (1 8-20). As opposed to establishing a hierarchy of importance, the model developed for this project considers all risks in a portfolio, making a specific contribution to the overall risk of working with a particular
supplier. Like an investment portfolio, risks will perform differently over time (Hauser 64-71). The key to using the model effectively is understanding how adverse effects impact cost at a particular time, recognizing business processes that need to change to manage risk, and revisiting supplier risk profiles regularly to align mitigation strategies with current market conditions.
Another challenge in managing risk is working with suppliers in low cost countries and
understanding their capabilities. One of the most important steps in identifying capable suppliers is to have a set of criteria and qualifications that include historical, financial, operational, service and reference information that will help discover shortfalls, risks and strengths in the relationship (Derocher 1-6; Sarkis and Talluri 18-20; de Waart 27-33). By using supplier information in a quantitative manner, PKI will be able to establish their risk mitigation strategies. Such strategies may include speculative strategies (i.e. using a single alternative), hedge strategies (i.e. balancing risks among multiple sources or locations), or flexible strategies (i.e. using multiple suppliers,
manufacturing locations, etc.)(Kogut 27-38). One approach, which was used in this project, is to normalize the risk scale used for evaluation purposes and to enable a relative risk score to be calculated (called risk utility in the PKI model) (de Waart 27-33). In the article, the idea of weighting each risk factor is introduced, but cautioned due to subjectivity. In the model created for PKI, weight factors were included using a method that minimizes subjectivity.
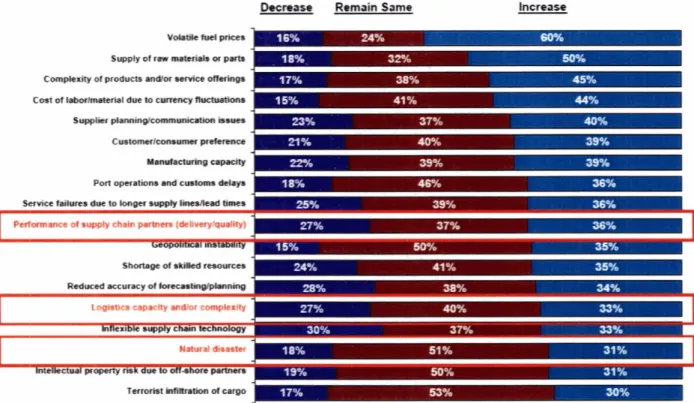
Many sources were used to determine what risk factors should be included in the model. Subject matter experts, literature, surveys, and industry best practices were considered. One specific survey used was presented at a recent conference at MIT. Accenture offered data from their 2006 Risk Management Survey that showed how over 150 practitioners thought specific risk
factors and levels would change in the next three years (shown in Figure 2). Each of the sources
mentioned above contributed information and justification for the many factors which have been included in the model.
Remain Same Increase
V o l r m e r u e l ~
i
Supply of raw nuterhh a pwtr
I
Compkxity of products n d l o r renice offsrinQI
b
Cost of k b o r ~ ~ l due to cumncy llocts#tionr1
Supplier ptundnglunnmunicrtion b.ua
I
Port operatiffs .nd cu8toms &lay.
I
~ e r v i e e failures due to lon~er ~ p p l y times- t k ~ e r h P o r f m d HIPP(Y, ch.ln prtnm (&ti-Reduced accuracy of
Loak61c~ UPlCltr ndlor compbxity
I InteRectu.1 property nrr tlw to an4hols psrtnw, . . Terrorist inlilbation ofcargo
Risk-adjusted cost models have also been developed, but defined differently than the model developed for this project. An application provided by vivecon3 focuses risk management on demand and supply imbalances. Other models have defined risk-adjusted cost as including bbfully-loaded" material price, inventory costs, shortage costs as well as probability of inventory shortages and backlog levels impacting total cost (McBeath and Kessinger 1-6). Again, these models focus on costs that are quantifiable over time. The model developed for PKI considers these risks as well as those that have an indirect impact on cost, such as organizational structure, trade compliance, currency volatility, financial position of a supplier, etc. By calculating a total cost that adjusts for the cost of various risks, sourcing teams can be much smarter in evaluating alternatives (McBeath and Kessinger 1-6).
In addition to this thesis, several other projects were being conducted as part of the Leaders for Manufacturing (LFM) program at MIT that related to strategic sourcing. Projects at The Boeing Company, United Technologies, ABBY and American Axle Manufacturing considered risk management, total cost assessment and strategy development. Throughout each project, project leaders collaborated on key issues and risks that were common among a variety of manufacturing industries. Common risks included supply chain delays and disruptions, demand variability, currency volatility, geo-political risks, intellectual property risks, quality, technology capability, and inventory management. Many of the risks included in the model developed for PKI were also relevant for other operational challenges such as global outsourcing, manufacturing plant location selection, and strategic supplier selection. Since many companies are considering suppliers in low-cost or emerging countries and with significant commodity price volatility, identifying and understanding the risks associated with these decisions is becoming more complex and challenging (Teague 60-64). Past LFM theses also contributed to the approach taken for this project. As Mr. Morita points out in his thesis on total cost, there are numerous approaches that can be taken to developing a cost model. Alternative approaches include using Total Cost of Ownership (TCO), activity based costing or transaction costing, supplier/order/unit level functions, or a comprehensive model considering hundreds of cost components. Mr. Morita chose a change in cash flow analysis as opposed to an absolute cost calculation and utilized a
Vivecon Online. 2006. Vivecon Company Information. 15 October 2007. <htt~://www. ~i~e~~n.~~ml~rod~~tslindex. html>
risk common denominator of operational slowdown or shutdown (Morita 17-1 8). In models developed by Robinson (2) and Wu (2) for Honeywell and Teradyne respectively, landed cost models included only labor and materials, logistics, inventory and taxes and were designed to begin the analysis process of establishing global sourcing alternatives. Unfortunately, no one methodology has proven to be more accurate or inclusive than another.
3.2
Landed Cost Research
As total landed cost solutions become more prominent in the market, the scope of what such models include will also expand. Many initial landed cost models included only material and transportation costs. In order to execute global sourcing well, a company must first consider the trade-offs across the four primary sources of cost: material cost, transportation cost, inventory carrying cost, and trade compliance costs. A company that considers all four of these costs in the formula they use to make sourcing decisions is in an excellent position to outperform their competitors' cost structures through global sourcing (Home 1-5). The model developed for PKI considers each of these costs as well as others that may influence the sourcing decision.
Fortunately, technology has continued to advance with leading supply chain software providers such as i2, JDA, and SAP developing landed cost modules. In an article published by Infosys on Landed Cost Optimization, functionality of a landed cost model would need to include
transportation mode analysis, import and export charges, tariff charges by country, potential storage charges, multiple currencies, freight term impact on cost, and supplier incentives or discounts (Gummaraju 1-4). Additionally, the ability to do "what if' analysis and compare relative total costs of different scenarios can be very useful when considering the impact of actual product requirements specifications and design thinking (McBeath). The model developed for PKI will allow for these what-if scenarios to be evaluated.
Another alternative for cost modeling is the use of linear programming algorithms. Although these methods are predominately used for optimization, the structures and frameworks can be helpful in identifying cost inputs and attempting to reach an "optimal" business solution, not just an bboptimal" cost solution. For example, linear programming algorithms may be used to find results such as the total supply cost, average supply cost, or how much of a part should be purchased from a selection of suppliers. By establishing an objective function, decision
variables, and appropriate constraints, a minimum cost can be determined (Bertsimas and Freund 324-424). Similarly, non-linear programs (NLP) may be used to determine expected return or minimum risk possible from a series of investments. NLP may also be used for supplier location strategy to serve global manufacturing sites where lead time, distance, and purchase quantity are all drivers in determining total cost (Bertsimas and Freund 324-424). These optimization strategies may be used for h r e model development, but the intention of the landed cost and risk model for PKI was not necessarily to minimize the calculated landed cost, but to consider risk and other business factors to make a strategic supplier selection based on all relevant decision criteria.
One challenge in developing a total landed cost model is making the distinction between landed cost and TCO. Since TCO often takes a life cycle view of a product, many costs associated with production, quality, outbound logistics, maintenance, and transactions would be included in understanding TCO. Historically, TCO models have relied heavily on activity based costing (ABC) analysis to properly attribute operational costs to specific parts or materials (Ferrin and Plank 18-29). Given that many of the costs mentioned above are not attributable to the original supplier of the part(s), the model considers only those costs relevant to selecting a supplier.
A specific goal of this project was to provide a tool that would assist with decisions to source material in low-cost countries. As PKI considers low-cost countries, five key criteria must be evaluated; total landed cost, delivery reliability, supply chain flexibility, product design, and regulatory compliancelrisk mitigation (Forrest 17-20). A study done by Bain & Co showed that sourcing in low-cost countries may offer material cost savings of 10-35%, but the additional wst incurred from lead time variability and operational delays may quickly erode that savings (Crone 28-35). The model being developed in this project will help PKI understand the trade-offs between material savings, other operational costs and the criteria suggested above to make strategic supplier selections.
3.3
Chapter Summary
After reviewing many sources and literature about landed cost and risk management, a common theme has emerged. No one method for evaluating cost and risk has proven to be more accurate or complete than another. Each organization using these tools must establish their own processes and measures for making sourcing decisions using complex models. Given the wide variety of applications and challenges in identifying costs, organizations that recognize the need for a structured approach to make strategic supplier selections will have an advantage over their competition. Thoroughly understanding financial impact and potential risk with a given supplier will provide insight and drive actions that create value for both PKI and its suppliers.
Chapter
4: Project
Methodology
and Timeline
As noted in Chapter 2, the project methodology followed the 6-sigma DMADV approach. The methodology is utilized when the intent of the project is to create a new product or process that has not existed in the past, hence the use of the design phase as opposed to the improve phase. Also, when a new product or process is created, the final stage, verify, is used to ensure accuracy and adoption as opposed to ensuring that an improved process is producing controllable and
repeatable results. In each of the following sections, the activities conducted in each phase will
be reviewed.
4.1 Define
The define phase was used to solidify the scope of the project and to ensure that the model being built would initially focus on the Life and Analytical Sciences business, but would be portable to any other business unit. Additionally, during the define phase the detailed timeline of the project was established. Estimated durations, activities, and dependencies were determined and the project plan was articulated to the project management team. Figure 3 shows the project timeline with key milestones.
Figure 3 : Project Timeline
Specific activities that were conducted during this phase were as follows: operational tours,
interviews, focus groups, data gathering, metrics reviews, stakeholder analysis, expectation
setting, literature research, and participation in the MIT LFM structured research group focused on strategic sourcing.
4.2 Measure
The measure phase was critical in the formulation of the cost and risk components that would be included in the model. To gather data on which costs and risks were most relevant to the
business, focus groups, process audits, and datalliterature reviews were conducted. The specific areas that were included in the measure phase were inventory management, procurement,
development, and legal. Each session with these groups allowed for subject matter experts to explain business processes and the cost and risk factors that each is accountable to manage. Other activities completed during the analyze phase are identified below:
Measured the availability of historical data, real-time data, or subject matter expert
knowledge - As cost components were identified, data sources were identified to understand what historical data, real-time data, or estimates may have to be used in the model.
Reviewed primary metrics impacted by the model - A primary metric used by the
organization was to review the material cost variance between suppliers. The scope of the project would require a paradigm shift on how multiple costs would be considered when making sourcing decisions.
Completed stakeholder assessment to understand roles, responsibilities, project input, communication methods, and challenges - The model would potentially impact the existing sourcing processes, but would also have an impact on customers and supplier partnerships. Those impacts will be discussed in future sections of this thesis related to the actual cost and risk models.
To begin preparing for the process changes that would be required to implement the model, conversations with leaders around current metrics, the behavior they drove, and the impact the model may have on those metrics were conducted
4.2.1 Cost Model Component Identification
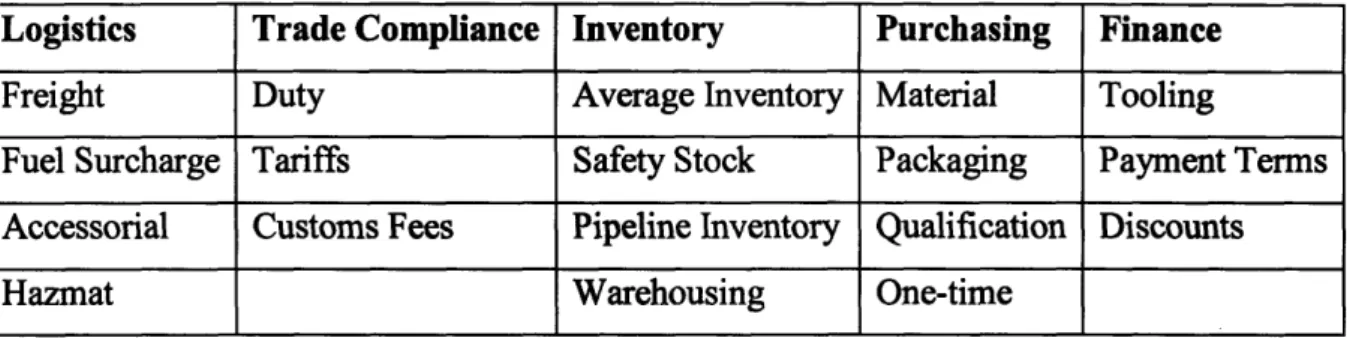
During initial interviews and process audits, over 45 cost elements were identified as possible components to the model. It was understood fkom the initial cost list that many of the costs factors that were proposed by the organization could not be quantified in a sourcing model. After the identification of costs, each was classified as either a "hard" cost or 4 4 ~ ~ f Y cost. Eventually, those "soft" costs would be used to develop the risk model. The detailed cost and risk components will be described fully within each section of this thesis devoted to the strategic sourcing model. The specific hard costs that were identified for the model are listed in Table 1.
Table 1 : Cost Components Included in Landed Cost Model Logis tics Freight Fuel Surcharge Accessorial Hazmat
After considering the magnitude of these costs, they were the elements that would drive the most significant expense to the organization, and were therefore, used as the primary sources for landed cost. Many other cost factors were considered, but since the model was intended to be a strategic sourcing decision making tool, initial estimates of other cost factors were either too arbitrary to include or were more conducive to be included in the risk model since the costs were too subjective to validate.
During the Measure phase, potential sources of the cost factors listed above were assessed. Those sources included existing contracts, the internet, historical data, supplier input, and static rates used throughout PKI for business case analysis purposes. Following the source
identification, subject matter experts were consulted to understand the calculations methods used for each cost. Specific inputs that were requested included PKI cost of capital, interest rate, product demand forecasts, depreciation schedules, etc. The calculations used for each section of the model will be discussed in detail in the modeling section of the thesis.
4.2.2 Risk Model Component Identification Trade Compliance
Duty Tariffs
Customs Fees
As mentioned above, the sourcing model was to include an assessment of risk associated with a particular sourcing decision. It was agreed upon by the project team, that risk would be defined as those elements of the sourcing decision that would impact the supplier selection process but could not be quantified in the cost model. Further, risks that could be described as tactical (short-term impact) and strategic (long-term impact that require mitigation strategies) would be considered in the model (Hopp, Iravani, and Yin). In order to understand those risks that were most relevant to PKI, extensive focus groups were conducted with subject matter experts and individual discussions were held with suppliers to understand the challenges they faced in
Purchasing Material Packaging Qualification One- time Inventory Average Inventory Safety Stock Pipeline Inventory Warehousing Finance Tooling Payment Terms Discounts
delivering product to PKI manufacturing sites. The combination of these two sources, along with extensive literature research, which was described earlier, formed the initial list of risks that were considered for the model. At the outset, there were 33 risks identified across the following hnctional groups: trade compliance, logistics, purchasing, finance, operations, quality,
inventory, research and development, and sourcing. The intent of developing an exhaustive list of risks was to ensure that the model utilized a well-rounded approach of assessing risk, and not limit the risk factors to a subset of the overall supply chain.
The next step in assessing the identified risk factors was to use a Failure Mode Effects Analysis (FMEA) (Crow) process to understand the potential risk that each factor would have on PKI should it materialize. An FMEA is traditionally used to understand process failures and the effect they would have on an organization. However, in this case, a modified FMEA can also be used to understand the potential impact of risk factors on an organization. An article published in Quality Progress (after a modified FMEA process was developed for this project) confirmed the viability of using an FMEA for such an assessment and suggests that to understand risk factors, having an easily understood identification and analysis process is critical (Welbom 17- 21). Specifically, for each risk factor, the severity to the organization, the likelihood of the occurrence, and the processes in place to mitigate the risk can be used to generate a risk priority number (RPN) for each risk factor. Those risks that emerge with a higher RPN are those that, should they occur, will cause the greatest impact to the organization. In the assessment, impact broadly included operational shutdown, overtime to recover fiom supply disruptions, customer satisfaction, cost increases, revenue loss, employee morale, legal ramifications, supplier
relationships, etc. For the FMEA, there are various scales used for each factor identified above. For the purposes of this project, the scales used were as follows:
Severity 3 1 to 7 scale, with a 7 having the most impact;
Occurrence 3 1 to 5, with a 5 being very likely that the risk will occur;
Detection
+
1 to 5, with a 5 being very unlikely that PKI had any mechanism in place to detect or monitor the risk prior to its occurrence.Therefore, the RPN is calculated as follows: RPN = Severity
*
Occurrence*
Detection As an example, a risk factor with maximum severity, high probability, and limited a priori detectability would result in an RPN of 175 (7*5*5). As is typical with FMEA analysis, theremay be multiple effects or detection mechanisms in place for any one risk, therefore, the process used was to average all inputs for each risk to come up with a final severity, occurrence and detection score. This averaging is evident in Table 2. The final column, entitled "weight" will be described later in this chapter.
After conducting the initial FMEA study, it was determined that several risk factors could be aggregated since they would be evaluated similarly. The challenge was to not make the risk factor too broad so that it became difficult to measure in the model. The final FMEA results are shown in Table 2 and 3.
Table 2: FMEA Results
1 2 3 4 5 6 7 8 Categoiy Trade Compliance Purch / Organizational Finance Jnventoty f Qualrtg ' Purch. / Organizational Inventmy / Quahty Logisbcs Logmcs 19 Risk International trade inportlexport experience
Geo-political risk
Financial strength
Supplier product quahty
Capacity u t h t i o n 'Inventory requirements
Preferred carrier availability Supply cham delays
712.43 Finance Severity 5.83 5.40 4.57 4.33 4.86 3.67 5.17 4.45 FDI investment Oc currei~ce 4.14 3.00 3.00 2.86 3.25 3.50 2.33 3.11 3.67 Detection 2.90 3.50 3.60 3.63 2.75 3.38 3.50 3.00 3.20 RPN 70.08 56.70 49.37 44.88 43.41 43.31 42.19 41.58 Weight ' 9.84% 7.96% ' 6.93% ' 6.30% 6.09% ' 6.08% 5.9Wo 5.84% 1.25 14.67 ' 2.06%
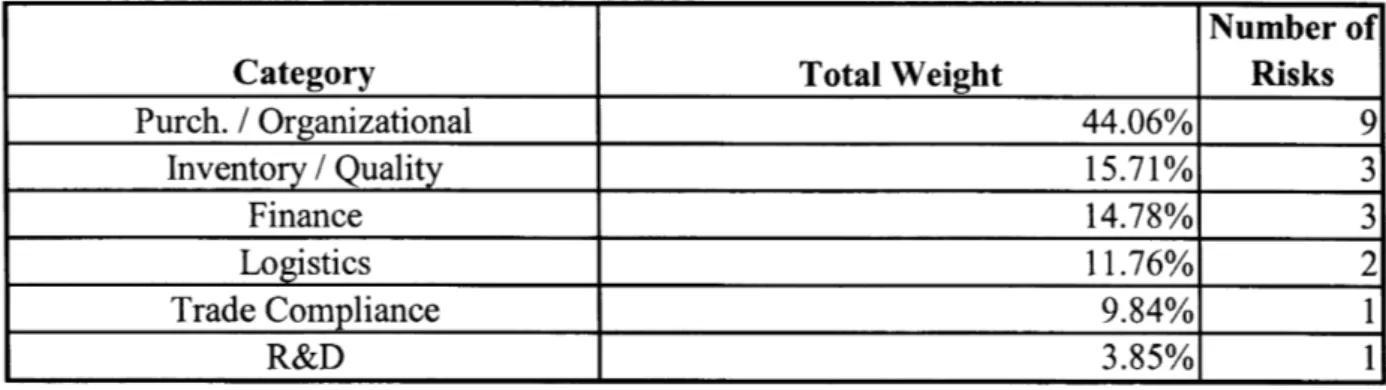
Table 3 : Risk Portfolio Composition Category Purch. / Organizational Inventory / Quality Finance Logistics Trade Compliance R&D
Specific definitions for each risk factor are included below:
International Trade ImportIExport Experience 3 The ability of a supplier to understand and correctly provide product valuation, commodity coding, documentation requirements, invoicing, HTS classification, and country of origin identification.
Geo-Political Risk 3 The potential that doing business with a supplier in a particular country may be impacted by political changes, governmental instability, or social volatility.
Financial Strength 3 For the purposes of this model, the financial strength of a supplier is based on a 3rd party scoring system such as Dun & ~ r a d s t r e e t ~ and is based on a 0 to 10 scale.
Supplier Product Quality 3 A number of metrics such as defective parts per million
(DPPM), yield analysis, failure rates, delivery performance tracking, and cost of poor quality (COPQ) are used to rank product quality in the model.
Capacity Utilization 3 The current estimated capacity position of the supplier.
Inventory Requirements 3 The risk factors associated with inventory are those that could not be quantified in the cost model. Such factors include rework capability, warranty terms, and inventory risks related to inventory levels held, which would include damages, scrap, and excess and obsolescence.
Preferred Carrier Availability 3 The ability of a supplier to use a PKI preferred carrier such as UPS or FedEx.
Supply Chain Delays 3 The likelihood that delivery may be delayed due to natural disaster, customs clearance processes, logistics infrastructure, corruption, etc.
Total Weight 44.06% 15.71% 14.78% 11.76% 9.84% 3.85%
*
Dun & Bradstreet, Inc Online. Dun & Bradstreet, Inc Company Information. 3 November 2007. chttp ://www.dnb.com/us/> Number of Risks 9 3 3 2 1 1Currency Volatility
3
Although contracts are likely to be negotiated in USD, Euros or Singapore Dollars, assessing a supplier's local currency is an indicator of the economic conditions that a supplier will be operating under for hture contract negotiations.Strategic Supplier
3
The assessment by the Global Strategic Sourcing team on whether the supplier is a candidate for consolidated spend and global partnering versus a supplier that is utilized for a specialty part or small scale production of a particular part.Supplier Business (Revenue) Represented by PKI
3
A measure for PKI to understand the financial position they will occupy with a supplier and to understand how much influence they will have over a supplier.Supplier Technology
3
An assessment of a suppliers ability to partner with PKI in ease of information flow, data management, streamlined ordering and payment processing,manufacturing planning, etc.
Experience
3
For the model, experience is evaluated on four points; year over year growth, years in business (longevity), other Fortune 500 companies as customers, and years of experience in the commodity being sourced.Supplier Organization Structure
3
An assessment of the supplier's account management structure, both locally and globally.New Product Development Capability
3
A review of a supplier's R&D capability to understand if they will be able to partner with PKI for new product development, existing product improvement, reverse engineering, or value engineering.Supplier Supply Chain Management
3
Understanding how a supplier measures their suppliers and supply chain is indicative of their ability to meet PKI demand.Process Quality In order to meet product quality standards, process management
initiatives are leading indicators of a supplier's ability to deliver quality products. Indicators include IS0 certification, work instructions, corrective action processes, equipment
calibration schedules, operator metrics, and inventory segmentation.
Supplier Progressiveness
3
To achieve cost reduction initiatives, reviewing continuous improvement programs in place at a supplier can be used as an indication of their ability to scale or reduce cost with PKI. Such indicators include 6-sigma, lean, formal safetyprograms, a formal project management road-map, and formal employee cross-training programs.
FDI Investment
+
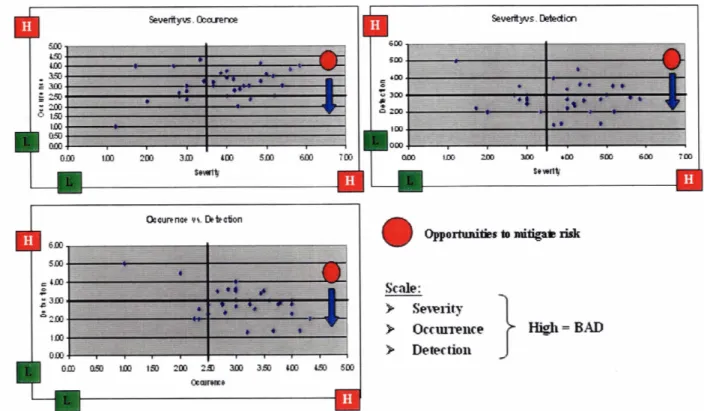
Foreign Direct Investment (FDI) is a metric that measures the investment being made in a country by outside corporations. Considering FDI takes advantage of other company investment and risk analysis processes that have concluded to do business in a particular geography.A by-product of the FMEA process is the ability to understand which risk factors have the most
potential impact on the business and what mitigation factors are in place for each factor. By
using a scatter plot, each component of the RPN, severity, occurrence, and detection can be
compared. raw f 42: -g2m
-=
:
1s Scale:>
Sewiity>
O c c m ~ l c e High = BAD>
DedectioilI
Gcun noc vr. Dr C ctionFigure 4: Comparison of Risk Factors fiom FMEA Analysis
The organization can use this type of analysis (shown in Figure 4) to prioritize mitigation
activities and also more closely review supplier characteristics that will impact risk to PKI.
As a way to represent risks in a model, a "risk portfolio" concept was utilized, which will be discussed fbrther in the risk model development section of the thesis. However, at the bottom of the RPN column in Table 2, the value 712.43 represents the total risk valuation of the entire risk portfolio. Therefore, weight = individual RPNItotal portfolio risk valuation.
As an example, for risk factor 1 (import/export experience), 70.08 (individual RPN) + 7 1 2.43 (total portfolio risk) = 0.0984. Therefore, the model will assume that risk associated with trade compliance comprises 9.84% of the total risk portfolio. The utilization of this weight factor will be described in Chapter 8.
4.3
Analyze
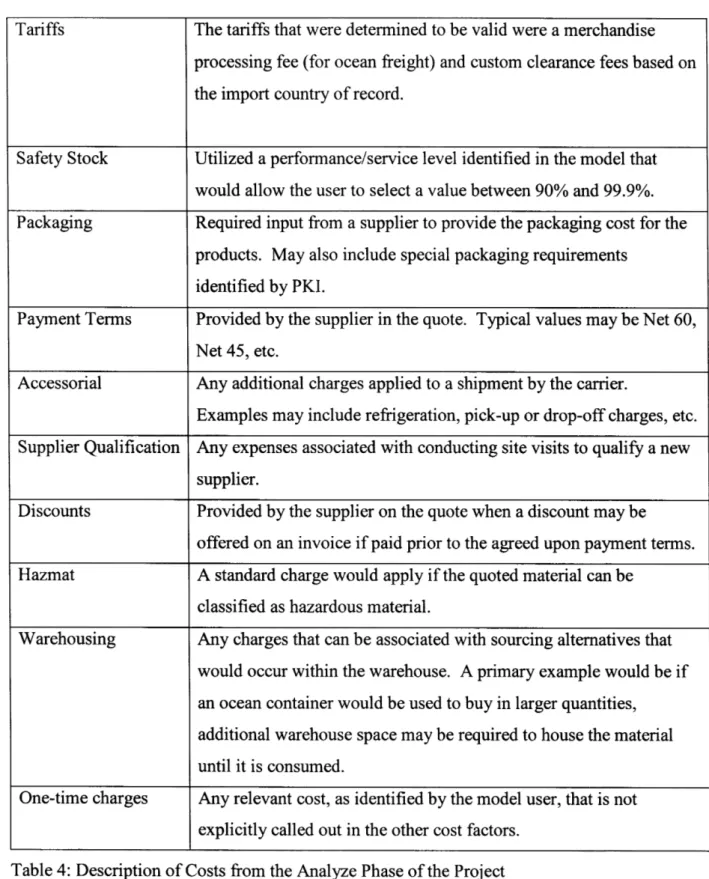
During the analyze phase of the project, the primary objective was to understand how each cost item would be calculated in the model and how each risk component would be evaluated. Each cost evaluated in the model would be calculated using data analyzed in this phase of the project. Table 4 shows the cost factors included and the data that was obtained to use in the
computations. Cost Element Freight Duty Inventory Material Tooling Fuel Surcharge
Required Data and Source
Negotiated freight rates from all carriers, by mode and service level. Used a blended duty rate that will be described in the model. Rates are from the US and EU Harmonized Tariff Schedules.
.Required lead times, service levels, demand variability, lead time variability, and cost of capital.
Needed to understand demand requirements and component cost. Demand forecasts for 12- 18 months were gathered and included both dependent and independent demand. Dependent demand being that demand that is associated with service sales or warranty
requirements. Independent demand is the part demand to be used for the production of a finished instrument. Component cost is the quoted material cost fiom each supplier.
A direct cost input from the model user.
To keep the surcharge rate current, a direct link to the Fed Ex website was to be used in the model so any changes to the rate would be reflected in the model immediately. Fuel rates for ground and air transport were analyzed.
Table 4: Description of Costs from the Analyze Phase of the Project
Each of the specific calculation methods used for each cost factor will be discussed in Chapter 7. Tariffs Safety Stock Packaging Payment Terms Accessorial Supplier Qualification Discounts Hazmat Warehousing One-time charges
The tariffs that were determined to be valid were a merchandise processing fee (for ocean freight) and custom clearance fees based on the import country of record.
Utilized a performance/service level identified in the model that would allow the user to select a value between 90% and 99.9%. Required input from a supplier to provide the packaging cost for the products. May also include special packaging requirements
identified by PKI.
Provided by the supplier in the quote. Typical values may be Net 60, Net 45, etc.
Any additional charges applied to a shipment by the carrier.
Examples may include refrigeration, pick-up or drop-off charges, etc. Any expenses associated with conducting site visits to qualify a new supplier.
Provided by the supplier on the quote when a discount may be offered on an invoice if paid prior to the agreed upon payment terms. A standard charge would apply if the quoted material can be
classified as hazardous material.
Any charges that can be associated with sourcing alternatives that would occur within the warehouse. A primary example would be if an ocean container would be used to buy in larger quantities, additional warehouse space may be required to house the material until it is consumed.
Any relevant cost, as identified by the model user, that is not explicitly called out in the other cost factors.
4.3.1 Cost Model Analysis
For the cost development exercise, one primary area of concern was freight cost and duty cost associated with any particular sourcing decision. These costs were a significant challenge due to the many complex freight rate options that exist for the purchasing team to consider.
Furthermore, selection of an accurate duty rate using the structure provided by the Unites States Government in the published Harmonized Tariff schedule (HTS)~ is often difficult. Despite the necessary due diligence by a supplier or purchasing agent to select a correct HTS code,
ambiguous product descriptions can often be identified as the root cause of incorrect product coding. The solution to this challenge will be described in Chapter 7.
Another purpose of the analyze phase was to understand the landed cost model options required to accommodate sourcing processes in the United States, the United Kingdom, and Singapore. Other key data elements that were analyzed as a part of the cost model were as follows:
Demand forecasts by product for all geographies; Part weights and dimensions;
Financial data which included inventory carrying cost, interest rates, etc.
Further, during the analyze phase, a comprehensive list of data required from the user was developed. These data elements would need to be available from a supplier quote or request for quote (RFQ). Part of the analysis revealed that many these inputs were already a part of the quote process, but were not used collectively in the sourcing decision making process. The list of inputs is provided below.
- - -- -
United States International Trade Compliance Online. 2007. 10 September 2007. <htto:llwww.usitc.govltata/ > and Customs Info Online. 10 September 2007 ~htt~://www.customsinfo.com>
Manufacturing country of origin; Raw material ship from country;
Lot size; rn
Shipping carton dimensions;
Order quantity; rn
Order fkequency; rn
Hazardous material status; rn
Instrument where part is used;
Freight mode options; Material cost; Shipping service type; Lead time;
Freight terms; Service level;
Unique part attributes; Packaging cost. Finance terms;
Payment discounts; Assist value; Tooling cost;
4.3.2 Risk Model Analysis
After a significant amount of research, it was determined that few risk models determined risk in a quantitative manner. Specific analysis techniques such as the Analytical Network Process (ANP) allow multiple risk criterion to be compared, establishing control or a hierarchy of risks and showing how they relate to one another through pair wise comparison (Saaty 1-14). Since independence among the risk factors is not a requirement, the method can be used for processes like supplier selections. However, these models often created comparisons of risk factors, but rarely would look at risks as a portfolio, as described above. For this model, the purpose was not to determine which risks were more relevant than another, since that exercise was completed using the FMEA analysis. Rather, the intent was to understand the relative risk of a supplier against a variety of factors. Therefore, the model employs a utility-weight algorithm for analyzing risk. Granted, there is still some subjectivity associated with the process, but the algorithm attempts to do the following:
Eliminate subjective analyses of supplier business behavior when determining risk; Create a mechanism that uniformly rates supplier risk;
Produce a outcome that can be used to compare suppliers;
Develop a method that considers changes in supplier performance over time.
The utility development process uses the concept of traditional economic utility functions where a consumer or customer ranks each alternative and their preferences to determine a priority for decision making. Then, an expected value can be computed based on a finite number of
alternative^.^
Similarly, in this model, utility is determined based on user input to how much riskti Wikipedia. 2007. Wikipedia. 19 November 2007 < h t t p : / l e n . d ~ e d i a . o r d w ~ t i 1 i W U t i functions >
PKI is willing to tolerate fiom a supplier. The development of a utility factor required both a qualitative and quantitative approach to ensure all suppliers assessed in the tool would be represented equally, regardless of any preconceived notions about risk associated with any one particular supplier. The risk analysis is divided into three unique parts; a normalized utility scale, a supplier capability scale, and supplier input based on a newly developed questionnaire. A description of the questionnaire will be provided in Chapter 8.
Normalized Utility Scale
In order to assess each risk uniformly, it was necessary to develop a normalized scale for evaluation purposes. Therefore, a scale fiom 0 to 100 would be the basis for the utility of the risk factor. Making use of the weight factors fiom the portfolio and the normalized utility values allows for creation of a risk index. The risk index is calculated by multiplying the weight and utility for each factor. A maximum value is possible if the supplier has the maximum risk utility for each risk factor as determined by a global, cross-functional PKI team. In addition to the normalized utility scale, different evaluation scales were required for each factor. The variety of evaluation scales with respect to utility included linear relationships, inverse linear relationships, complex non-linear relationships, cumulative capability assessments, and simple binary
evaluations. Examples of factors with each of these scales will be provided in Chapter 8. Supplier Capability Scaling
Although the intent of the model is to reduce subjectivity, risk analysis, by its very nature, can be biased. However, in the model, an attempt was made to create a consistent scale for all suppliers to be evaluated against, therefore reducing individual sourcing decision subjectivity. The
concept of the evaluation scale is to determine a range of acceptance associated with each risk factor. The range would be aligned with the normalized scales noted above, to allow for a risk index to be calculated. The intuition associated with each scale is as follows:
Linear scale lower utility = lower risk;
Inverse linear scale
+
higher utility = lower risk; Complex non-linear scale3
lower utility = lower risk; Binary scale+
high or low risk based on binary input;Cumulative capability scale
+
Minimum capability = higher risk.To explain M e r , below are examples of risk factors with linear, inverse linear and complex non-linear relationships.
Linear Relationship Risk Factors: Inventory Requirements Currency Volatility
Inverse Linear Relationship Risk Factors: Geopolitical Risk
Experience (YOY growth, years in business, and commodity experience) Financial Strength
FDI Investment
New Product Development Capability (project references) Binary Risk Factors:
Strategic Supplier
Experience(otherFortune500customers) Supplier Supply Chain Management Progressiveness
Inventory Requirements Preferred Camer Availability
New Product Development Capability (formalized R&D capability) Cumulative Capability Risk Factors:
Supplier Technology Organization Structure Product Quality
Process Quality Supply Chain Delays
International Trade ImportIExport Experience
New Product Development Capability (engineering skill sets) Complex Relationship Risk Factors:
Capacity Utilization/Availability
Business (Revenue) Represented by PKI
The specific calculation methodology associated with the utility-weight analysis process will be described in Chapter 8.
4.4
Design
The design phase contained the development of all aspects of the models that will be described in
the Chapters 7 and 8. In addition to the actual model development, other activities included in
the Design phase were as follows:
Continued interaction with PKI sites in the UK and Singapore so the model would be inclusive of their unique sourcing requirements;
Completed multiple case studies, leading to several iterations of the model;
Conducted user training;
Developed an Information Technology (IT) roll-out plan for implementation; Developed work instructions and technical manual for the model;
Interacted with suppliers to get input on the risk model attributes and supplier questionnaire
requirements.
The design process involved global and bctional subject matter experts (SME) fiom across the
organization. These individuals provided critical feedback and testing of the model as it was
developed. The model went through several iterations to ensure that the design was robust and
the interface user-friendly. Data entry processes, reporting, archiving, and data warehousing were all critical aspects of the development of the model. The original intent of the model was to
make the front-end a simple data entry process that would be intuitive for the user to navigate.
As a result, the model has two components; a data warehouse application and a dynamic
modeling application for both cost and risk modeling. The data flow of the model is depicted in
Figure 5.
Data Applic t i o n Dynamic Modeling Application
st Model
I