HAL Id: hal-01111190
https://hal.inria.fr/hal-01111190
Submitted on 24 Jul 2015
HAL is a multi-disciplinary open access
archive for the deposit and dissemination of
sci-entific research documents, whether they are
pub-lished or not. The documents may come from
teaching and research institutions in France or
abroad, or from public or private research centers.
L’archive ouverte pluridisciplinaire HAL, est
destinée au dépôt et à la diffusion de documents
scientifiques de niveau recherche, publiés ou non,
émanant des établissements d’enseignement et de
recherche français ou étrangers, des laboratoires
publics ou privés.
Characterizing ICMP Rate Limitation on Routers
Riccardo Ravaioli, Guillaume Urvoy-Keller, Chadi Barakat
To cite this version:
Riccardo Ravaioli, Guillaume Urvoy-Keller, Chadi Barakat. Characterizing ICMP Rate Limitation
on Routers. IEEE International Conference on Communications (ICC), Jun 2015, London, United
Kingdom. �10.1109/ICC.2015.7249285�. �hal-01111190�
Characterizing ICMP Rate Limitation on Routers
Riccardo Ravaioli
Universit´e Nice Sophia Antipolis Laboratoire I3S/CNRS UMR 7271
Sophia Antipolis, France
Guillaume Urvoy-Keller
Universit´e Nice Sophia Antipolis Laboratoire I3S/CNRS UMR 7271
Sophia Antipolis, France
Chadi Barakat
Inria
Sophia Antipolis, France
Abstract—In the last decade, path discovery has been extensively covered in the literature. In its simplest form, it generally works by sending probes that expire along the path from a host to a destination. It is also known that network administrators often configure their routers to limit the amount of ICMP replies sent, a common practice typically referred to as ICMP rate limitation. In this paper we attempt to characterize the responsiveness of routers to expiring ICMP echo-request packets. Our contribution is twofold: first, we provide a detailed analysis of how routers are most commonly configured to respond to expiring packets; next, we show that for the vast majority of routers, the measured round-trip time is not affected by the probing rate.
I. INTRODUCTION
Several tools proposed by the research community rely on feedback from intermediate routers in order to infer network characteristics. Traceroute-based path discovery [9], [1] is a notable example: by sending probes with increasing Time-To-Live (TTL) values until a given destination is reached, traceroute elicits ICMP time-exceeded errors on intermediate routers and the whole path to a destination is uncovered. By merging paths to many destinations, we can even infer the topology of the Internet (e.g. CAIDA’s skitter project [4]), or the topology of specific ISP networks (e.g. Rocketfuel [13]). ICMP feedback from routers is also used to discover path performance properties such as bandwidth and delay. For example, Pathneck [8] tries to localize and characterize the bottleneck link on a given path, and Pathchar [5] leverages the relationship between transmission time and delay to infer the bit rate of network links.
The main problem that arises when making use of TTL-limited probes is that ICMP feedback from routers is often neither instantaneous nor entirely reliable. Indeed, as the generation of ICMP error messages takes place in the slow path of the data plane, manufacturers and operators impose a low priority on it, in order to minimize the overall load on routers. Other internal tasks mostly related to the control plane, like route computation and management operations, might take prece-dence over it, especially when resources are shared between slow path and control plane. In addition, in order to further reduce the impact of ICMP message generation, the respon-siveness to expiring packets is often limited by a hard-wired or configurable maximum rate [14], above which routers simply ignore any expired packets and stay silent. All these limitations of the ICMP generation process can have repercussions on measurement tools and need to be thoroughly understood. In this paper, we try to shed light on the way ICMP rate limitation is implemented on routers and analyze its impact on active measurements. We proceeded for this purpose with a large-scale measurement campaign on PlanetLab, where we targeted at various probing rates 850 routers located at different
depths into the network. Our contributions are the following: • We identify an on-off pattern in the way ICMP rate
limitation is most often implemented and devise a taxonomy of routers accordingly.
• We determine the most popular configuration parameters on rate-limited routers, with respect also to their vendors. • We demonstrate that the measured round-trip time for TTL-limited probes is not correlated with the choice of probing rate.
Developers of measurement tools who might have a concern about exceeding rate limitation thresholds can draw lessons from our findings, as we show that it is relatively easy to observe an answering pattern and possibly filter it out. On the other hand, when it is essential to have a high answering rate, it might be of use to know in advance which settings are the most common across vendors.
II. OVERVIEW
Before delving into an accurate description of our measure-ment setup, we provide upfront two results: one introduces the effect of ICMP rate limitation on active probes, the other adds an important insight on the delays obtained.
First, we ask ourselves which fraction of routers is affected by ICMP rate limitation and at which probing rates this is most evident. In Figure 1, we plot the loss rates that we experienced when probing a large set of routers with TTL-limited packets at different sending rates in the range of [1, 2543] packets per second (pps). The loss rate, which we define as the number of received ICMP time-exceeded messages over the number of sent probes, is drawn in a separate bean plot for each probing rate. Bean plots show a scatter plot of all individual values on top of a kernel density estimate of the probability density function of the data. Median and mean are denoted, respectively, by a blue cross and a short green horizontal line. Two trends are evident in Figure 1: i) the median loss rate remains very low for probing rates up to 372 packets per second (pps) and it progressively increases up to 90% with higher probing rates; ii) a non-negligible fraction of experiments shows the above behaviour already for rates higher than 54 pps. But when exactly does ICMP rate limitation take place? How is it most commonly implemented and what are the most frequent configurations? We will address these questions in Sections IV and V.
Besides being concerned about collecting a sufficient number of responses, we are interested to know whether the delay associated to them is in any way biased by the sending rate that we choose. In order to verify this, we plot in Figure 2 the mean Round-Trip Time of each experiment, arranged by probing rate (a full description of the measurement campaign is presented
1 19 39 54 75 104 144 199 272 372 503 678 907 1183155220092543
sending rate (pps)
0
20
40
60
80
100
loss rate (%)
all ttls
Fig. 1: Loss rates for all experiments, arranged by probing rate.
in Section III). The box plots are self-explanatory: both the
me-dians and the IQRs1appear steady across all the tested probing
rates. We can therefore conclude that the choice of probing rate has no visible influence on the average round-trip time. We can also observe that a few experiments resulted in mean values that are far away from the core of the distribution (at 1, 10 and up to 60 seconds). These outliers start to appear at 75 pps and seem to follow a linear increase. Such behavior was limited to a dozen routers that persistently behave in this way and constitute an exception as compared to the rest of routers in our dataset. We further discuss the delay distribution in Section VI.
1 19 39 54 75 104 144 199 272 372 503 678 907 1183 1552 2009 2543
sending rate (pps)
10
-110
010
110
210
310
410
5mean RTT (ms)
all ttls
Fig. 2: Mean RTT box plots for all experiments, arranged by probing rate.
III. EXPERIMENTAL SETUP
We conducted our measurement campaign from 180 PlanetLab hosts, each of which located at a different site in order to avoid overlapping measurements.
Each run lasted 30 seconds and targeted one single hop along the path from a PlanetLab host to a fixed IP destination. A single experiment consisted in sending at a constant rate ICMP echo-request probes (similar to what the Ping tool uses) with a forged IP Time-To-Live (TTL) value, so that the packets would expire on the router at the desired hop and generate ICMP time-exceeded error messages. Each sent probe was 28 Bytes in length (20 Bytes for the IP header + 8 Bytes for the ICMP header), with no extra payload added
1IQR is the Inter-Quartile Range, defined as the difference between the
75thand the 25thof the considered distribution. It corresponds, by definition, to the length of the box and aggregates 50% of the samples.
to the end of the packet. The choice of ICMP for our probes instead of UDP or TCP followed the results in [7], where large-scale measurements showed that, in comparison, ICMP probes elicit the highest number of responses.
We decided to target the first 5 hops from each PlanetLab host in order to include in our dataset both edge and backbone routers. The IP destination address was a public IP address assigned to a machine in our use. It was kept unchanged in all probes, thus effectively reaching no more than one router per hop, except for only 3 cases in which per-packet load balancers were encountered (a low prevalence in line with what was observed in large-scale measurements by the authors of Paris Traceroute [2]).
We selected 17 exponentially-spaced sending rates between 1 and 4000 packets per seconds, in order to capture the behaviour of routers at low and relatively high probing regimes. We note here that the majority of PlanetLab hosts could not fully keep up with the desired sending rates, especially with the highest ones (> 1500 pps). Consequently in all figures, for a desired probing rate r, we actually show the median of all measured sending rates achieved by the PlanetLab hosts when instructed to probe at rate r.
Every (host, hop, rate) tuple was tested 3 times. We tried to stress routers as little as possible between experiments by shuffling the order of sending rates and by never choosing the same hop in consecutive experiments.
The measurement campaign was performed in the first two weeks of February 2014 using NEPI [12], a Python-based library for the deployment of experiments on network evaluation platforms. Our resulting dataset includes over 45000 path measurements and 850 distinct routers. Only 53 routers appeared in more than one path, generally at hops 4 or 5 from hosts in the same country.
IV. ANALYSIS OFICMPRATE LIMITATION
In the dataset we collected, two types of rate limitation were present. In the first one, which we call on-off, the router followed a clear answering pattern. In the second one, which we will just call rate-limited (rl), the overall answering rate is constant, but without a visible pattern.
A. On-off
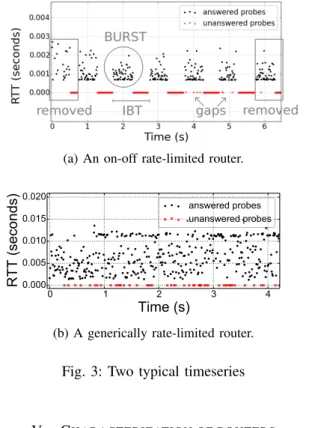
A typical example of an experiment targeting an ICMP rate-limited on-off router is displayed in the timeseries in Figure 3a, where we report on the x-axis the time at which the probe was sent and on the y-axis the corresponding round-trip time if an ICMP time-exceeded packet was received for this probe. Whenever no reply was received, a red cross appears on the x-axis at y=0. We define:
• a burst as any series of consecutive answered probes delimited by unanswered probes. What we are interested in is the size of a burst (BS), in packets.
• an Inter-Burst Time (IBT) as the time interval between the first probe of a burst and the first probe of the next burst.
A period coincides therefore with the occurrence of a burst, followed by a series of unanswered probes.
Tolerance to noise. In experiments similar to the one in Figure 3a, occasional unanswered probes inside a burst would
split that burst into smaller ones, according to the above defini-tion. If instead we tolerate the occurrence of a few unanswered probes (that we call a gap and denote its size by g) and decide to end a burst only when more than g unanswered probes ap-pear in a row, we are able to catch also those cases of visually identifiable bursts that a too conservative approach would miss. This allows us to account for potential losses in the network and occasional interruptions in the generation of ICMP time-exceeded packets on routers when more urgent tasks, for example related to fast path operations, need to take place.
On-off behaviour. If we represent each experiment as a series of burst sizes (BS’s) and Inter-Burst Times (IBT’s), we can determine the degree of regularity of the observed
burstiness by examining the coefficient of variation2 (CoV ) of
the two metrics, which we call CoVBSand CoVIBT. A careful
visual inspection of many timeseries led us to observe that a significant fraction of routers featured a typical on-off pattern when answering to our probes, where an on state is a state in which all or nearly all probes are answered and an off state is a state during which no answer is received. This essentially cor-responds to a variant of a token bucket where tokens, valid only for the duration of one period, are generated periodically and in bursts, with each token being a ticket to send out an ICMP reply when needed. Once all tokens expire, the router simply ignores any arising event requiring the transmission of an ICMP reply and continues to do so until the next period, when a new burst of tokens arrives. Taking into consideration the presence of noise as previously described, we define an
experi-ment as on-off when both its CoVBSand CoVIBTlie below an
empirically chosen threshold of 0.05. That is to say that, when the series of BS’s and of IBT’s contain values that do not differ from one another by more than 5%, the router is flagged as on-off for this experiment. The threshold of 0.05 appeared to be a good trade-off that minimizes the incidence of false positives. B. Generic rate limitation
We will see in Section V that a fraction of routers in our dataset are indeed rate-limited when being probed at rates higher than a router-specific threshold, but the way in which they respond does not follow an on-off or any other recognizable pattern. An example is provided in Figure 3b, where it is clear that, even though the number of unanswered probes is approximately the same every second, the order at which the router decides whether to generate ICMP time-exceeded replies is not as predictable as in the on-off case. We now move to a more detailed characterization of routers based on their responsiveness.
2The coefficient of variation is defined as the ratio between the standard
deviation of a random variable and its mean. It measures the variability of a distribution in units of the mean and enables a direct comparison between distributions having different means.
Category Description # of routers (%)
fr Fully Responsive 257 (30.2%)
fr-irr Fully Responsive then Irregular 51 (6.0%)
fr-rl Fully Resp. then Generically Rate Limited 118 (13.9%)
fr-onoff Fully Responsive then On-Off 211 (24.8%)
fr-onoff-irr Fully Resp. then On-Off then Irregular 180 (21.2%)
unresponsive No answer 33 (3.9%)
TABLE I: Number of routers in each category.
(a) An on-off rate-limited router.
0 1 2 3 4
Time (s)
0.000 0.005 0.010 0.015 0.020RTT (seconds)
answered probes unanswered probes(b) A generically rate-limited router.
Fig. 3: Two typical timeseries
V. CHARACTERIZATION OF ROUTERS
In our measurement campaign, we observed that the vast majority of routers behaves according to three responsiveness phases depending on the rate at which we probe. As we probe at increasingly high rates, we have, in order of appearance:
• fully responsive phase, in which a router replies to the probes it receives in a timely manner. The loss rate is < 5%, with sporadic exceptions attributable to the router load, network congestion or other minor causes.
[rmin, r0) is the range of probing rates at which this
phase takes place.
• rate-limited phase, where ICMP rate limitation is turned on as a result of a probing rate higher than a router-specific threshold. If on-off, the router responds at a con-stant rate and any excess probes at every time period will be simply discarded. If generically rate-limited (rl), the router has an overall constant answering rate, but excess probes are dropped without a clear order. Refer to
Sec-tion IV for more details. This phase is defined in [r0, r1].
• irregular phase, during which the router reaction is less predictable than before. The rate at which we probe hits a capacity limit and the router fails to reply in a regular way. Generally, two things might happen: the loss rate gradually increases to 100%, or the on-off pattern is not as precisely observable as before, with the overall responsiveness being nonetheless roughly unchanged.
This is the behaviour observed in (r1, rmax].
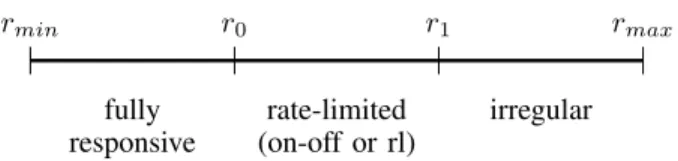
The three phases are displayed in Figure 4, where we called:
rminthe minimum probing rate at which we hit a router (in our
case 1 pps); r0the minimum probing rate at which rate
limita-tion appears (with r0being necessarily ≥ rrl, the rate at which
a router is configured to reply when in the rate-limited phase);
r1 the highest probing rate at which we notice a well-defined
rate limitation; rmax the maximum rate at which we probe.
fully responsive rate-limited (on-off or rl) irregular rmin r0 r1 rmax
Fig. 4: The responsiveness of routers to TTL-limited probes, broken down into three phases, according to the rate at which we send probes.
phases occur in the set of probing rates in [rmin, rmax] used
in our measurement campaign. As mentioned in Section III, we tested exponentially-spaced rates in the range [1, 4000] pps, but most PlanetLab nodes failed to achieve the highest values. Typically, a router will have a fully-responsive (f r) phase, followed by a rate-limited phase (if configured), and possibly by an irregular phase (irr). We can now devise the following taxonomy:
• Rate-limited routers. Routers where a rate-limited phase occurred. We define three sub-categories:
a) fr-onoff. Routers that are fully responsive in [rmin, r0)
and on-off for higher probing rates, that is to say in [r0, rmax], with r1≥ rmax.
b) fr-onoff-irr. Routers that are on-off only within a given range of probing rates, above which they exhibit an irregular behaviour. They are fully responsive, as
in the previous case, in [rmin, r0), but have an on-off
phase in [r0, r1], with r1< rmax. An irregular phase
appears in (r1, rmax].
c) fr-rl. Routers that are fully responsive up to r0, after
which their answering rate is constant at a value rrl
(with rrl necessarily ≤ r0), without the occurrence
of any on-off pattern. We note here that no fr-rl-irr routers were encountered.
• Non rate-limited routers. Routers in which the
rate-limited phase is not observed. We have two cases: a) fr. Routers that are fully responsive for the entire
range [rmin, rmax], in which they reply to all (or
nearly all) probes. The condition verified here is that the loss rate in the majority of the experiments is < 5%, a value arbitrarily chosen as an indication of high responsiveness. This essentially corresponds to the case in which no rate-limited or irregular phase
took place for probing rates in [rmin, rmax].
b) fr-irr. Routers that are fully responsive (loss rate
< 5%) up to a given probing rate rirr, after
which their loss rate starts to increase, without any rate-limiting pattern being observed.
• Unresponsive. Routers that are configured to never reply to expiring IP packets. 33 such cases were encountered, amounting to a mere 4% of the total number of routers in the dataset.
Interestingly, the six categories appeared quite evenly spread out with regards to the hop-distance from the PlanetLab hosts. In our subsequent analysis, we chose to use a gap value of 4, since it maximizes the number of on-off rate-limited routers without being so high as to include possible false positives. The breakdown for our set of 850 routers is detailed in Table I. The vast majority (96%) of routers are responsive, which is good
news, as tools like traceroute are key instruments for network troubleshooting. 30% of the routers answer to all probes (up to the maximum probing rate used in our experiments), while about 60% feature rate limitation at some point, either with a clear on-off pattern (46%) or without (13.9%).
A. On-off routers
For a given on-off router, its on-off behaviour can be described by its (BS, IBT ) pair. If we divide BS by IBT , we obtain the rate limitation threshold of an on-off router, or in
other words its answering rate ronof f during the on-off phase.
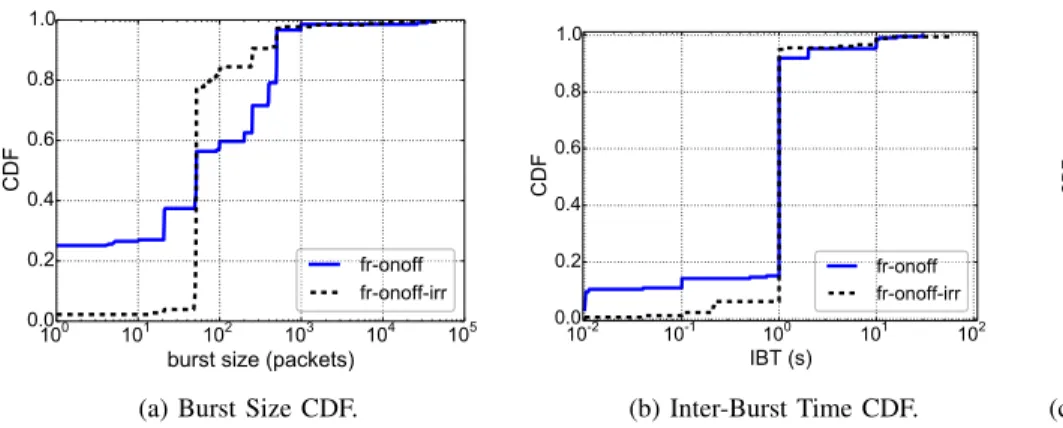
1) Distribution of Burst Size: In Figure 5a we compare the
cumulative distribution functions (CDF’s) of burst sizes for
fr-onoff and fr-onoff-irr routers. In the case of the 211 fr-onoff
routers (as seen in Table I), burst sizes span from 1 to 39,000 packets. The most common values are: 1 (25%), 50 (20%), 500 (15%), 20 (10%), and 250 (10%). Almost all remaining values are multiples of 50, each one of them not occurring in more than 5% of all cases. As for the 180 fr-onoff-irr routers, while the set of burst sizes is similar to that of the fr-onoff, we found a much larger fraction of routers configured at 50 pps. The most frequent values are the following: 50 (70%), 250 (7%) and 500 (7%). Even though the two CDF’s look fairly different, the set of burst sizes for both router categories includes reasonable values that a network administrator could have very well picked. We will see in Section V-C that this is due to a dominance, among the fr-onoff-irr, of Juniper routers, which are mostly rate-limited at 50 pps.
2) Distribution of Inter-Burst Time: Similarly to what
we did for the burst size, we now study the distribution of the Inter-Burst Time, shown in Figure 5b. The two curves are rather similar, with 1 second as the most frequent value. We also observe a larger fraction of fr-onoff routers at IBT = 0.01s. In the case of fr-onoff routers, the values span from 4ms to 30s with the most common ones being: 1s (70%), 0.01s (10%), 2s (5%) and 10s (5%). For fr-onoff-irr routers the observed range is (0.01s, 60s), where we have: 1s (85%), 0.02s (5%) and 10s (5%). We can also notice outliers on the right-hand side of the CDF curves: about a dozen PlanetLab hosts used in our measurement campaign were heavily loaded at the time and our 30-second experiments lasted in reality up to 2 minutes (with the measured probing rates being considerably smaller than the desired ones); surprisingly, this let us find a couple of cases where a very long series of answered probes (see the outliers in the BS CDF) was interrupted every 30 or 60 seconds by a relatively short series of unanswered packets. Our suspicion is that this is most likely due to an internal process requesting the router resources at those precise intervals.
3) Behaviour in (r1, rmax]: We said that on-off routers
of type fr-onoff-irr cease to be on-off at probing rates higher
than r1, which varies from router to router. In Figure 6a we
show the distribution of r1, which reveals that 76% of these
routers moved to the irregular phase when we probed them at
less than 76 pps, with this value being r1 for 45% of them.
In order to study what happens during the irregular phase, we plotted in Figure 6b the CDF of the (per-router) average ratio between the actual answering rate of each experiment in the irr phase and the answering rate if the router were still in the on-off phase. In the curve, values close to 0 indicate little (or no) responsiveness, which is the case for around 10%
100 101 102 103 104 105
burst size (packets)
0.0 0.2 0.4 0.6 0.8 1.0 CDF fr-onoff fr-onoff-irr
(a) Burst Size CDF.
10-2 10-1 100 101 102 IBT (s) 0.0 0.2 0.4 0.6 0.8 1.0 CDF fr-onoff fr-onoff-irr (b) Inter-Burst Time CDF. 102 103 answering rate (pps) 0.0 0.2 0.4 0.6 0.8 1.0 CDF
(c) Answering rate for rl rate-limited routers.
Fig. 5: CDFs of BS, IBT for on-off routers. CDF of answering rates for rl routers.
of these routers. Values on 1 suggest that, even though the on-off pattern is not as strictly enforced as before, the overall answering rate is the same as in the on-off phase. This is true for around 20% of routers in this category. Values between 0 and 1, where more than 50% of routers lie, show instead a decreased answering rate. We leave for future study an explanation for the outliers on the right-hand side of the curve, which indicate an unexpected increase in responsiveness. B. Generically rate-limited routers
Generically rate-limited routers keep the answering rate constant for all probing rates in the rate-limited phase. In Figure 5c we study the distribution of answering rates for these routers. Compared to the answering rates seen for the on-off category, here the values are sensibly higher: almost 50% are rate-limited at 2000 pps, 20% at roughly 1000 pps and 15% at 100 pps.
C. Vendors
ICMP rate-limitation parameters can be hard-coded into a router or configurable by its administrator, depending on the router vendor. For example, according to Cisco documenta-tion [3], Cisco 6500 and 7600 routers can be configured with the desired answering rate and burst size. Steenbergen [14] reports that in Cisco GSR routers the limitation rate is hard-coded, which is also the case for Juniper routers, whose an-swering rates vary depending on the model: 50, 250 or 500 pps.
102 103 r1 (pps) 0.0 0.2 0.4 0.6 0.8 1.0 CDF fr-onoff-irr
(a) Distribution of r1 for
fr-onoff-irr routers.
0 1 2 3 4 5
(1 - loss rate) / (ronoff / sending rate)
0.0 0.2 0.4 0.6 0.8 1.0 CDF
(b) Answering rate over
expected ans. rate in irr phase.
Fig. 6
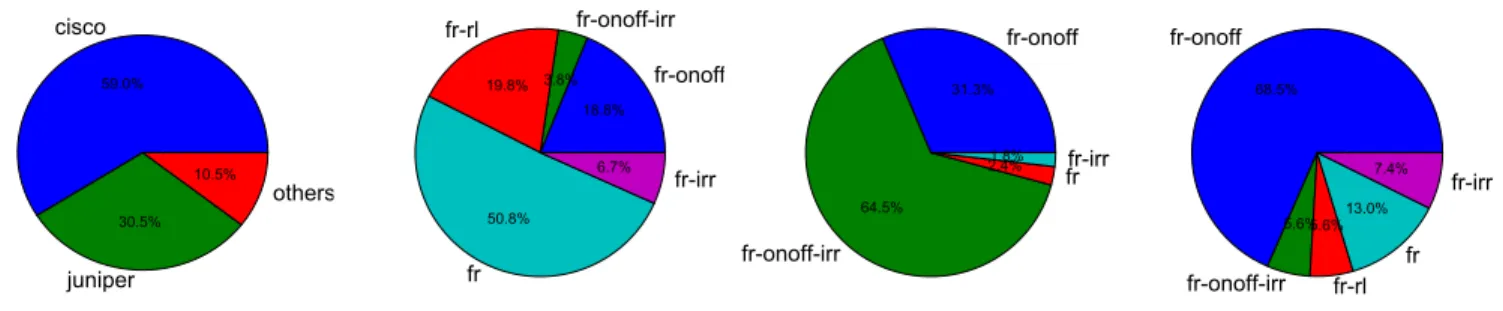
With this in mind, we fingerprinted the routers in our dataset in order to determine their most common configurations. For routers at hop 1 we simply looked up their MAC address, whereas for all other ones we used the technique described in [15], with which we can identify a router as Cisco, Juniper or “others” by comparing the IP TTL of the response to an ICMP echo-request and to a TTL-limited probe. The distribution of vendors seems to follow the known prevalence of Cisco in the market: 59% of routers were labeled Cisco, 30.5% Juniper and 10.5% others. In Figure 8 we see how the different categories are distributed for each vendor: Cisco has a large fully-responsive component (50.8%), almost all (95.8%) Juniper routers are on-off and those marked as “others” are also mainly on-off (74.1%). For on-off routers, we show in Figure 7 the distribution of BS, IBT and answering rate arranged by vendor. A few considerations: i) Cisco routers are mostly configured at 20, 100 or 500 pps; ii) IBT is generally always 1 second, except for Cisco routers, which display more values (probably as a consequence of being configurable in software); iii) most Juniper routers are rate-limited at 50 pps, the dominant value we saw previously for fr-onoff-irr routers. It is no coincidence, as these are mostly Juniper.
D. Validation by controlled experiments
We resorted to controlled experiments in order to verify that i) we infer the correct on-off parameters, and ii) there is no bias added by PlanetLab hosts. We arbitrarily chose 60 machines from the PlanetLab testbed, each one of which located at a different site, and instructed them to probe (in sequence) a machine in our control, where we emulated the
on-off behaviour of routers with the use of Linux iptables3.
For simplicity, we did not make the ICMP echo-request probes expire on this machine, but we directly replied to them with ICMP echo-reply messages.
Similarly to our large-scale measurements, each single experiment lasted 30 seconds, during which a PlanetLab host probed at a constant rate our machine. We picked 12 exponentially-spaced probing rates in the interval [1, 1000] pps and tested each rate twice. On the machine in our control, we emulated an on-off router by using for a first round of measurements a rate limitation of 20 pps (BS = 20 packets,
100 101 102 103 104 105 burst size (packets)
0.0 0.2 0.4 0.6 0.8 1.0 CDF cisco juniper others
(a) Burst Size CDF by vendor.
10-2 10-1 100 101 IBT (s) 0.0 0.2 0.4 0.6 0.8 1.0 CDF cisco juniper others
(b) Inter-Burst Time CDF by vendor.
100 101 102 103 104 answering rate (pps) 0.0 0.2 0.4 0.6 0.8 1.0 CDF cisco juniper others
(c) Answering rate CDF by vendor.
Fig. 7: CDFs of BS, IBT and answering rate for on-off routers, arranged by router vendor.
cisco 59.0% juniper 30.5% others 10.5% fr-onoff 18.8% fr-onoff-irr 3.8% fr-rl 19.8% fr 50.8% fr-irr 6.7% fr-onoff 31.3% fr-onoff-irr 64.5% fr 2.4%1.8% fr-irr fr-onoff 68.5% fr-onoff-irr 5.6% fr-rl 5.6% fr 13.0% fr-irr 7.4%
Fig. 8: Distribution of vendors and percentage of routers in each category for Cisco, Juniper and “others”.
20 25 30 35 40 45 50 55 average BS (packets) 0.0 0.2 0.4 0.6 0.8 1.0 CDF 20 pps 50 pps
(a) Burst Size CDF.
0.97 0.98 0.99 1.00 1.01 1.02 1.03 1.04 average IBT (s) 0.0 0.2 0.4 0.6 0.8 1.0 CDF 20 pps 50 pps (b) Inter-Burst Time CDF.
Fig. 9: Verification of inferred parameters on a controlled rate-limited machine.
IBT = 1 second) and for a second round a value of 50 pps (BS = 50 packets, IBT = 1 second). In Figure 9 we show the CDF of the measured average Burst Size (BS) and Inter-Burst Time (IBT ). While for the IBT the correct value is precisely measured, an error of up to 2 units is often encountered in the estimation of the BS parameter. After a manual inspection of several experiments, we can only conclude that it is an implementation-dependent issue: the BS parameter is simply not always as rigorously enforced as the IBT in iptables. Nonetheless, the correct inference of the above parameters lets us exclude the existence of any bias coming from the PlanetLab hosts or the networks where they reside.
VI. DELAY
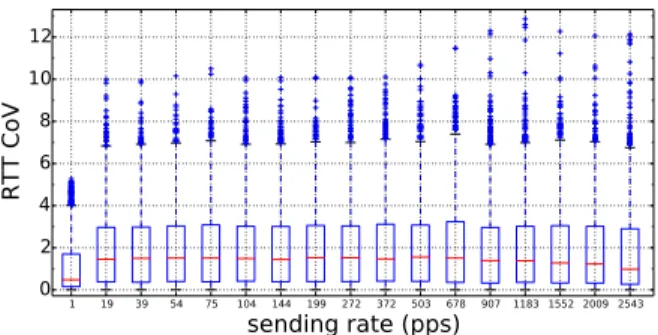
In Section II we observed that the rate at which we send probes does not influence the resulting round-trip time, whose mean value is stable across all probing rates under consideration. We add here further evidence to support our claim by analyzing the per-experiment RTT variability. For each experiment, we took the coefficient of variation (CoV) of all its round-trip times and plotted in Figure 10 all CoVs arranged by probing rate and regardless of the hop distance. Apart from the case of 1 packet per second, for which the CoVs refer to samples of only 30 RTTs (as each experiment lasts 30 seconds), where apparently less variability occurs, for all other probing rates there does not seem to be any noticeable difference across them. The interquartile range appears stable, with a very slight decrease of the median for higher rates. Therefore, we can apparently conclude that the sending rate has no direct impact on the round-trip time of TTL-limited probes: its mean is not altered, and neither is its variability.
VII. RELATEDWORK
To the best of our knowledge, our work is the first of its kind to attempt to precisely characterize ICMP rate-limitation on routers at a large scale.
Gunes and Sarac [7] analyzed publicly available traceroute data collected between 1999 and 2008, and noticed that, in recent years, network operators have configured routers to become increasingly less cooperative to active probing. Then,
1 19 39 54 75 104 144 199 272 372 503 678 907 1183 1552 2009 2543
sending rate (pps)
0 2 4 6 8 10 12RTT CoV
Fig. 10: RTT CoV box plots for all experiments, arranged by probing rate.
they conducted large-scale measurements with direct (i.e. destined to a router) and indirect (i.e. traceroute-like) probes and compared the responsiveness of routers according to the chosen protocol: ICMP, TCP or UDP. They concluded that ICMP probes elicit the highest number of responses, followed by TCP and UDP in the case of direct probes, and by UDP and TCP for indirect ones. It is also based on this finding that we decided to use ICMP probes in our measurements. Govindan and Paxson [6] proposed a technique to estimate the time taken by a router to generate an ICMP time-exceeded message: given a router R located on the path from host A to host B, they compared the one-way delay from A to B experienced by direct probes and by spoofed TTL-limited probes that expire on R but whose ICMP error message is sent to B. They found out that for most routers the slow path time is less than 0.5 ms.
Malone and Luckie [11] tackled an issue tightly related to the use of TTL-limited probes: the matching between probes and ICMP time-exceeded messages, based on the quoted contents of the expired probes inside the ICMP message. They detailed a variety of packet field modifications applied by routers and middle boxes that might result in discrepancies between the quoted packet and the original probe. Incidentally, they also pointed out that in their measurements there were a few tens of probes that experienced incredibly high RTTs, spanning from 10 to 300 seconds. We encountered exactly the same kind of outliers when analyzing our dataset (as can be seen in Figure 2). Layouni et al. [10], who studied in depth the causes behind undisclosed routers in traceroute, also reported very high round-trip times and attributed them to high activity in the control plane, which at least in our dataset seems more likely to be caused by our own probing rather than by other parallel processes.
VIII. CONCLUSION
Although the use of ICMP rate limitation on routers in the Internet has been known for a long time, no previous study had tackled the problem of precisely characterizing how this function is implemented in the wild.
We analyzed the RTT distribution obtained when targeting routers with TTL-limited probes and found that it is apparently uncorrelated with the chosen probing rate. We introduced a classification of routers based on their responsiveness across different probing rates and we observed that rate limitation most often consists of an on-off process, where the router
alternates between a state in which it answers to all probes and a state during which it remains silent. We analyzed in details the configuration parameters of on-off routers: burst size and inter-burst time. We detected a variety of values for the former parameter, while the latter is generally equal to 1s. As future work, we intend to extend our measurements to go deeper into the core of the Internet and group routers with respect to the ISP that manages them. This will allow us, for example, to check if ISP’s apply a consistent configuration across their routers.
ACKNOWLEDGMENT
This work was funded by the French Government (National Research Agency, ANR) through the ”Investments for the Future” Program reference #ANR-11-LABX-0031-01.
REFERENCES
[1] B. Augustin, X. Cuvellier, B. Orgogozo, F. Viger, T. Friedman, M. Latapy, C. Magnien, and R. Teixeira. Avoiding traceroute anomalies with paris traceroute. In Proceedings of the 6th ACM SIGCOMM conference on Internet measurement, pages 153–158. ACM, 2006. [2] B. Augustin, T. Friedman, and R. Teixeira. Measuring load-balanced
paths in the internet. In Proceedings of the 7th ACM SIGCOMM conference on Internet measurement, pages 149–160. ACM, 2007.
[3] Cisco. Ttl expiry attack identification and mitigation.
http://www.cisco.com/web/about/security/intelligence/ttl-expiry.html. [4] K. Claffy, T. E. Monk, and D. McRobb. Internet tomography. Nature,
7(11), 1999.
[5] A. B. Downey. Using pathchar to estimate internet link characteristics. In ACM SIGCOMM Computer Communication Review, volume 29, pages 241–250. ACM, 1999.
[6] R. Govindan and V. Paxson. Estimating router icmp generation delays. In Passive & Active Measurement (PAM), 2002.
[7] M. H. Gunes and K. Sarac. Analyzing router responsiveness to active measurement probes. Passive and Active Network Measurement, pages 23–32, 2009.
[8] N. Hu, L. Li, Z. M. Mao, P. Steenkiste, and J. Wang. A measurement study of internet bottlenecks. In INFOCOM 2005. 24th Annual Joint Conference of the IEEE Computer and Communications Societies. Proceedings IEEE, volume 3, pages 1689–1700. IEEE, 2005. [9] V. Jacobson. traceroute. ftp://ftp.ee.lbl.gov/traceroute.tar.gz.
[10] F. Layouni, B. Augustin, T. Friedman, and R. Teixeira. Origine des ´etoiles dans traceroute. In Colloque Francophone sur l’Ing´enierie des Protocoles (CFIP), 2008.
[11] D. Malone and M. Luckie. Analysis of icmp quotations. Passive and Active Network Measurement, pages 228–232, 2007.
[12] A. Quereilhac, M. Lacage, C. Freire, T. Turletti, and W. Dabbous. Nepi: An integration framework for network experimentation. In Software, Telecommunications and Computer Networks (SoftCOM), 2011 19th International Conference on, pages 1–5. IEEE, 2011. [13] N. Spring, R. Mahajan, and D. Wetherall. Measuring isp topologies
with rocketfuel. ACM SIGCOMM Computer Communication Review, 32(4):133–145, 2002.
[14] R. Steenbergen. A practical guide to (correctly) troubleshooting with traceroute. North American Network Operators Group, pages 1–49, 2009.
[15] Y. Vanaubel, J.-J. Pansiot, P. M´erindol, and B. Donnet. Network finger-printing: Ttl-based router signatures. In Proceedings of the 2013 confer-ence on Internet measurement conferconfer-ence, pages 369–376. ACM, 2013.